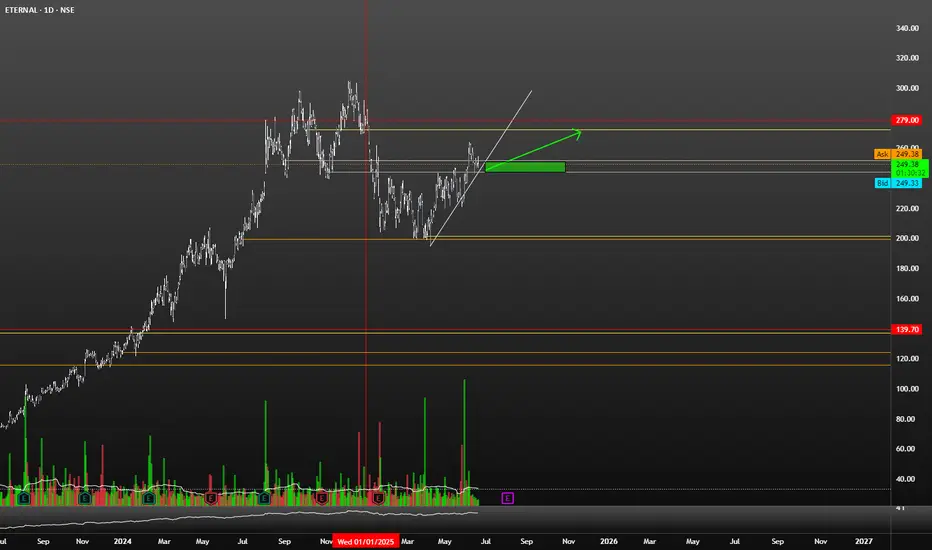
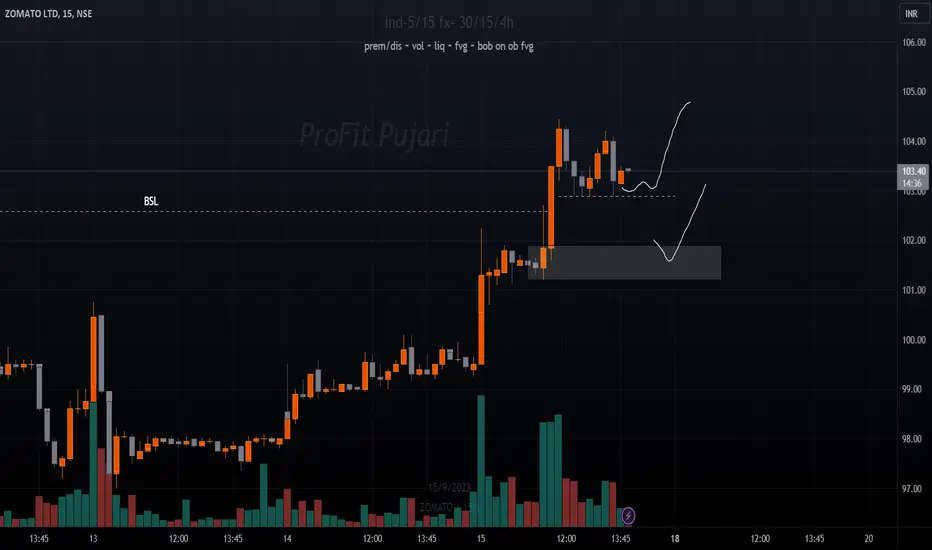
$NSE:ETERNAL To SkyRocket in the Coming Days !NSE:ETERNAL
Very Good Price Action is Already Formed.
Its the Time to make Accumulations of Stock near the Current price.
Its The Company, Which Goin to Cater Services the Future.
Its Now or Never !
Boost the idea ! Pal
Zomato
Option Chain AnalysisTable of Contents
Introduction to Option Chain
What Is an Option Chain?
Key Components of an Option Chain
Call vs. Put Options in the Chain
How to Read an Option Chain
Open Interest (OI) Analysis
Implied Volatility (IV) Analysis
Strike Price Selection
Support and Resistance Levels from Option Chain
Option Chain for Intraday & Swing Trading
1. Introduction to Option Chain
In the world of options trading, success is not just about buying calls or puts randomly—it’s about understanding market data. One of the most important tools for analyzing this data is the Option Chain. Whether you're a beginner or an advanced trader, mastering option chain analysis can help you identify market sentiment, key levels, and trading opportunities.
2. What Is an Option Chain?
An Option Chain, also known as an Options Matrix, is a tabular representation of all available option contracts (both Call and Put) for a particular underlying asset—like Nifty, Bank Nifty, Reliance, TCS, etc.—for a specific expiry date.
It shows:
Strike prices
Premiums (Prices)
Open interest (OI)
Volume
Implied volatility (IV)
Bid/ask prices
Think of it like a menu card for options, showing all the possible trades you can take, and key stats about each.
3. Key Components of an Option Chain
✅ Strike Price:
The price at which you can buy (Call) or sell (Put) the underlying asset.
✅ Premium (LTP):
The last traded price (LTP) of the option.
✅ Open Interest (OI):
The number of open contracts for a strike price. Indicates trader interest.
✅ Change in OI:
The change in open positions compared to the previous day.
✅ Volume:
The number of contracts traded in the current session.
✅ Implied Volatility (IV):
Market's expected volatility of the underlying asset.
4. Call vs. Put Options in the Chain
In every option chain, you’ll see two sections:
Call Options (Left side) Put Options (Right side)
Bullish expectation Bearish expectation
Buy if expecting upside Buy if expecting downside
Sell if expecting sideways/down Sell if expecting sideways/up
Usually, the middle column contains strike prices, with Call data on the left and Put data on the right.
5. How to Read an Option Chain
Let’s take an example:
Assume Nifty is trading at 22,200. You look at the Nifty option chain.
You’ll see multiple rows of strike prices (e.g., 22,000, 22,100, 22,200…) and for each, data like LTP, OI, IV.
Look for:
ATM (At-the-money): Closest strike to the current price (22,200).
ITM (In-the-money): For calls, strikes < spot; for puts, strikes > spot.
OTM (Out-of-the-money): For calls, strikes > spot; for puts, strikes < spot.
Example:
22,200 is ATM.
22,100 Call is ITM.
22,300 Call is OTM.
6. Open Interest (OI) Analysis
OI is one of the most powerful indicators in option chain analysis. It shows where traders are placing their bets.
✔️ What to Look For:
High OI = Strong interest at that strike.
Increase in OI = New positions being added.
Decrease in OI = Positions being closed.
✔️ Interpretations:
High OI in Call → Resistance level.
High OI in Put → Support level.
Let’s say:
22,500 Call has 30 lakh OI → Strong resistance.
22,000 Put has 35 lakh OI → Strong support.
This gives you the trading range of Nifty: 22,000 to 22,500.
7. Implied Volatility (IV) Analysis
IV represents the market's future expectations of volatility. Higher IV means higher premiums.
✔️ Why IV Matters:
When IV is high, options are expensive.
When IV is low, options are cheaper.
✔️ Practical Use:
Sell options when IV is very high (premium is inflated).
Buy options when IV is low (premium is cheap).
8. Strike Price Selection
Choosing the right strike is key for successful trading.
✔️ For Buying Options:
Buy slightly ITM for better delta and time value.
ATM works for short-term, fast movements.
✔️ For Selling Options:
Sell OTM options with high OI and low IV.
✔️ Tip:
Always check the OI and IV before choosing a strike. Avoid illiquid strikes (with low OI or volume).
9. Support and Resistance Levels from Option Chain
You can spot support and resistance based on OI data.
✔️ Support:
Strike where Put OI is highest.
E.g., 22,000 Put with highest OI = Support zone.
✔️ Resistance:
Strike where Call OI is highest.
E.g., 22,500 Call with highest OI = Resistance zone.
This helps you create a trading range.
10. Option Chain for Intraday & Swing Trading
✅ Intraday Trading:
Watch change in OI during live market.
Spike in Call OI → Possible resistance forming.
Spike in Put OI → Possible support forming.
✅ Swing Trading:
Analyze overall OI trend.
Look at monthly expiry data.
Identify positional buildup or unwinding.
Risk Management in Options TradingTrading options can be exciting and rewarding—but it's also full of risks. Without proper risk management, even the best strategies can lead to heavy losses. In this comprehensive guide, we'll dive deep into how to manage risk in options trading, covering everything from the basics to advanced techniques.
1. Understanding Risk in Options Trading
Before we dive into managing risk, it’s crucial to understand where risk comes from in options trading. Options are complex instruments that behave differently than stocks. The key sources of risk include:
A. Price Movement (Delta Risk)
When the price of the underlying stock moves up or down, the value of the option changes. This is known as Delta risk. A call option gains value when the stock goes up, and a put gains value when it goes down.
B. Time Decay (Theta Risk)
Options lose value over time. Even if the stock price doesn’t move, the option could still lose value as the expiration date approaches. This is known as Theta decay or time decay.
C. Volatility (Vega Risk)
Volatility reflects how much a stock moves. High volatility increases an option's premium. But if implied volatility falls, the value of your option might drop—even if your price prediction is correct.
D. Interest Rates and Dividends (Rho and Dividend Risk)
Although less impactful, interest rates and dividend changes can also influence option prices. These are more important for longer-dated options.
2. Why Is Risk Management Critical in Options?
Options give traders leverage—a small investment can control a large position. While this magnifies profits, it also increases losses. Many beginners fall into the trap of chasing big gains, only to blow up their accounts when trades go wrong.
Good risk management doesn’t eliminate risk—it helps you survive bad trades and stay in the game long enough for your edge to work.
3. Core Principles of Options Risk Management
Here are the foundational principles every options trader should follow:
A. Never Risk More Than You Can Afford to Lose
It sounds obvious, but many traders ignore this. Only use disposable capital, not money meant for rent, bills, or emergencies.
B. Position Sizing
This is one of the most powerful tools in risk management. Don’t bet your entire capital on a single trade. A common rule is to risk 1-2% of your capital on any trade. That way, even a string of losing trades won’t wipe you out.
C. Diversify Your Trades
Avoid putting all your trades on the same stock or sector. Diversification can reduce risk from unexpected news events or market shocks.
D. Know Your Maximum Loss
Before entering any trade, calculate your maximum potential loss. With long calls and puts, your loss is limited to the premium paid. But with short options or complex strategies like spreads, losses can be higher or even unlimited.
4. Practical Risk Management Techniques
A. Use Stop-Loss Orders (Where Applicable)
While options don’t always behave like stocks, you can still set a mental or physical stop-loss based on:
Percentage loss (e.g., exit if the option loses 50%)
Underlying price level (e.g., exit if stock breaks below a key level)
Time decay (e.g., exit 5 days before expiration to avoid Theta crush)
❗ Note: Stop-losses can be tricky with options because of wide bid-ask spreads. It’s important to use limit orders or mental stops to avoid slippage.
B. Avoid Naked Options (Especially Selling)
Selling naked calls or puts can expose you to unlimited risk. Unless you have a large account and full understanding, stick to defined-risk strategies like:
Spreads (credit/debit)
Iron condors
Butterflies
Covered calls
Protective puts
C. Hedge Your Positions
Hedging is like buying insurance. You can reduce risk by combining options in a way that limits losses.
Example:
If you sell a naked put, you can turn it into a bull put spread by buying a lower strike put. This limits your downside if the stock crashes.
D. Use Probability and Greeks
Understanding the "Greeks" can help you analyze risk exposure:
Greek What it Measures Risk Managed
Delta Price sensitivity Directional risk
Theta Time decay Time-related loss
Vega Volatility impact Volatility exposure
Gamma Delta’s change rate Acceleration of price impact
Rho Interest rate impact (minor risk)
Knowing your Greeks allows you to adjust trades when risks become too high.
5. Options Strategies for Risk Management
Some strategies are naturally more “risky,” while others are designed to limit downside. Let’s look at popular risk-managed strategies:
A. Covered Call
You own 100 shares of a stock and sell a call option. This gives you income (premium) and limits upside risk.
Risk: Stock falls
Reward: Premium + upside to strike price
B. Protective Put
You buy a put while holding the stock. It protects you from downside losses, like insurance.
Risk: Cost of put (premium)
Reward: Unlimited upside; limited downside
C. Vertical Spreads (Credit and Debit)
These involve buying and selling options at different strikes.
Bull Call Spread: Buy call + sell higher call
Bear Put Spread: Buy put + sell lower put
Both strategies have limited risk and reward, making them ideal for risk-conscious traders.
D. Iron Condor
You sell a call spread and a put spread on the same stock. Profitable when the stock stays in a defined range.
Risk: Limited to width of spread minus premium
Reward: Net credit received
This is a great strategy for sideways markets and offers good risk/reward if managed well.
6. Managing Risk Over Time
A. Adjusting Trades
If a trade moves against you, you don’t always have to take the loss. You can:
Roll the option to a later expiration
Adjust strikes to collect more credit or redefine risk
Convert to a spread or different strategy
However, be careful not to over-manage trades, which can lead to complex and risky positions.
B. Avoid Trading Around Events
Earnings announcements, Fed meetings, and budget declarations can cause huge volatility spikes. Option premiums are often inflated before such events. If you trade them, keep position size small and use defined-risk trades only.
Institutional Trading Process 1. Investment Idea Generation
This is where it all begins.
Institutions generate trading ideas based on:
Fundamental research (company earnings, macroeconomic data)
Quantitative models (statistical or algorithmic strategies)
Technical analysis (price action, trends, volume)
Sentiment analysis (news flow, social media, market psychology)
Often, the research team, quant team, or portfolio managers work together to develop high-conviction trade ideas backed by data and analysis.
2. Pre-Trade Analysis and Risk Assessment
Before placing a trade, institutions perform:
Risk/reward analysis
Scenario testing (How does the trade perform in different market conditions?)
Volatility analysis
Position sizing based on portfolio risk budget

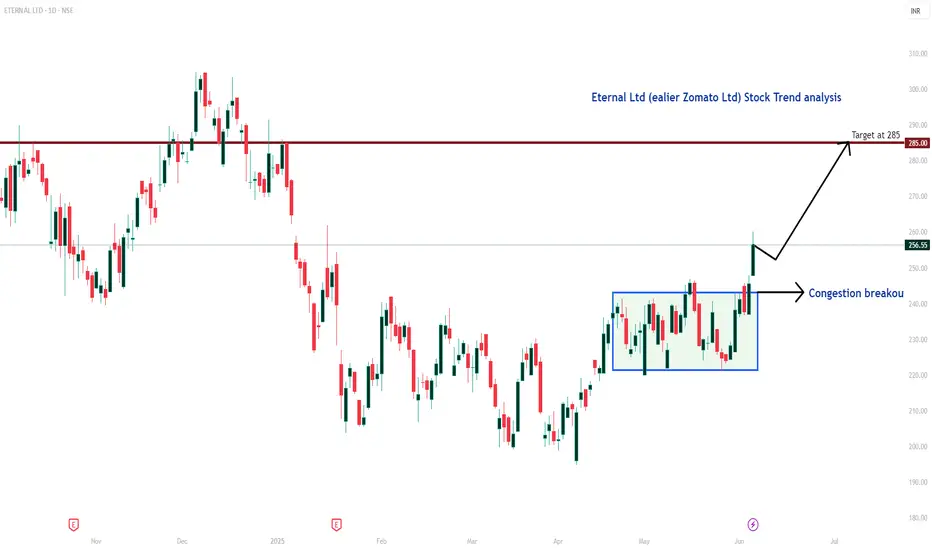
Eternal Ltd Daily Trend AnalysisEternal Ltd (formerly Zomato Ltd) has broken out of a consolidation phase, indicating the potential start of a bullish trend. The stock appears poised to reach the target level of ₹285 in the near term.
Disclaimer: Traders are encouraged to perform their own technical analysis and implement proper risk management before initiating any positions.
Best Time To Buy Or Long in $NSE:ZOMATO | Accumulate Now !NSE:ZOMATO
Yeah !
Its Best Time to Accumulate it here, Company is not For Only Current Generation, it serves the Generation ahead and Always a Big Part of Peoples Life.
Invest Now!
Do Sip's !
From 200 to 250 Is The Range to Make Positions.
yup I m in It.
Thanks
⚠️Disclaimer: We are not registered advisors. The views expressed here are merely personal opinions. Irrespective of the language used, Nothing mentioned here should be considered as advice or recommendation. Please consult with your financial advisors before making any investment decisions. Like everybody else, we too can be wrong at times ✌🏻

Zomato Set to Fall After Disappointing QuarterZomato's share price has already fallen around 12% from its day high, following the release of disappointing quarterly results. In Q3, Zomato's net profit declined by 57% year-over-year, totaling 59 crore rupees. Due to this poor performance, selling pressure is likely to continue. The stock is currently near its intraday support level of 230 rupees, which is likely to break.
We should wait until the share price breaks below this level and sustains there for a while before considering a short trade. However, if the share price opens with a gap down, we should wait for a retest of the 230 rupee price level before entering the trade. Our first target for this trade would be the 200 rupee price level, which represents a potential decrease of approximately 13% from the current point.

ZOMATO- KEY PRICE LEVELSThe entire move from the Flash crash level of JUNE 4 on ZOMATO
Targets at lower levels marked, should hit the 0.618 FIB level if we see move below 226 where it stopped yesterday.
May not break 200-207, wick down to 200 possible but likely to hold barring a major sell off
Stops below 200 for short term trades when it does come down to 210 odd

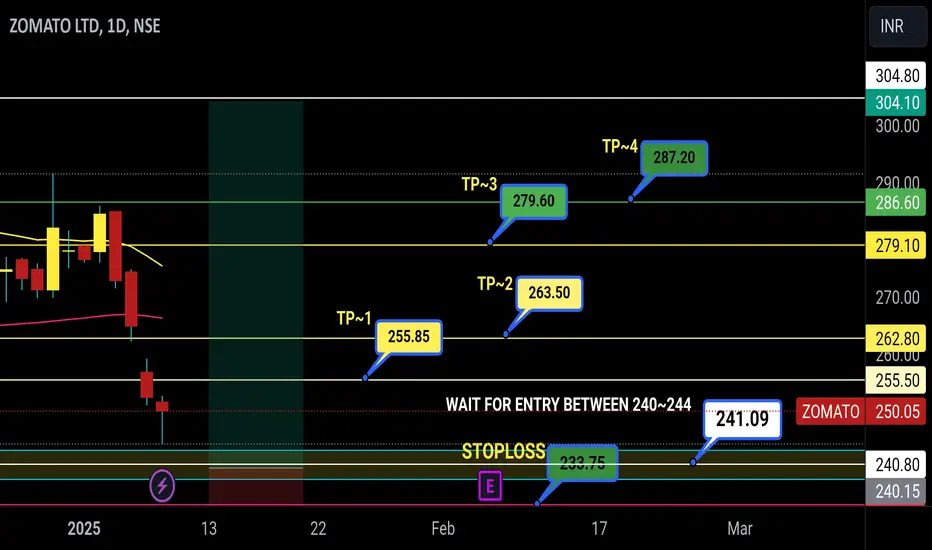
#bullish zone ''zomato signaling uptrend...( near support zone)investing idea Observations and Analysis for NSE:ZOMATO
1.Price Correction:
Zomato has seen a 26% correction, primarily due to market volatility. The price is approaching a strong support zone between ₹240-₹244, which presents a potential buying opportunity for long-term investing.
2.Entry Strategy:
Entry Zone: Wait for confirmation of price stability within ₹240-₹244 before entering a position.
🔴Stop-Loss: Set a strict stop-loss at ₹233.74 to minimize potential losses.
3.Target Levels:
🟢TP1: ₹255.55
🟢TP2: ₹262.90
🟢TP3: ₹279.10
🟢TP4: ₹286.45
4.Risk Management:
Use proper position sizing and risk management as the market remains volatile. Ensure you do not risk more than you can afford to lose.
🟠Disclaimer:-
I am not a SEBI-registered advisor. This analysis and the suggested levels are for educational purposes only. Please consult a professional financial advisor for personalized investment advice. Trade responsibly and at your own risk.
If you find this analysis helpful, please like and share!
Zomato Ltd. - Head and Shoulders PatternA potential Head and Shoulders pattern is visible on the daily chart, signaling a possible trend reversal. Here's a detailed breakdown:
Pattern Highlights:
Left Shoulder: Formed in mid-August with resistance near ₹279.60.
Head: A peak in September crossing ₹279.60 but failing to sustain.
Right Shoulder: Currently forming, respecting the resistance zone at ₹279.60.
Key Levels:
Neckline Support: ₹238.99. A decisive close below this level could trigger a bearish breakdown.
Resistance: ₹279.60, acting as a strong barrier for bullish momentum.
Indicators:
RSI (Relative Strength Index): Currently neutral but showing potential weakening momentum.
Moving Averages: Price hovering near the 50-day EMA, with the 200-day SMA as a key support level.
Potential Scenarios:
Bearish Breakdown: A close below ₹238.99 may open doors to lower levels, with the first target around ₹220.
Bullish Invalidity: A breakout above ₹279.60 could invalidate the pattern, leading to further upside momentum.
Volume Insights:
Noticeable volume reduction in the right shoulder formation, aligning with the classic characteristics of this pattern.

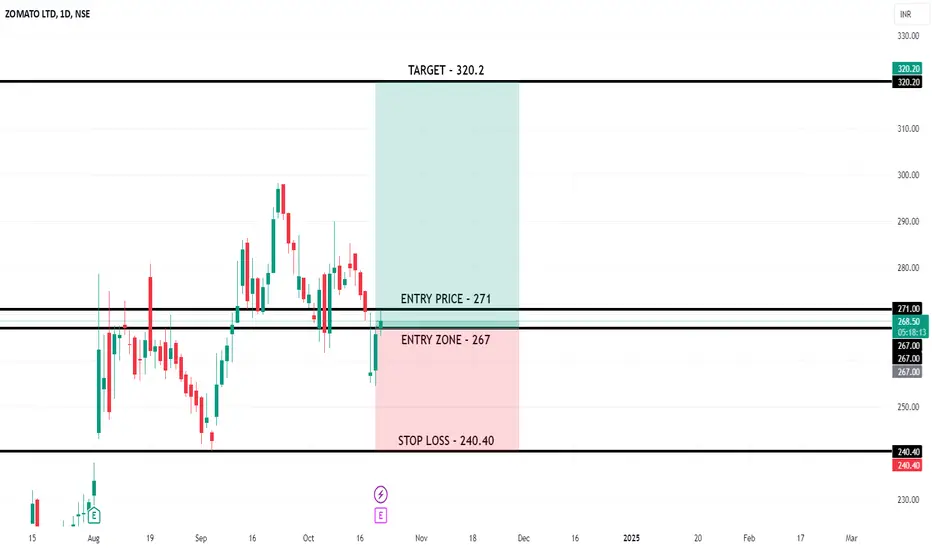
Zomato - Swing Long SetupZomato has already broken the entry zone on the 15-minute chart , confirming the entry price at 271 . This setup is valid only for today. Here’s the trade plan:
Entry Price: 271
Target: 320.2
Stop Loss: 240.40 (Stop loss will trigger only if a daily candle closes below this level)
With the entry confirmed at 271 , I’m aiming for a potential move toward 320.2 . The stop loss is set at 240.40 , but will only be triggered if a daily candle closes below this level.
Important: This setup is valid for today only. I'll reassess after today's close for further action.
Disclaimer: This post is for educational purposes only and is not financial advice. Always manage your risk and trade responsibly.
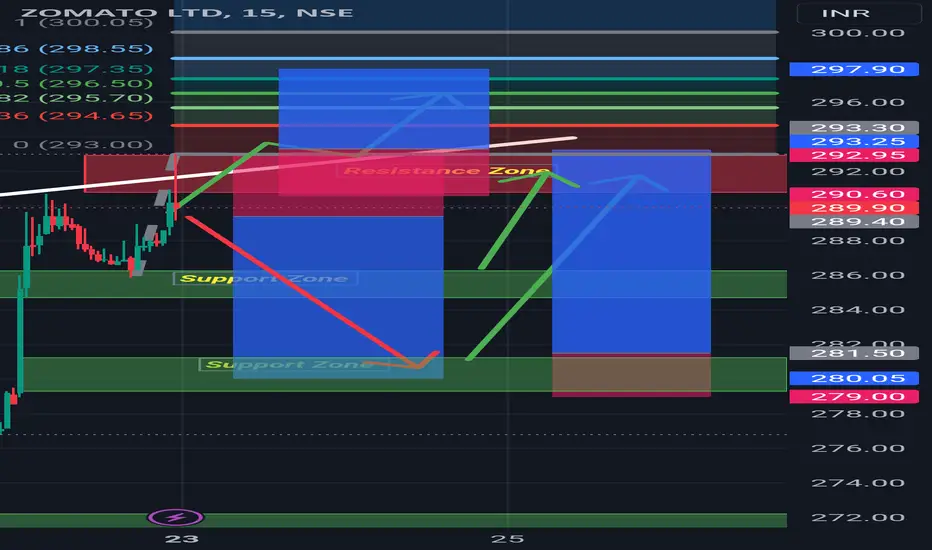
Zomato Intraday Levels : 23-Sep-24 Stock closed near Resistance Zone wait for breakout or rejections at marked zone for entry. All expected entry zone Mentioned on Chart
Bullish > 293
Bearish< 289
Use SL trailing method to secure peofits
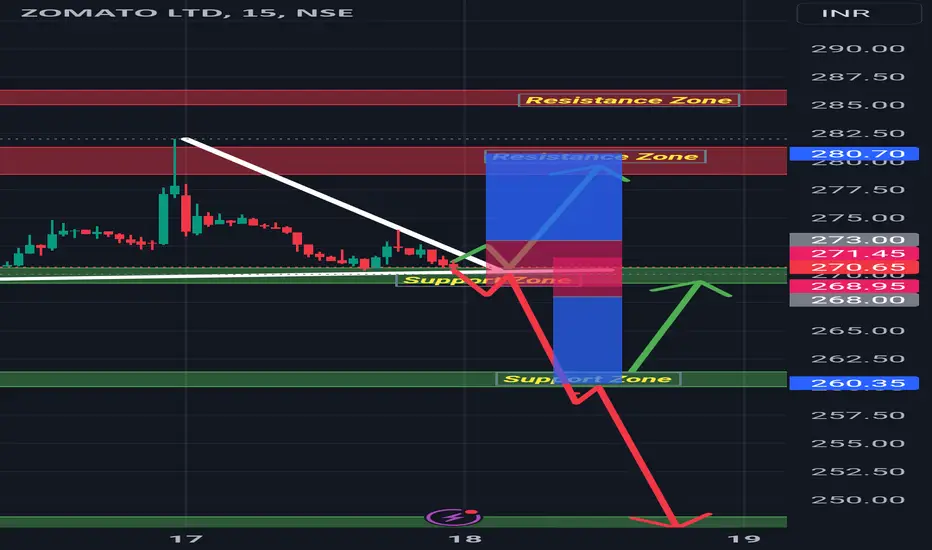
Zomato Intraday Levels : 18-Sep-24Stock closed at support Zone. Rejection from zone and Trendline upside Breakout can expect upside momentum else breakout of support drag price for downside
Bullish > 273
Bearish < 268
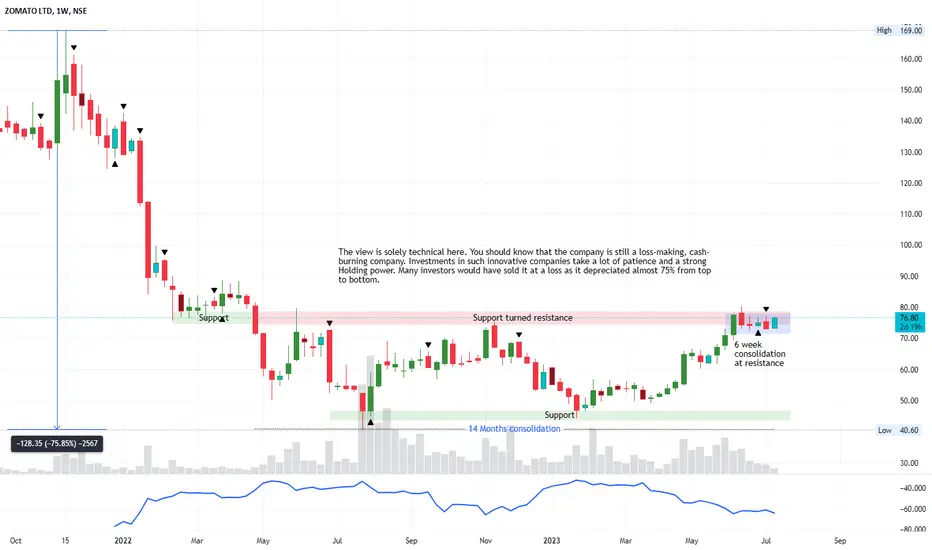
Zomato: Your order is ready?Here are things you should know:
- 14 months of pure sideways consolidation
- Clearly defined support and resistance
- 6 Week consolidation at the resistance zone makes the resistance weak
- Volumes have died out. That usually happens when the price consolidates
- Investing in such companies is a matter of trust and confidence in the company and its management. It may take a while for such innovative companies to generate wealth with long-term holdings.
What is your take on it? Feel free to comment. If it helped, Do Leave us a boost 🚀
Disclaimer: We are not registered advisors. The views expressed here are solely personal opinions. Irrespective of the language used, Nothing mentioned here should be considered as advice or recommendation. Please consult with your financial advisors before making any investment decisions. We like everybody else, have the right to be wrong :)
ZOMATO IN BULLISH TRAJECTORYZomato's stock appears to be on a bullish trajectory, with market indicators pointing towards a target of 200. Investors are eyeing potential gains, while also implementing a stop loss at 173 to manage risks effectively and safeguard against potential downturns

Trade idea in Zomato for Long term Zomato Ltd. engages in the business of operating as an internet portal. It operates through the following segments: India Food Ordering and Delivery; Hyperpure Supplies; Quick Commerce Business; and All Other. The company was founded by Pankaj Chaddah, Gunjan Patidar, Mohit Gupta, Deepinder Goyal, and Gaurav Gupta in 2008 and is headquartered in Gurgaon, India. NSE:ZOMATO
I am Bullish in Zomato for an extremely long term period
And if it publishes magnificent Q4 results as well then I am buying more

ZOMATO LTD is looking bullish.Zomato is almost trading near its all-time high. Monthly, weekly, and daily RSI is above 60.
Volume is increasing as it is nearing its ATH.
The chart pattern looks like a cup, and the break line is crossed with a fair volume.
One can easily trade for a 1:2 Reward Ratio and trail if the up trend continues.

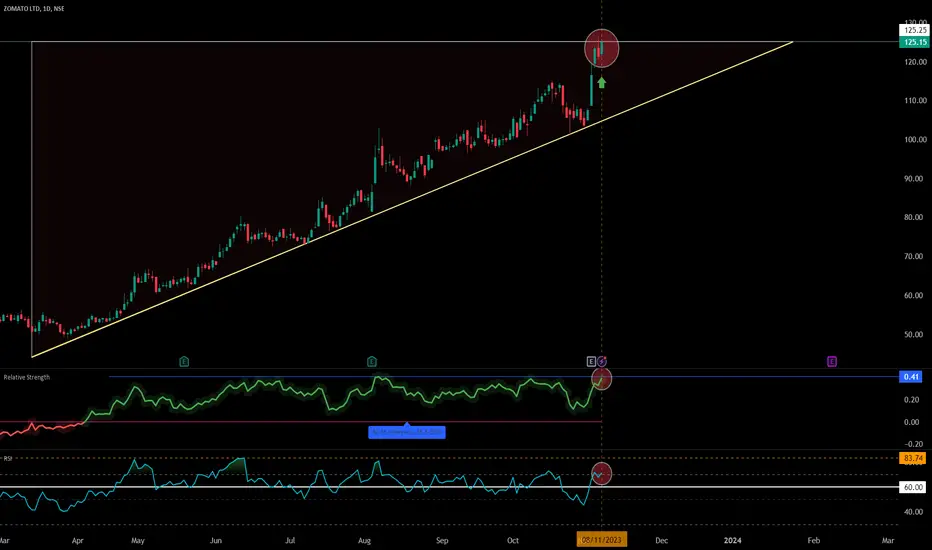
ZOMATO ZOOMING UP? 🚀Zomato Ltd has come a long way to form a ascending triangle pattern while respecting the upward sloping trendline. The stock also seems to be outperforming NIFTY Index. RSI levels too support the stock to zoom up new levels and break its previous zones from where it fell sharply. On the charts it looks like a breakout is imminent in the near term.
Disclaimer: None of the posts here represent any buy/sell advice. Only sharing the analysis for educational purposes.
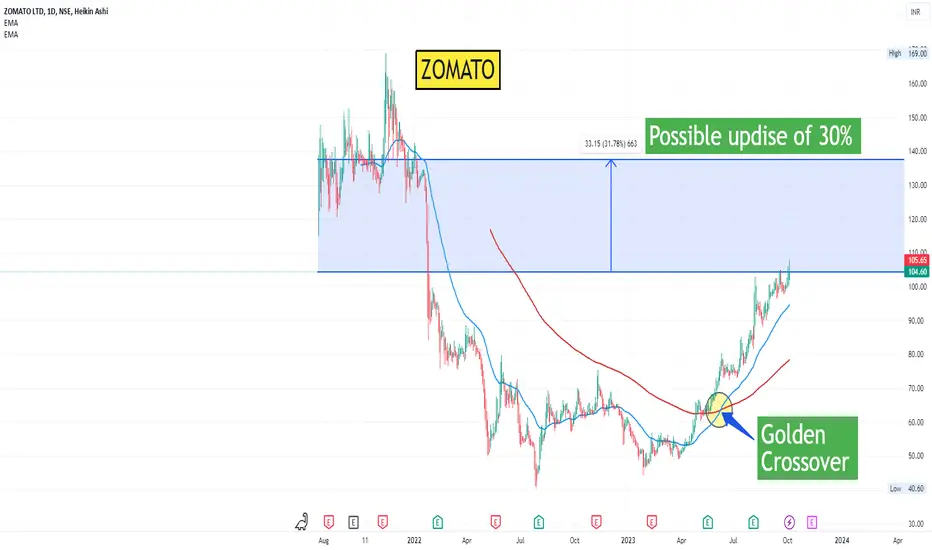
ZOMATO - Golden Cross Possible upside of 30%NSE:ZOMATO
After a year of downtrend, Golden crossover has formed indicating possible long upside for 3 to 6 months.
Highly possible that if the market give good rally then the share would break previous high (Rs. 168).
Note: Trade with caution! Do not trade solely based on my strategies, these are just individual ideas, kindly consult your investment advisor before taking trades.
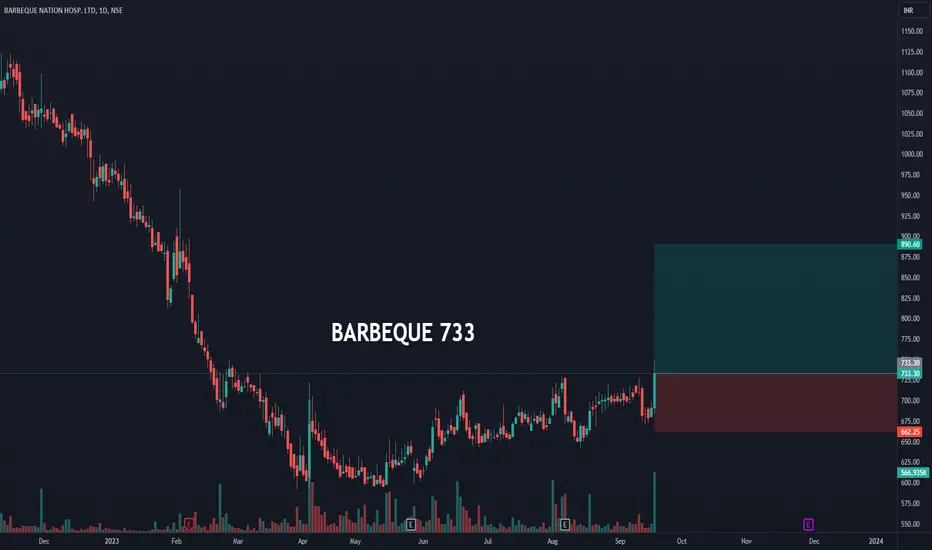
#BARBEQUE 733 - 20% upside Buy recommended - Rachit SethiaNSE:BARBEQUE
BARBEQUE 733
TGT 890
SL 660
TF <6 M
RR >2
Return > 21%
Factors: BULLISH WEDGE BREAKOUT Trend Following Rising Volume with rising Prices. Flag pattern breakout. Pennant Pattern Breakout with Bullish Candle. Retest Successful. Higher Highs & Higher Lows. Broken above RESISTANCE levels Trading at SUPPORT levels Earnings are strong. Bullish Wedge Breakout Risk Return Ratio is healthy. And Rising from Double Bottom Pattern to Flag Pattern forming. If you like my work KINDLY LIKE SHARE & FOLLOW this page for free Stock Recommendations. With 💚 from Rachit Sethia
#ZOMATO INTRADAY TRADE SETUP Greetings Folks,
today i have prepared a setup of ZOMATO on NSE
the analysis is as follows
- the stock is one of the volume leaders today
- broke out of previous with good volume
- now doing the traditional retest
- you can buy now or go for a conservative entry with the below zone i marked
dont play with fire, always use predefined stoploss
ZOMATO be FEARFUL when others are GREEDY!It's simply the best time to exit ZOMATO according to me.
I have updated the wave counts for your reference.
It's most likely to form a WXY pattern on a cycle degree.
Wave Y may form ending diagonal in 5 wave formation with a downside of upto 26 level.
A fall of around 73% from CMP.
I am just sharing my views here.
You do your own due diligence before taking any action.
Peace!!

Bullish Pennant Breakout: ZOMATO Faces Strong ResistanceZOMATO has encountered a significant daily resistance level following a recent breakout from a bullish pennant pattern. The price action indicates a notable rejection, as the highlighted resistance level is being respected. In the 84-87 region, there has been substantial selling pressure, resulting in a significant price drop. The historical price movement suggests that the bullish sentiment may start to weaken or slow down.
