💡 ZRX: BUY Trade 🚀🚀🚀🚀🚀🚀Something going big in this project. huge buying going in ZRX. on every drop just buy it sell on target.
Zrx
ZRX/BTC Ichimoku Cloud - Edge-To-Edge Strategy!The ZRX/BTC ichimoku cloud on the daily timeframe is undergoing an edge-to-edge move.
This strategy involves price moving into the cloud from below, and closing inside of the cloud. Once this happens, the edge-to-edge idea suggests price will make its way through the cloud to the other end for a 'kumo breakout' above the cloud.
Think of the cloud as an area of weak resistance/support. If you threw a rock at a real cloud, the rock would go right through that fluffy thing. Replace 'rock' with 'price' and you get the same idea here.


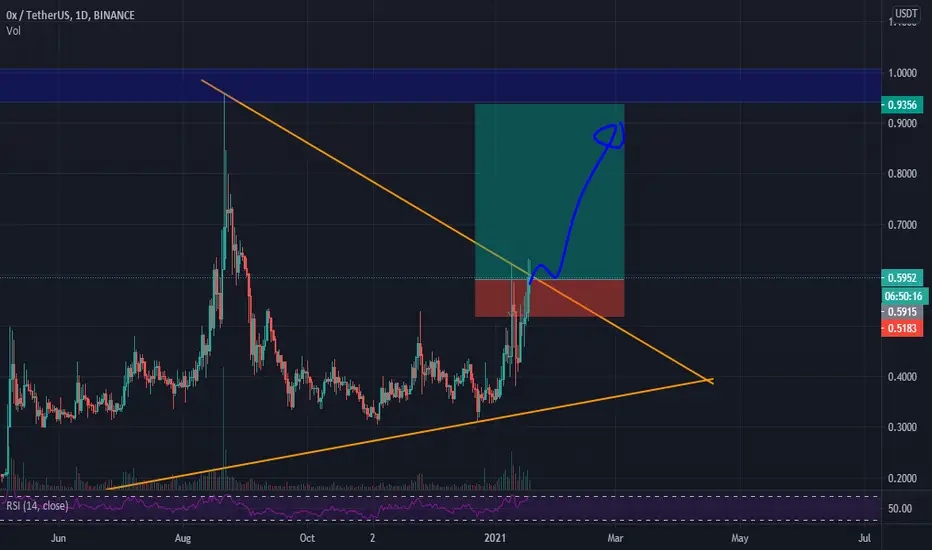
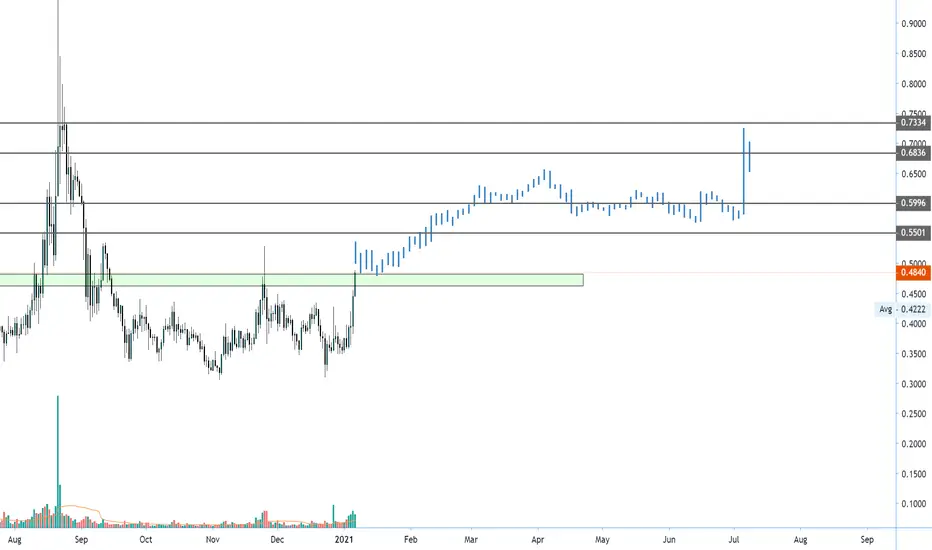
ZRX BREAKING OUT !!ZRX / USDT bullish af
It just broke the resisntace and it is heading to the target.
Potential +28%

ZRXUSDT (0x) - POTENTIAL BREAKOUTANALYSIS 🔎
- ZRXUSDT is consolidating in an ascending triangle pattern.
- This is a bullish build up pattern.
- Price testing the ascending triangle's horizontal resistance.
- There's an upward breakout potential.
BUY ENTRY ⬆️
- Breakout above the ascending triangle's horizontal resistance.
TARGETS 🎯
- Fibonacci extension levels.
SETUP INVALIDATION ❌
- Breakdown below the ascending triangle's inclined support.

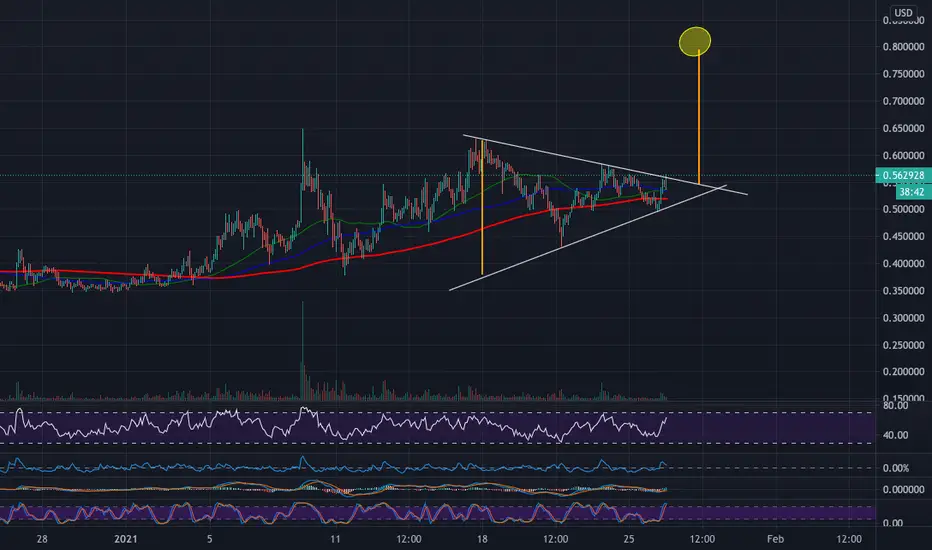
ZRX - About to MOON This exclusive mega coin that the world cannot live without is about to moon to $.80!
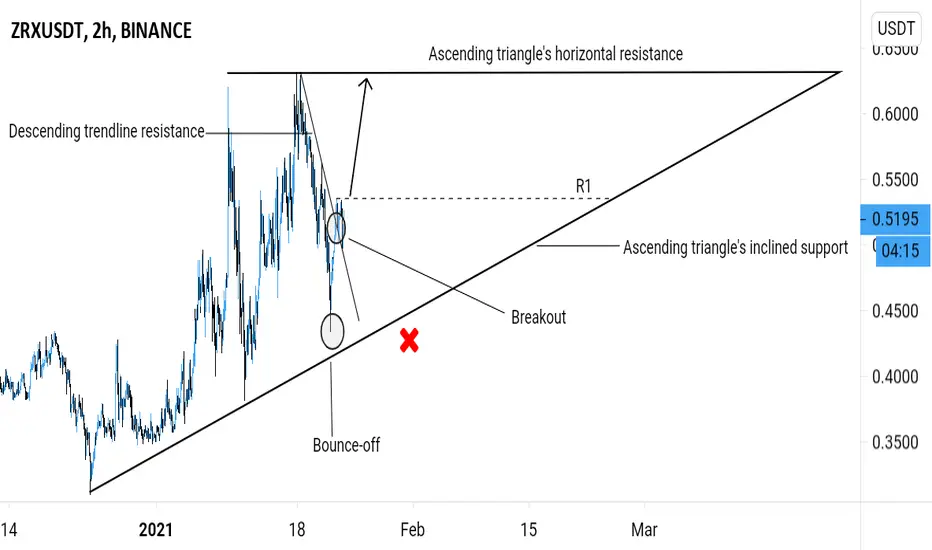
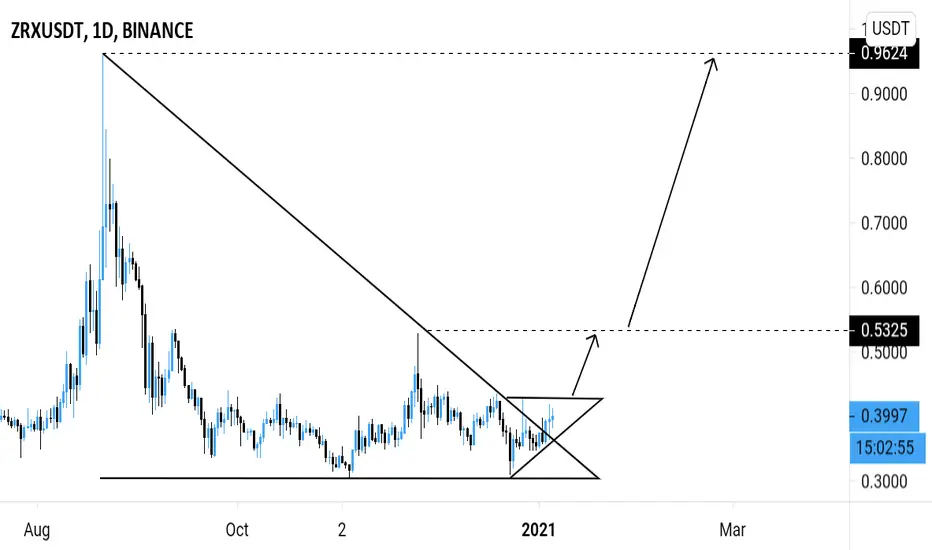
ZRXUSDT - POTENTIAL BUY ENTRY ANALYSIS 🔎
- ZRXUSDT is printing an ascending triangle pattern.
- Price bounced off the ascending triangle's inclined support.
- Price also brokeout above the descending trendline resistance.
- We could see a test of the ascending triangle's horizontal resistance.
BUY ENTRY ⬆️
- Breakout above the horizontal resistance level (R1).
TARGET 🎯
- Ascending triangle's horizontal resistance.
SETUP INVALIDATION ❌
- Breakdown below the ascending triangle's inclined support.
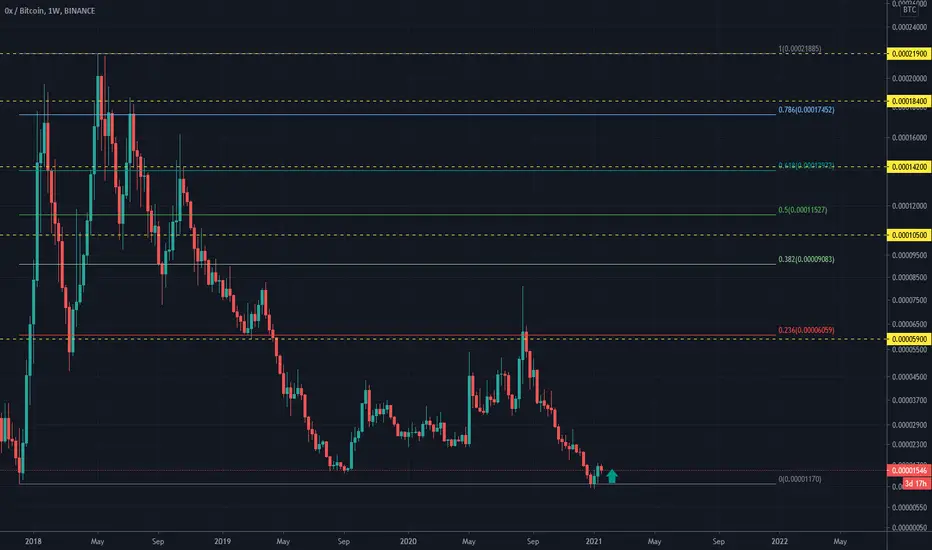
ZRXBTC StatusAfter rejecting from the historical ATL, I think ZRXBTC will move toward the higher resistance level.
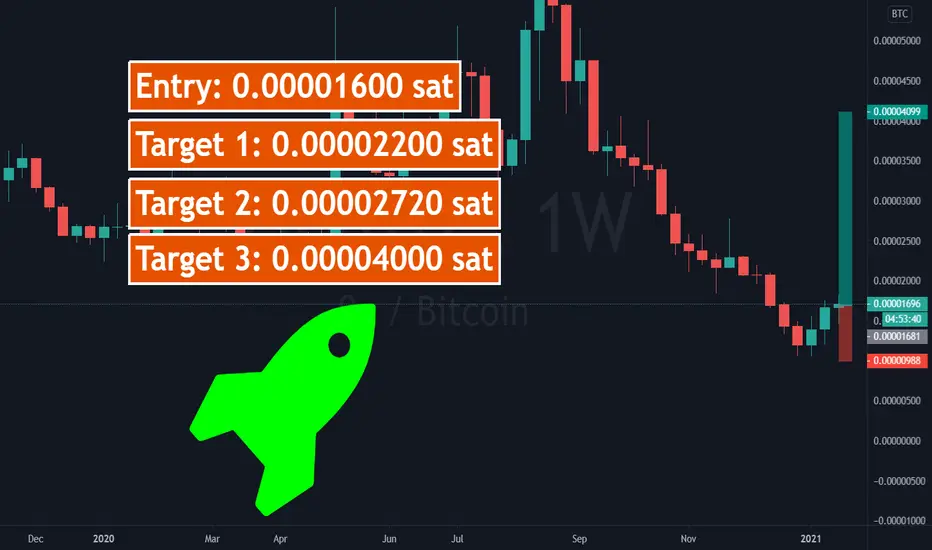
#ZRX, UCTS 1D Buy signal confirmed as its crossing over ~1500#ZRX
UCTS 1D Buy signal confirmed as its crossing over ~1500 sats
Volume not looking that strong yet, but still the bot on @3commas took the trade (12%+ up atm)
cryptontez.medium.com
Looking for a R/S flip at current level OR stronger volume as signal of continuation
#ZRX
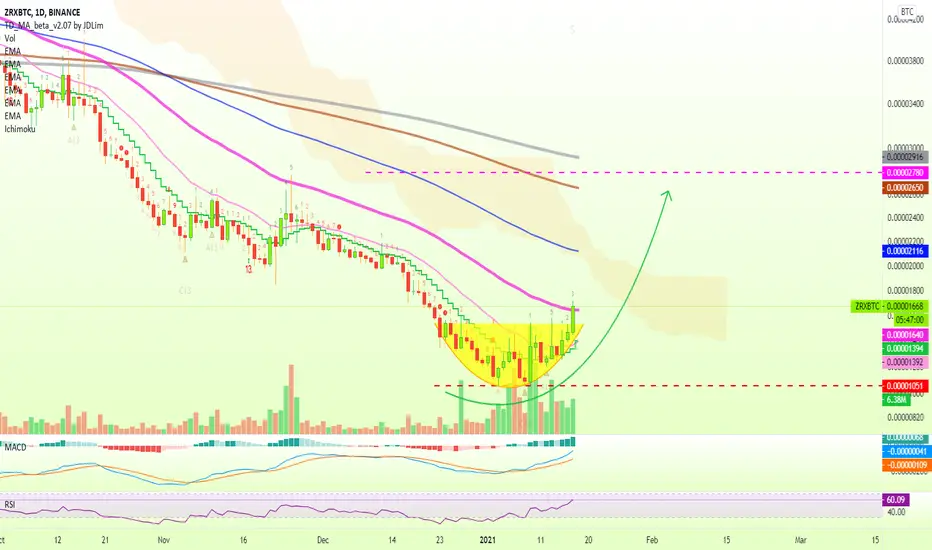
0x (ZRX) Moving Above EMA50 = BullishHere we have the chart for ZRXBTC (0x) which is now clearly leaning forwards the bulls.
In the past three days its price moved above EMA10, EMA21, and now EMA50.
Staying above EMA50 at 0.00001640 gives out a strong bullish signal... Prices can continue higher.
On a close daily below EMA50, support is next found at EMA10/21 or 0.00001390.
The indicators, MACD and RSI, also support a bullish move.
Namaste.

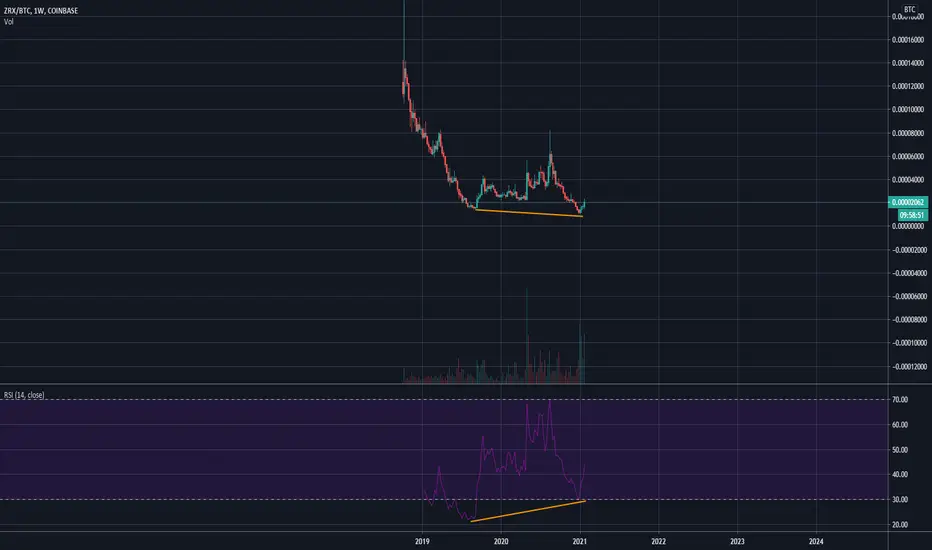
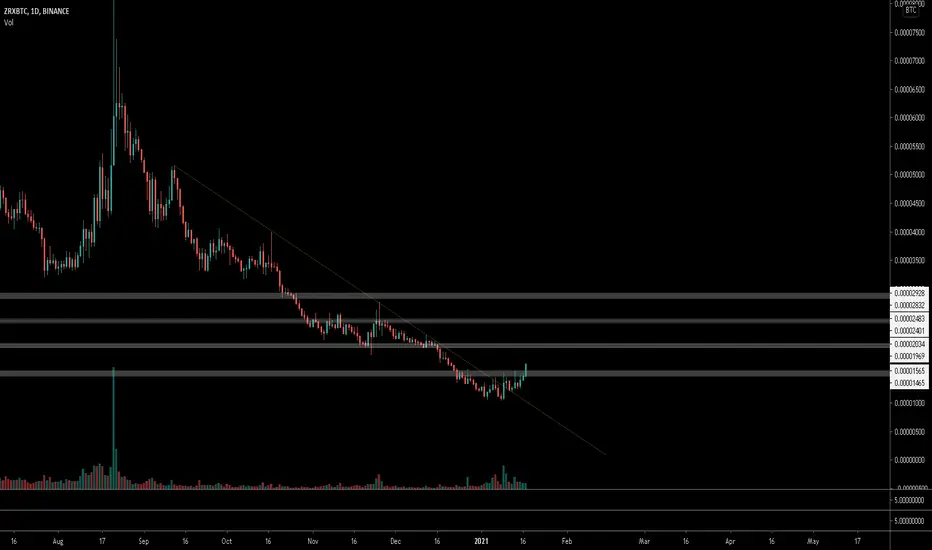
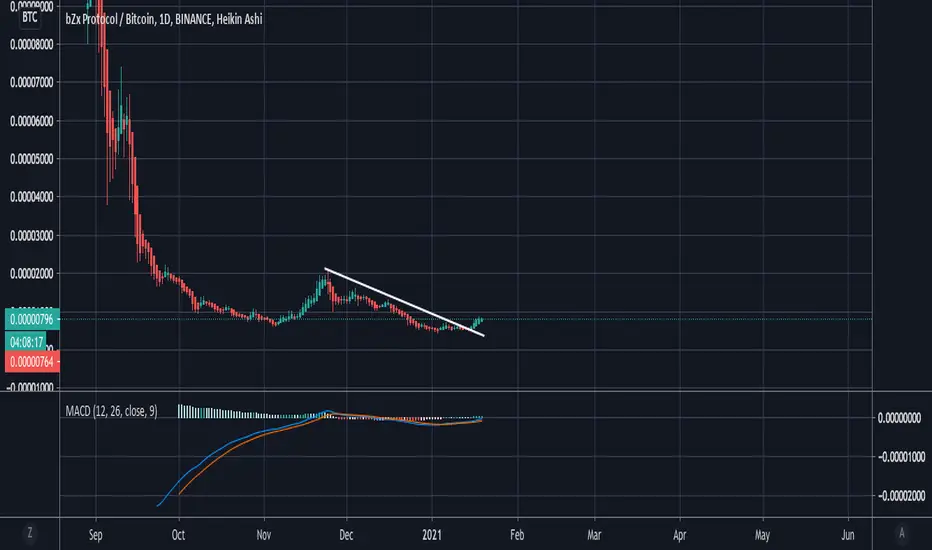
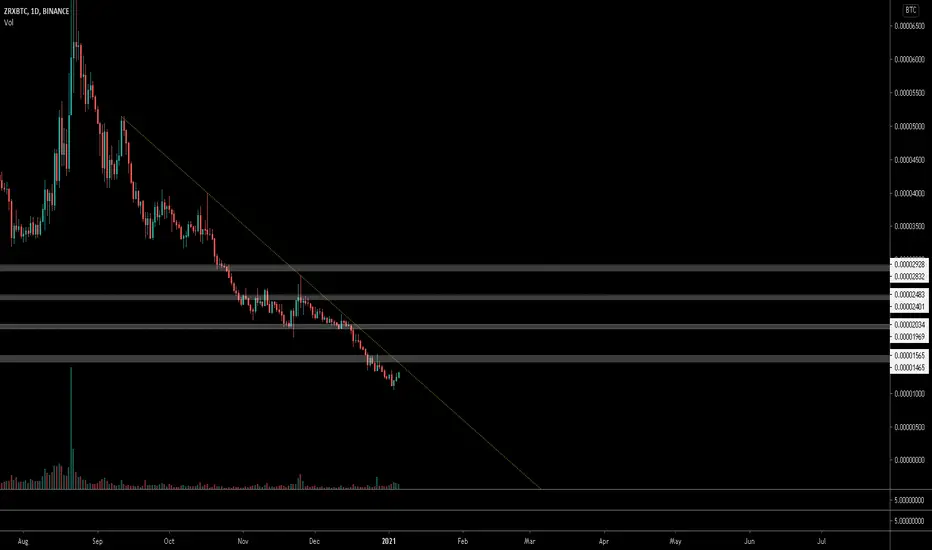
#ZRX, Looking for this long descending trendline to breakout #ZRX
Looking for this long descending trendline to breakout as signal of reversal
Volume also remaining weak but starting to show some activity(like the rest of the Alts market)
UCTS Buy signal could be a trigger for me as well
Upside looks promising
Set alerts and wait
#ZRX
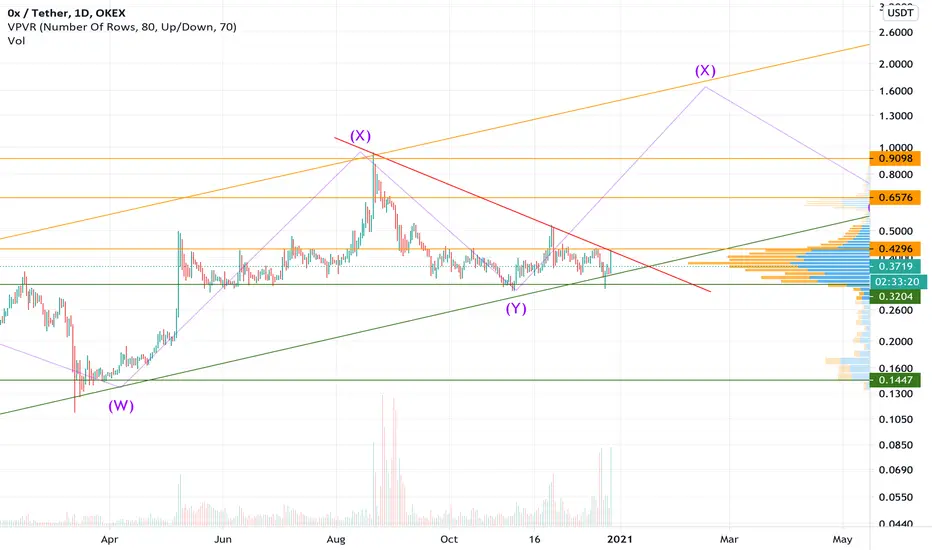
ZRX-USDT Greetings,
price is moving in an uptrend channel, with a potential of about 300% per channel width at the breakout.
ZRX -USDT price is stuck in a channel about 20% wide, between 0.32-0.43.
An entry point may be at the border of this channel or at anchoring above the 0.43 area. Coin may be said to be old from the year 17, but it is on the deficit list. Also see my other ideas for defi projects.
Always use a stop loss, and don't use a leverage greater than x3.
A trader should always have tomorrow.
If you found the information useful, please like and subscribe, so as not to miss anything.
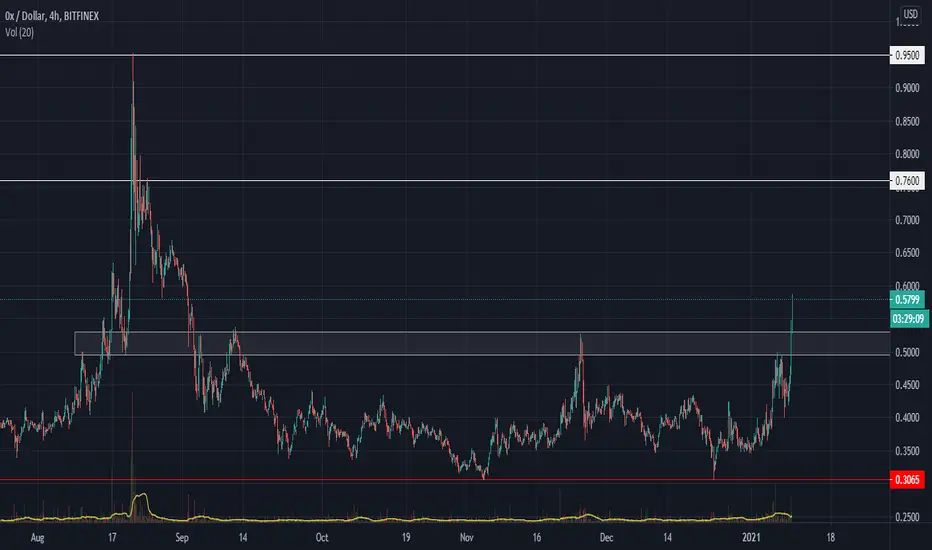
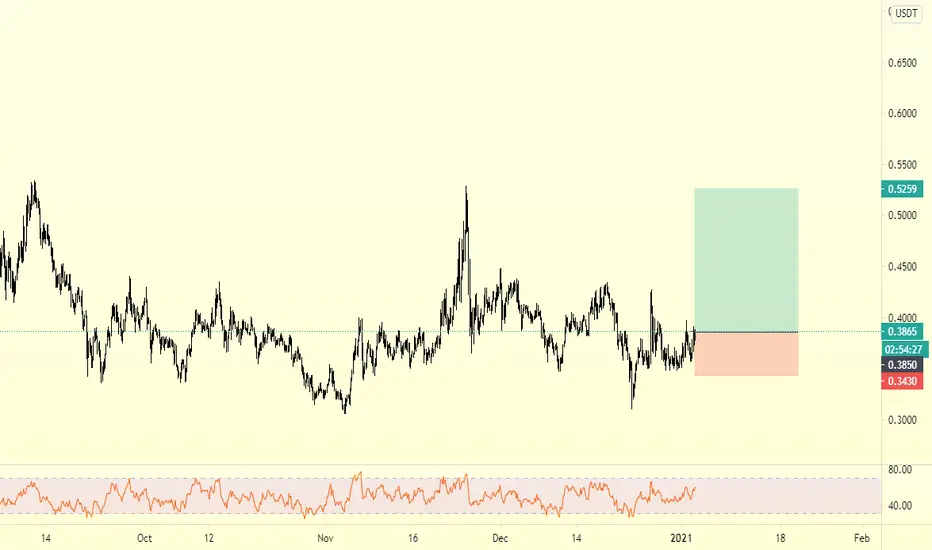
ZRXUSDT - Potential buy entry 🔼ZRXUSDT brokeout above the descending triangle inclined resistance.
Price action is printing a minor ascending triangle pattern.
Potential breakout.
Buy entry ⬆️ - breakout above the minor ascending triangle resistance.
Target 🎯 - resistance levels.
Setup invalidation ❌ - breakdown below the minor ascending triangle inclined support.
ZRX LONG...BULLISH TRENDOpening long position here on ZRX as accumulation is near to end...It will soon explode
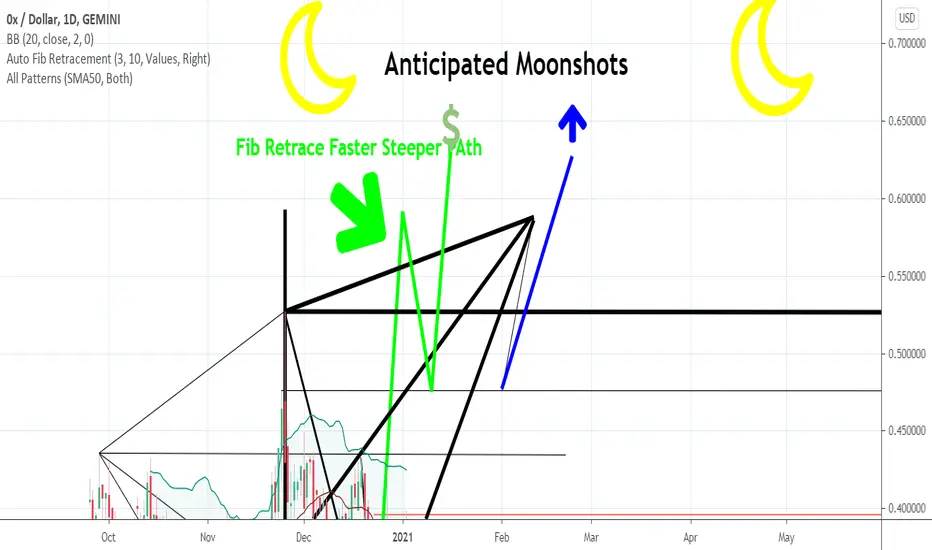
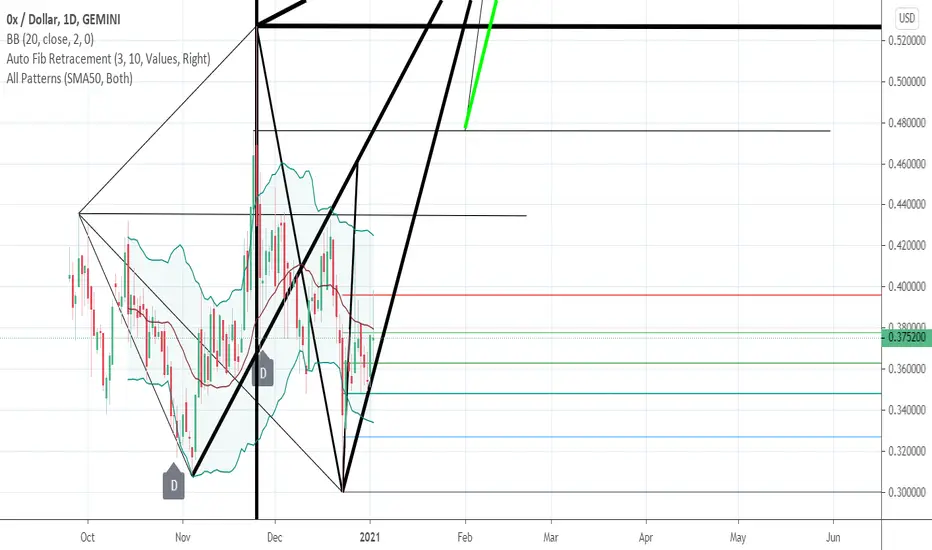
Zrx Gemini DailyHi Folks
This is my idea and thought on the daily ZRX Chart I believe things are about to pick up and get interesting not financial advice research yourself before positioning please like and feel free to comment. 2121 Bullrun
Daily ZRX Chart Hi Folks
Here is my take on the daily ZRX chart on Gemini please feel free to comment and like the support is appreciated. Not financial advice make decisions off and from doing your own research.
ZRXUSDT(4HCHART) channel Breakout#ZRXUSDT Technical Analysis Update
Channel Breakout
ZRX/USDT currently trading at $0.4050
LONG ENTRY level: 0.4000 to 0.4140
STOP LOSS: below $0. 3800
Resistance level 1( Target 1): $0.4470
Resistance level 2 (Target 2 ): $0.5130
Max Leverage: 4X
ALWAYS KEEP STOP LOSS...
Follow our Tradingview Account for more Technical Analysis Update, | Like, Share and Comment your thoughts.
