Zrx
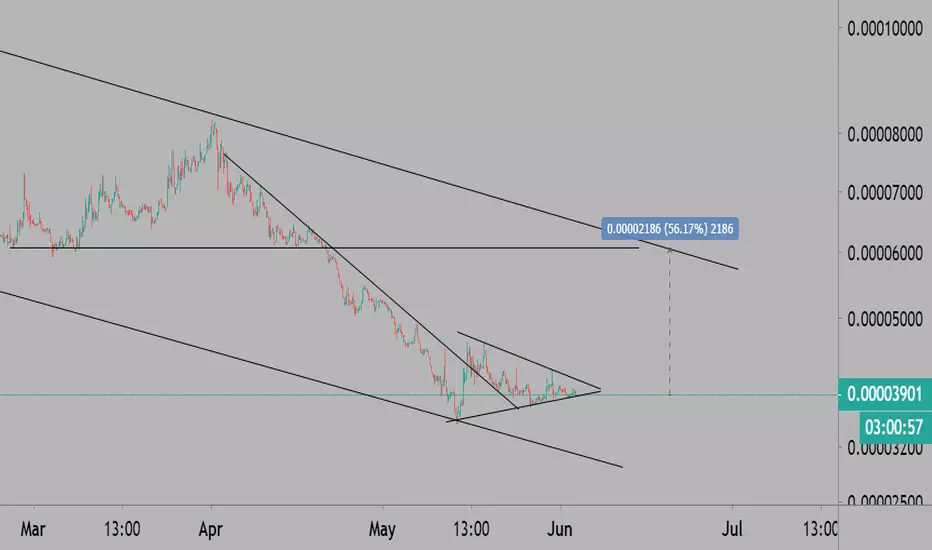


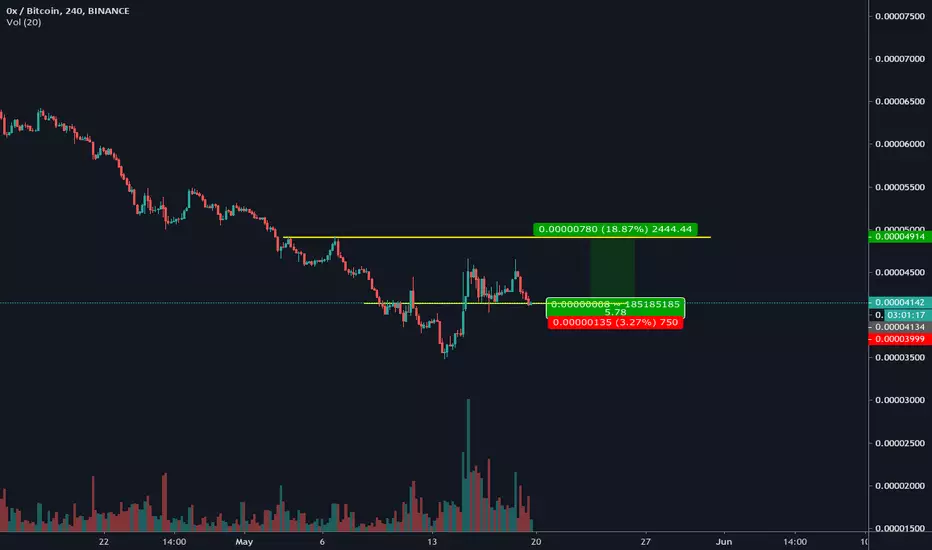
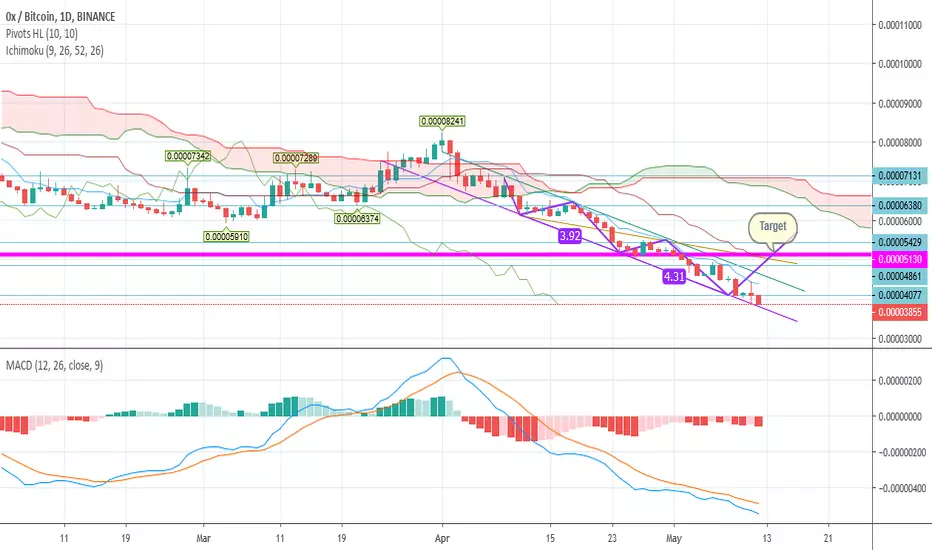
ZRXBTCTriangle formed
More inclined to break up
Risk profit 1 to 3
Enter: 3850 - 3880
Stop: 3675
Target: 4500
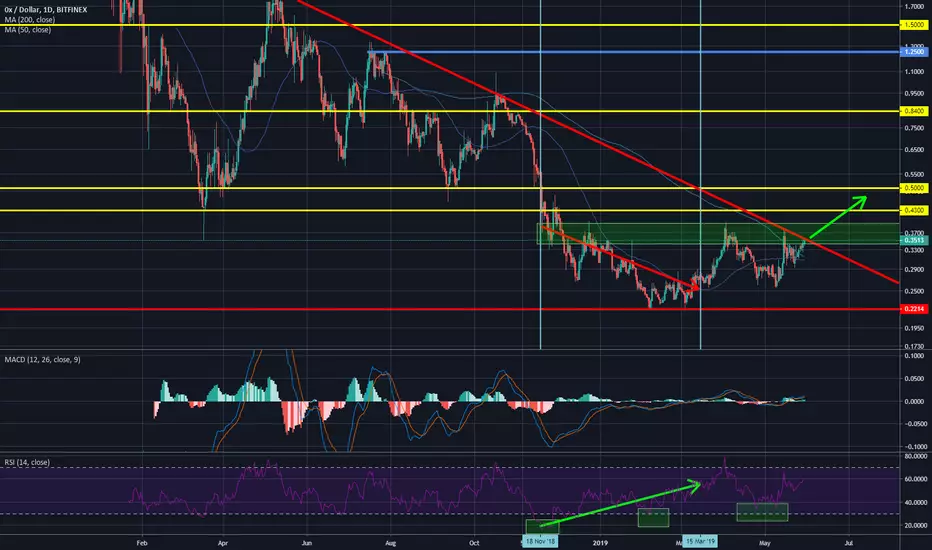
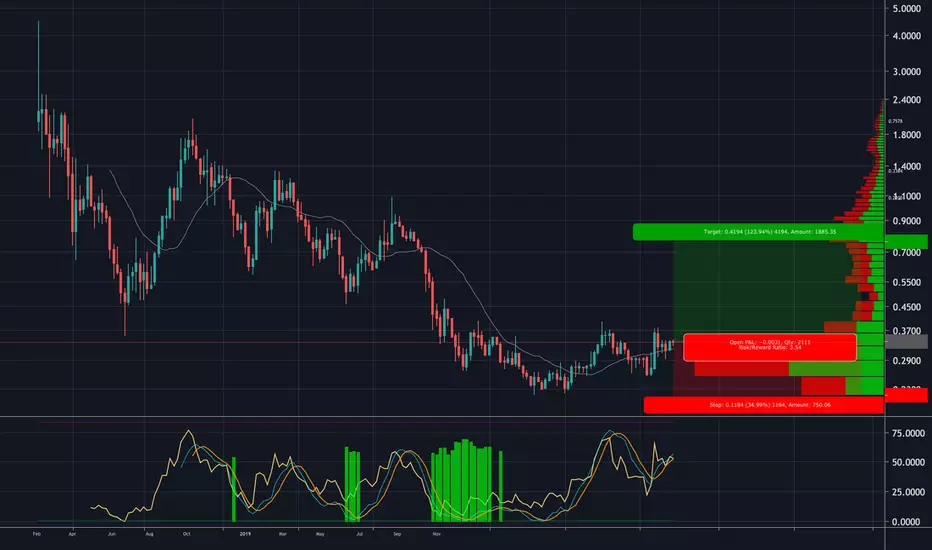
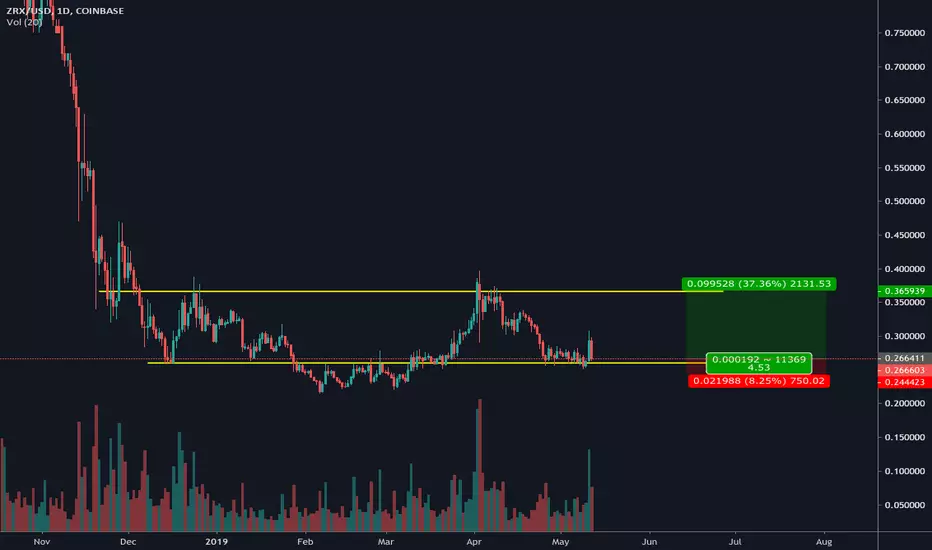
ZRX ready to rocketI have been monitoring ZRX for long time and covered some of the short-term trades before, but now I’m more interested in the long run as we might have a bullish reversal which could bring higher prices.
Looking at a chart from NOV 18 to MAR 19, you can see the price made lower lows while RSI made higher highs – I marked the pattern with arrow and blue vertical lines. Now, let me explain RSI indicator first, before going into details.
RSI is an extremely popular indicator that has been featured in a number of articles, interviews and books over the years. It is a momentum oscillator that measures the speed and change of price movements. I use it often to identify divergences.
Divergences signal a potential reversal point because directional momentum does not confirm price. A bullish divergence occurs when the underlying security makes a lower low and RSI forms a higher low. RSI does not confirm the lower low and this shows strengthening momentum. The opposite of that would show bearish divergence.
ZRXUSD made bottom twice and from there made higher highs all the way to the corner of descending triangle. The gap from the triangle could be very powerful, given the fact we have vitnesed long bearish trend. I’m long on the trade and looking at $0.5 as my first target. I will cover the trade when we get the momentum going – first we need to see a clear break from $0.4 region.
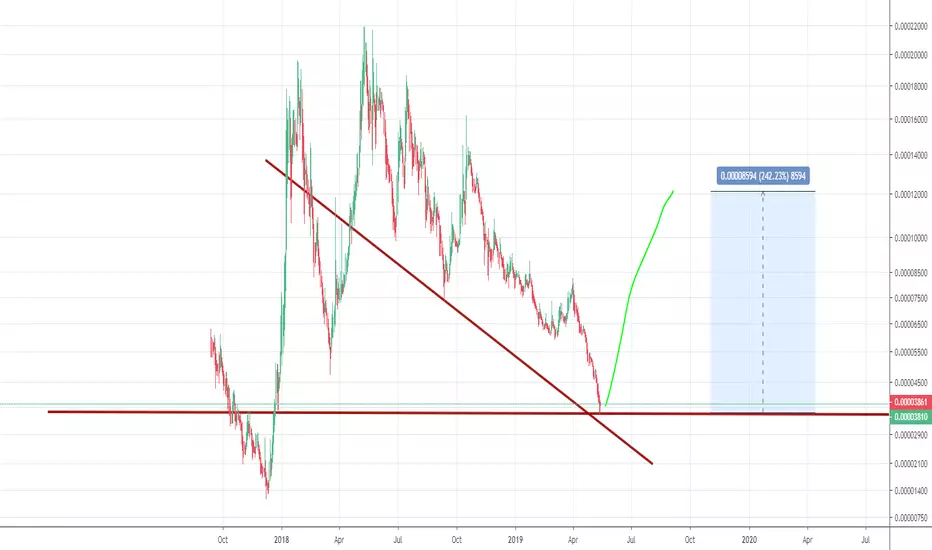
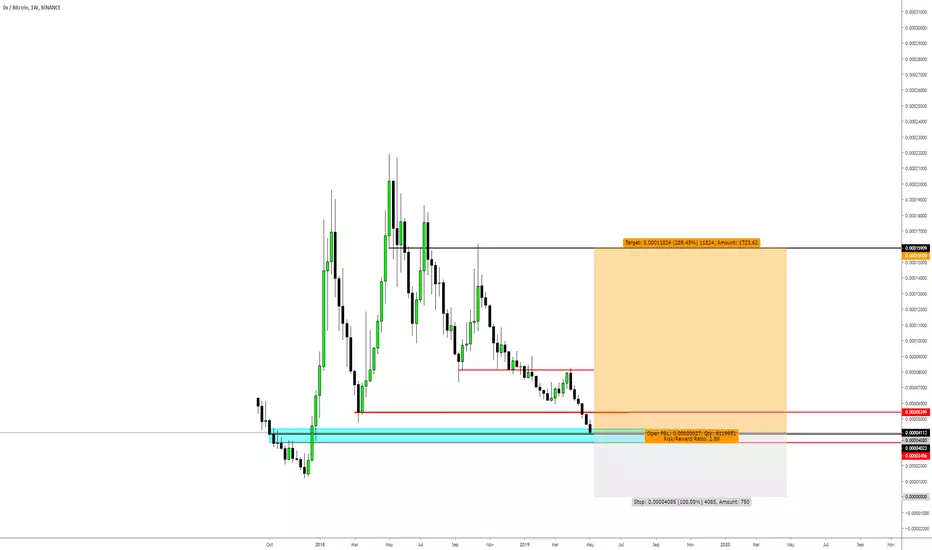
0x - how does a 40x sound to you?Sounds pretty good to me. Near perfect ABC correction completed...so what happens after wave 2? Explosion in 1 to 6 months.

ZRXUSD is ready to moveZRXUSD has formed a bullish inverted head and shoulders for the last several months and it's ready to rear it's horns in this hot crypto market
If you know anything about ZRX then you'd know it's a darling protocol token with rock hard fundamentals
To be fair, my targets are conservative but if you know the BTC pairing then you know that this was a 10x last season.
Go out and make some money my peeps.


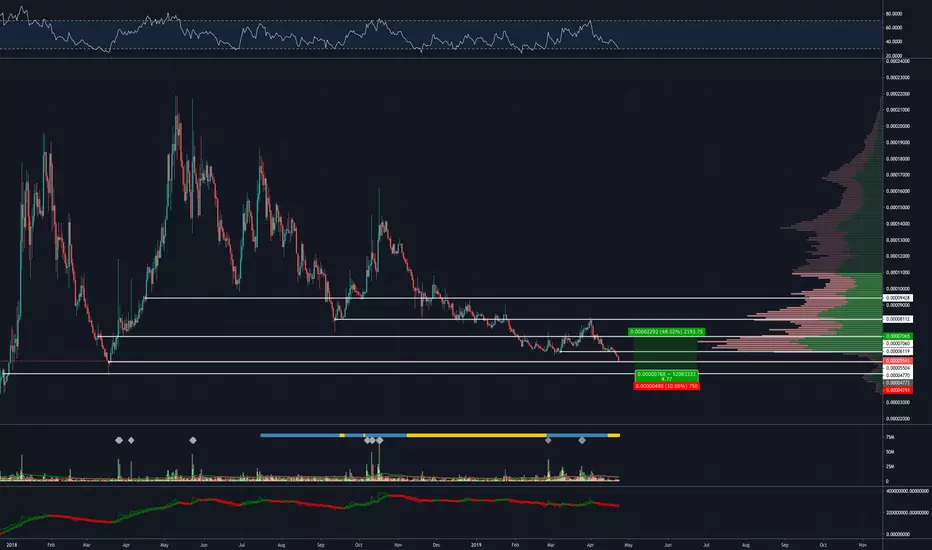
ZRX has >100% upside & great R/Rbuilt a huge point of control at the base and will launch upward from there as volume nodes above are much smaller
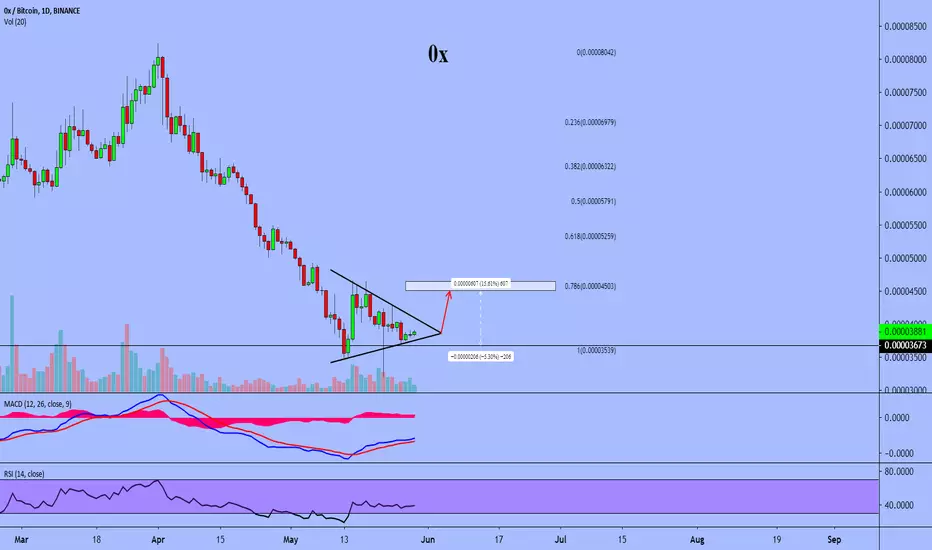
0x (ZRX/BTC) Looks almost ready for takeoff here.Looking at ZRX on Binance 3 Day. I could see thing taking off very soon, or we trail further down the wedge before a breakout.

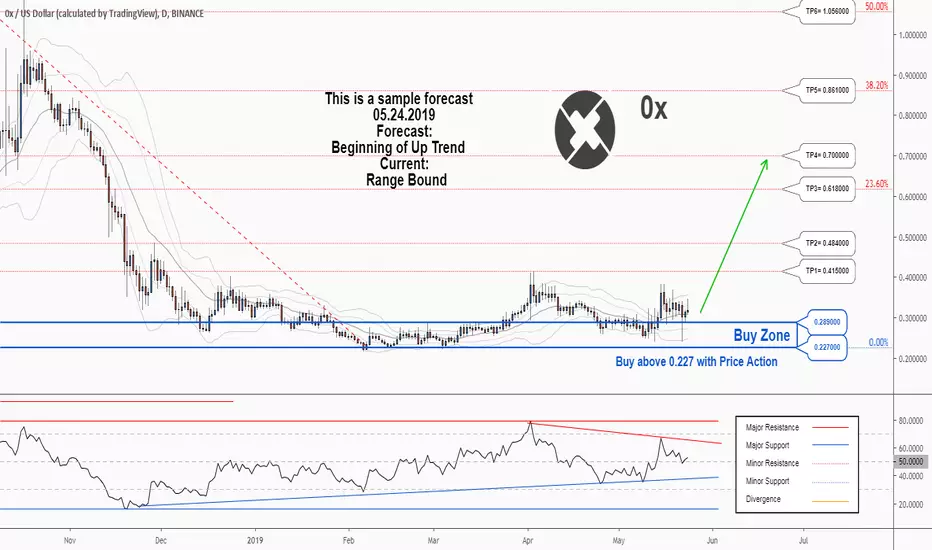
There is a possibility for the beginning of an uptrend in ZRXUSDTechnical analysis:
. 0x/Dollar is in a range bound and the beginning of uptrend is expected.
. The price is above the 21-Day WEMA which acts as a dynamic support.
. The RSI is at 52.
Trading suggestion:
. There is a possibility of temporary retracement to suggested support zone (0.289000 to 0.227000). if so, traders can set orders based on Price Action and expect to reach short-term targets.
Beginning of entry zone (0.289000)
Ending of entry zone (0.227000)
Entry signal:
Signal to enter the market occurs when the price comes to " Buy zone " then forms one of the reversal patterns, whether " Bullish Engulfing ", " Hammer " or " Valley " in other words,
NO entry signal when the price comes to the zone BUT after any of the reversal patterns is formed in the zone.
To learn more about " Entry signal " and the special version of our " Price Action " strategy FOLLOW our lessons:
Take Profits:
TP1= @ 0.415000
TP2= @ 0.484000
TP3= @ 0.618000
TP4= @ 0.700000
TP5= @ 0.861000
TP6= @ 1.056000
TP7= @ 1.253000
TP8= Free
ZRX Medium Term Analysis0x looks good after retesting the $.26 accumulation zone once again. Currently coiling before the next leg to the upside possibly. I recommend waiting for a daily closure above the on $.38 zone for confirmation of the upside push. But as you can see there isnt much resistance above there.
* This is NOT Financial Advice*

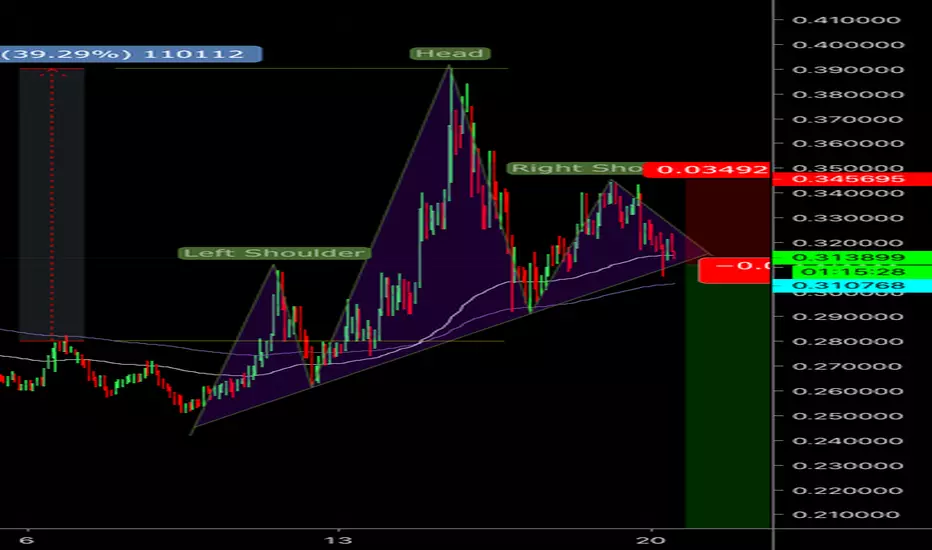
ZRX - head and shoulders?Take a look at the potential head and shoulders formation on COINBASE:ZRXUSD . If this plays out, I’ll be looking to enter a short position soon. Target and stop posted. Wait for it.
Inverse H&S ZRX is ready to moon !Hi guys,
as you can see we have a Inverse head & shoulders on zrx daily & weekly. with a fib extension to 0.483.
Zrx is gonna moon soon !

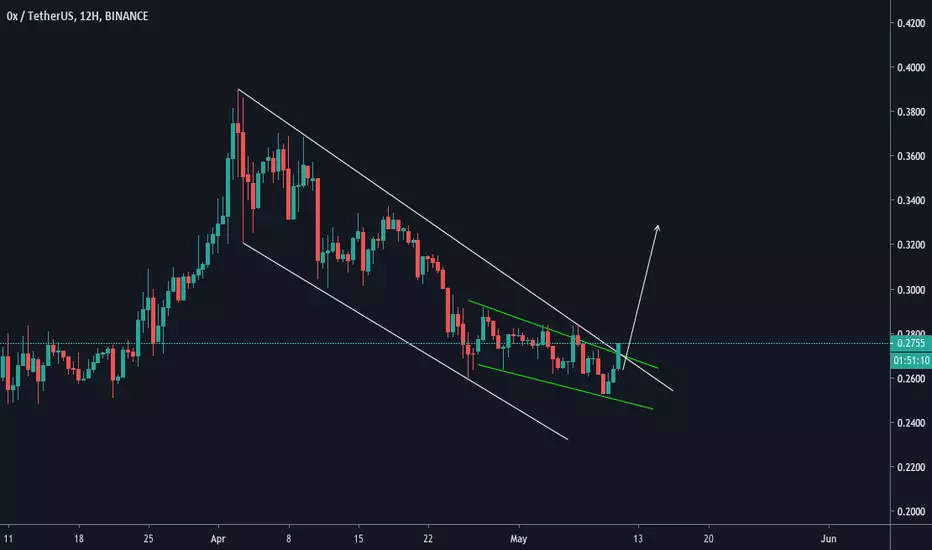
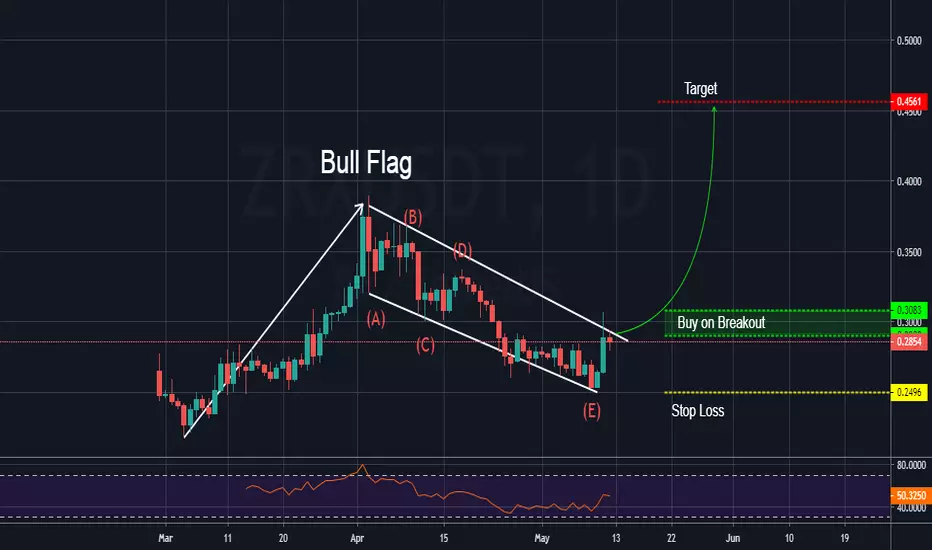
ZRX/USDT "Bull Flag" Hello Friends,
ZRX is looking like it is ready to move up.
Details on the Chart.
This is my viewpoint and my opinion. I am not giving advice but only sharing what I see. Do not enter a trade on my TA but do your own homework.
Cryptocurrency is volatile and very risky. Never invest what you can't afford to lose and always educate yourself and continue to do so when making any kind of investment.
If you find this information helpful, then please hit the like button. Your support is appreciated. Thank you!
CYA on the next one...until then, the trend is your friend. Buying on the dip and selling on the hype.
Cheers!
ZRXZRX could be heading to the lower support level with BTC pushing higher day-after-day
RSI looks like it might break below the range and this could happen on a final BTC spike up to 5800-600
There could be nasty wicks on alts pairs so be carefull with entries and SLs
Thanks guys!