There is a possibility for the beginning of an uptrend in ZRXUSDTechnical analysis:
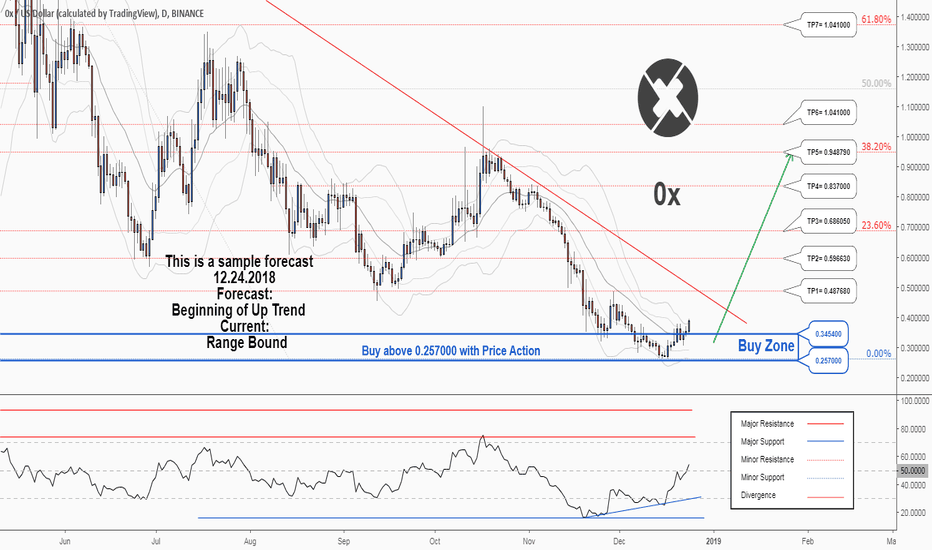
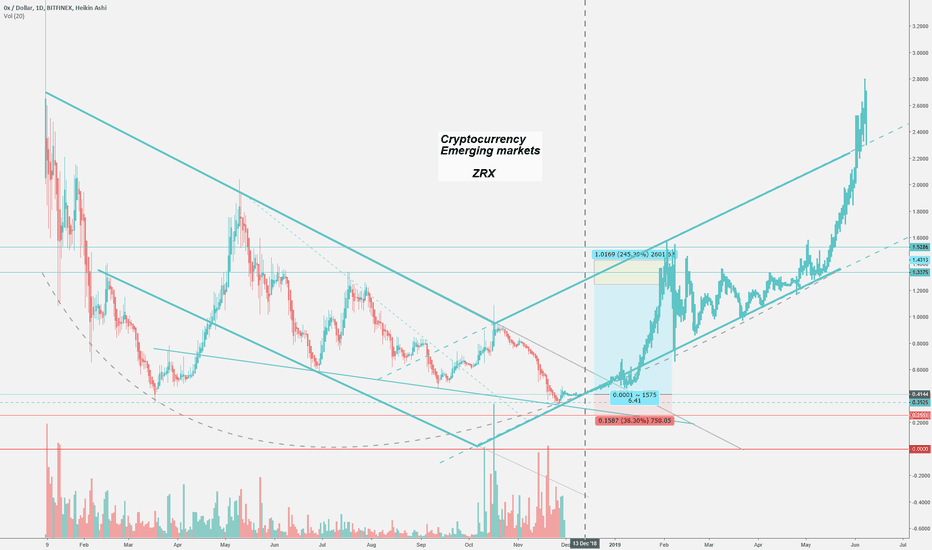
. 0X/DOLLAR is in a range bound and the beginning of uptrend is expected.
. The price is above the 21-Day WEMA which acts as a dynamic support.
. The RSI is at 53.
. While the price downtrend in the daily chart is not broken, bearish wave in price would continue.
Trading suggestion:
. There is a possibility of temporary retracement to suggested support zone (0.345400 to 0.257000). if so, traders can set orders based on Price Action and expect to reach short-term targets.
Beginning of entry zone (0.345400)
Ending of entry zone (0.257000)
Entry signal:
Signal to enter the market occurs when the price comes to " Buy zone " then forms one of the reversal patterns, whether " Bullish Engulfing ", " Hammer " or " Valley " in other words,
NO entry signal when the price comes to the zone BUT after any of the reversal patterns is formed in the zone.
To learn more about " Entry signal " and the special version of our " Price Action " strategy FOLLOW our lessons:
Take Profits:
TP1= @ 0.487680
TP2= @ 0.596630
TP3= @ 0.686050
TP4= @ 0.837000
TP5= @ 0.948790
TP6= @ 1.041000
TP7= @ 1.041000
TP8= @ 2.058300
TP9= Free
Zrx
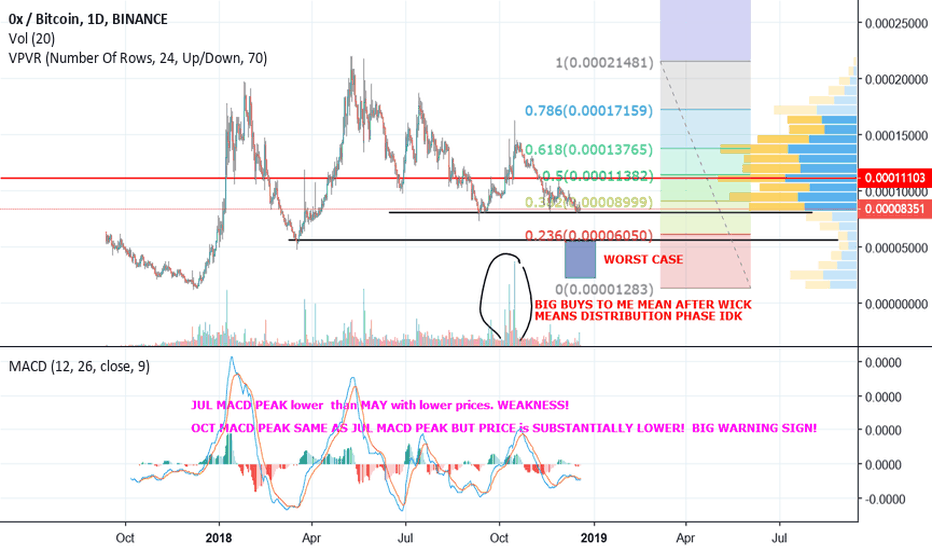
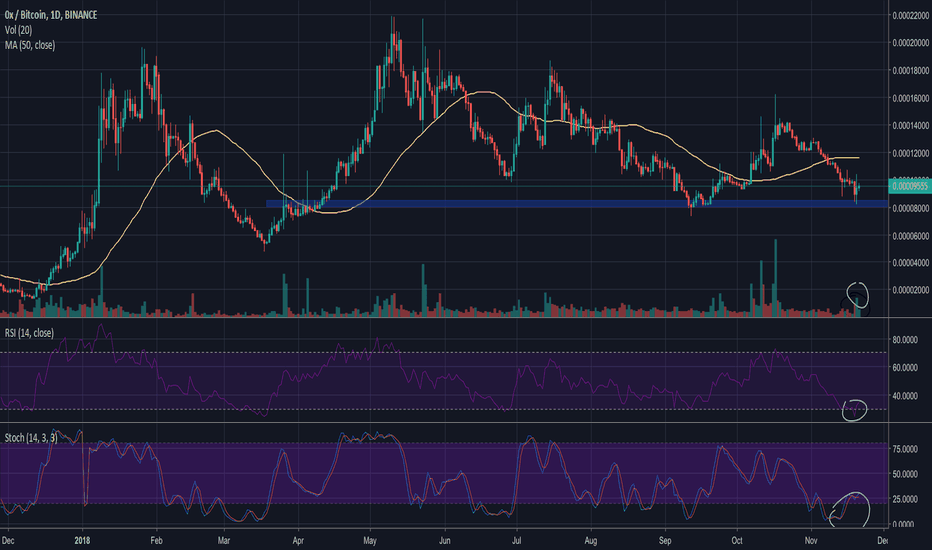
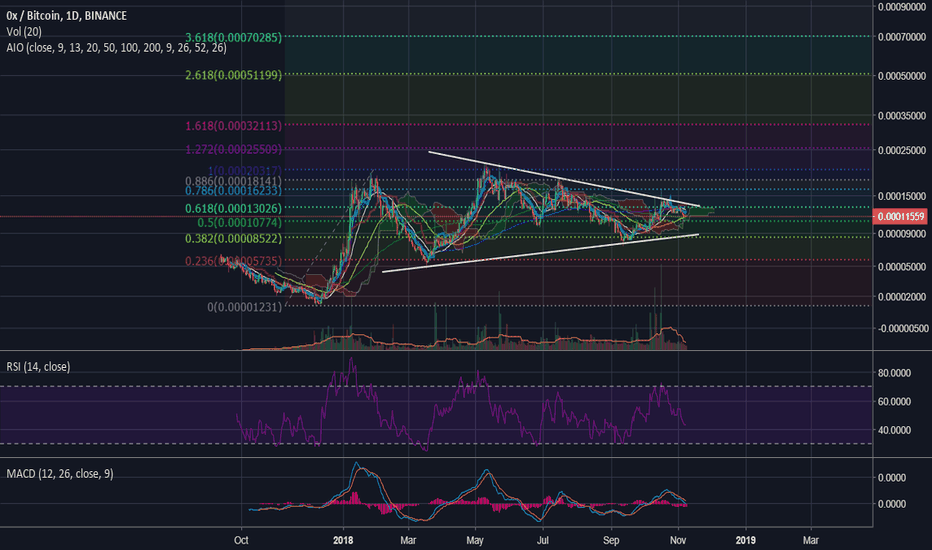
ZRX/BTC : DISTRIBUTION FROM COINBASE LISTINGTo me it looks like the entire 2018 year for zrx/btc was distribution for zrx.I dont think it will pamp high as imo it needs more time for acccumulation to occur. It all depends on what bitcoin does straight out the gate in 2019. It will pamp very hard at some point. Yep hedge funds buy zrx at 5 cents( whatever ico price is) and sell it at substantially higher prices to plebs like me lol. I remember buying the 2 dollar zrx because I was in it for the technology . In all honesty I thought it was gonna get to 5 dollars upon coinbase listing. The media kept on giving crypto plebs like me blue balls( we got a special announcement on cnbc regarding coinbase hahahaahah). If btc breaks the recent lows zrx will 100 percent get back to Nov/Dec 2017 lows vs btc. These coins are your mistress they aint yo wife
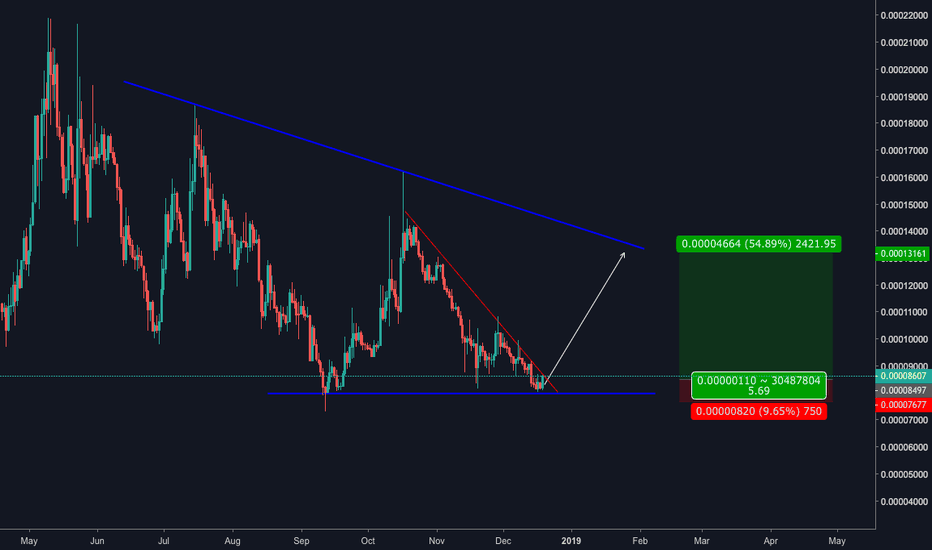
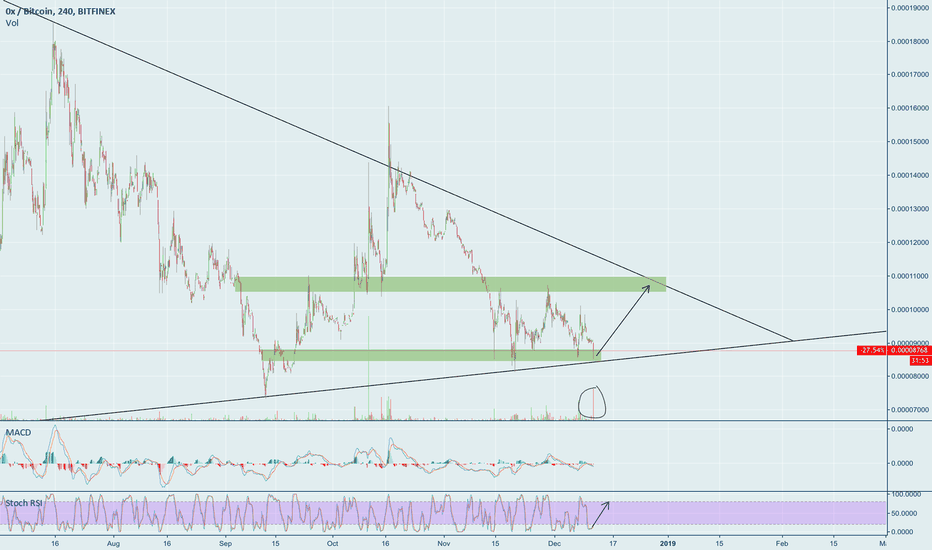
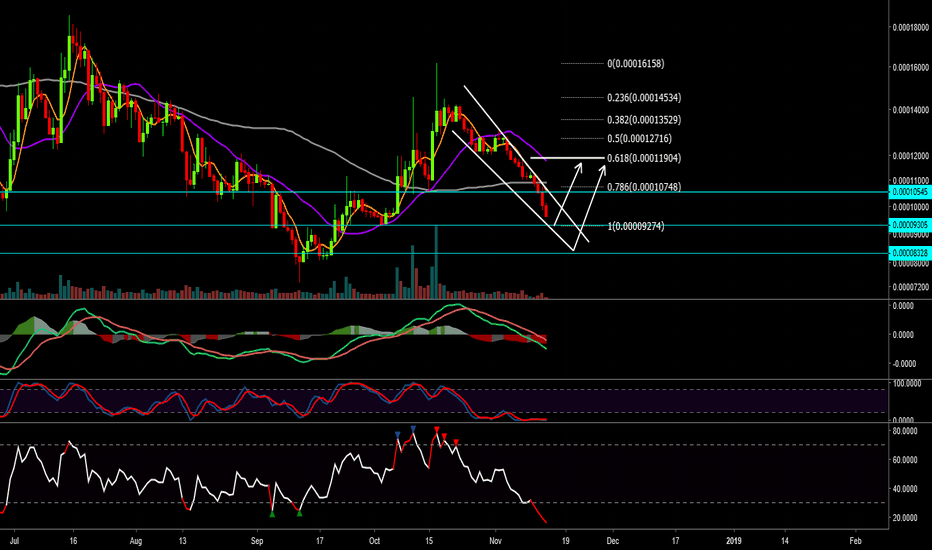
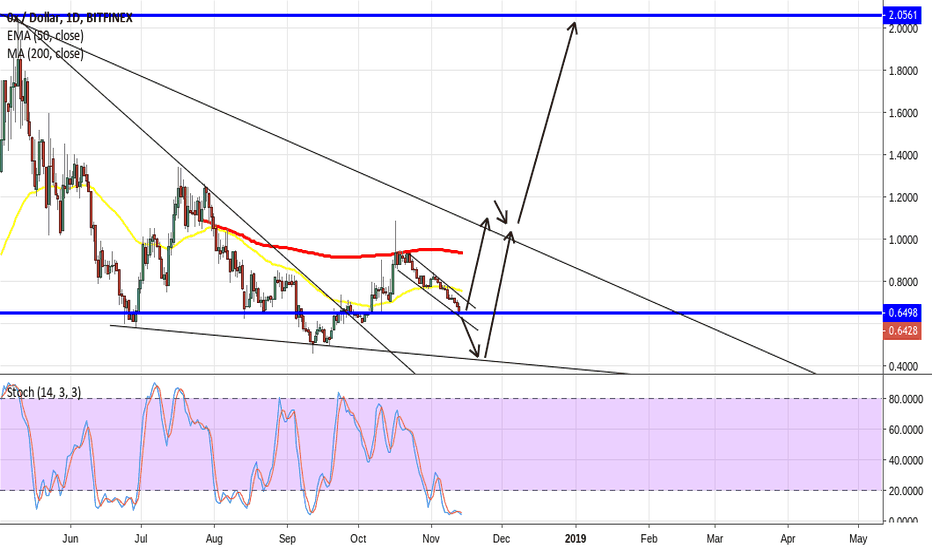
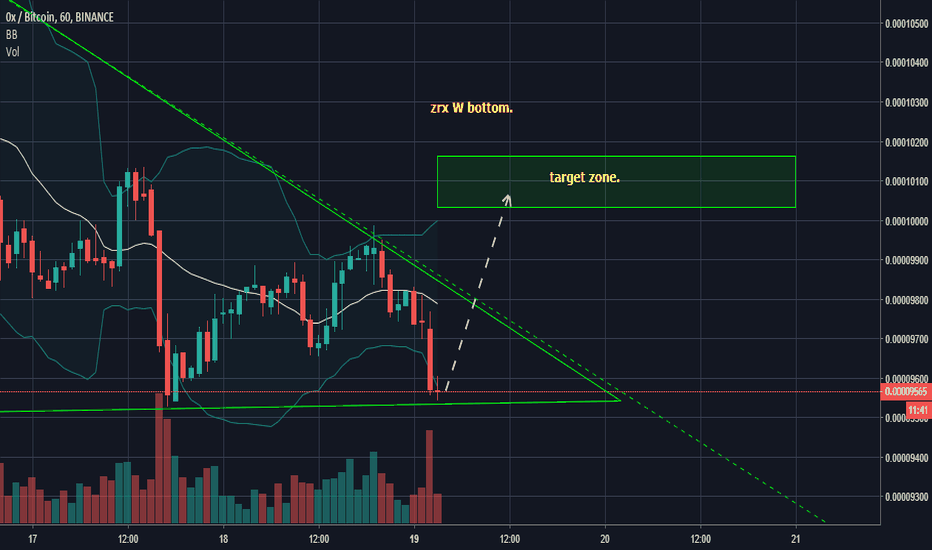
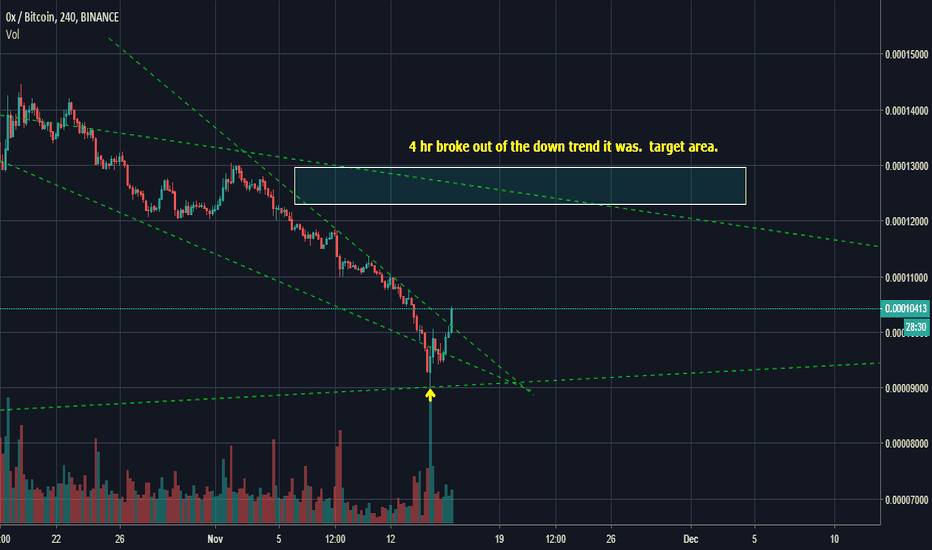
ZRX Falling WedgeKeeping a close eye on ZRX this week to see if it can break out of this falling wedge.
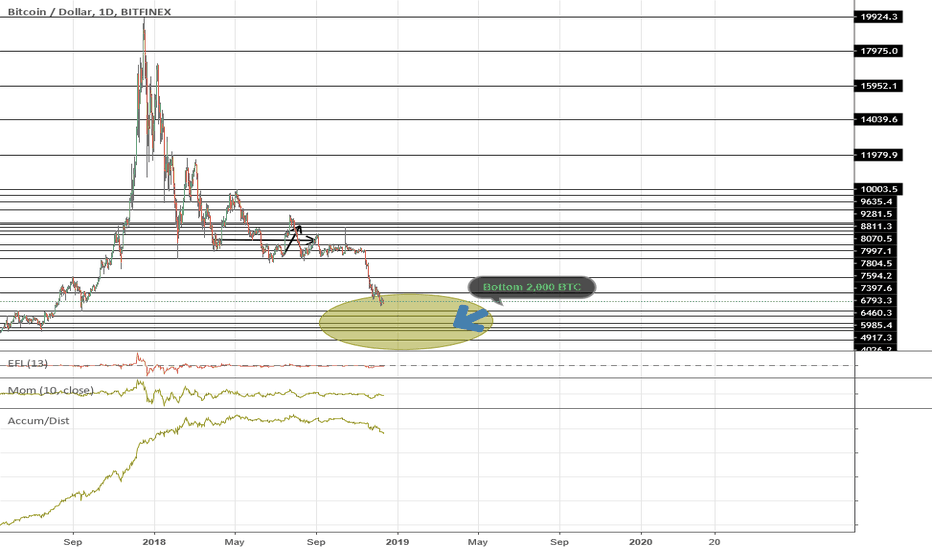
Time to set the record straight on $BTC #BitcoinPeople been calling the bottom on BTC for almost a Year now. I'm here to set the record straight. After analyzing several charts of the past surges and consolidation periods and the time lengths in between it seems they correlate with halving periods, the next of which will occur on May 26th 2020. The last halving occurred on July 9th 2016. Crypto began rising steadily afterwards as the supply of bitcoin rewards were reduced by half and the difficulty rose. By Jan 2017 Crypto began and almost steady rise into July-Dec of 2017.
Now with the upcoming it may be different this time as the rise of bitcoin should predate this one by almost a year, so it is safe to assume bitcoin should start rising steadily around the May date of next year. What will BTC be by then? Safest estimate would be around $1,500 a good area to begin accumulating would be $2,000.
However as I usually much prefer a much faster and higher ROI on my investment I will be looking to jump straight to Alt coins this time. Namely the more dominate well established ones that have already maxed their supply or about to max it and do not have an unlimited supply.
A mistake I made last year was also investing in cloud mining, which was the biggest waste of money and ultimately the biggest write-off I will have on my taxes this year. I do not recommend cloud mining especially with the unpredictability of Bitcoin and until the difficulty drops wayyy lower than it is now (Which probably won't ever happen again.)
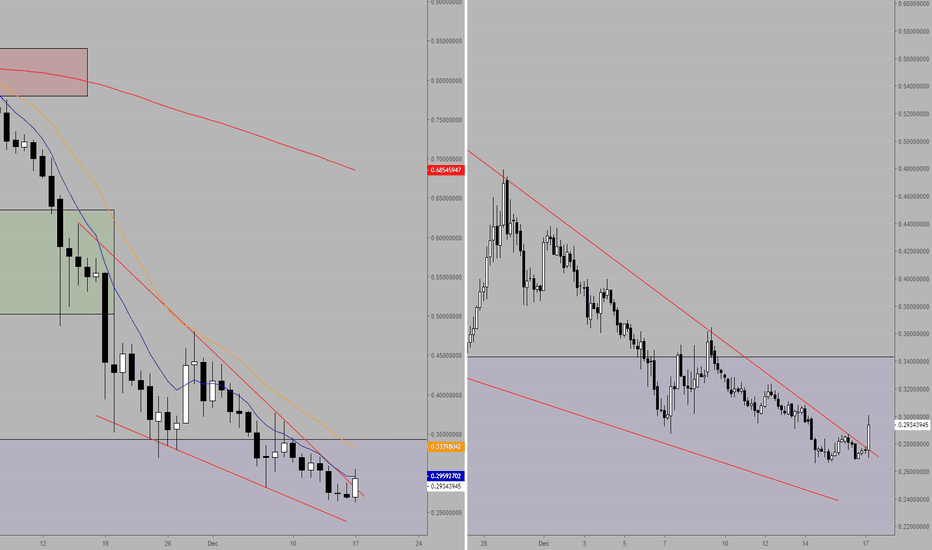
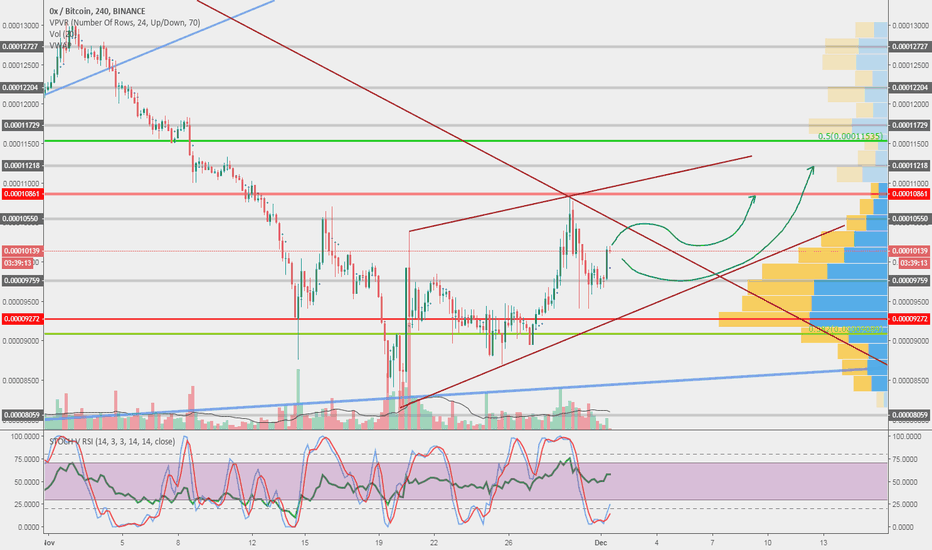
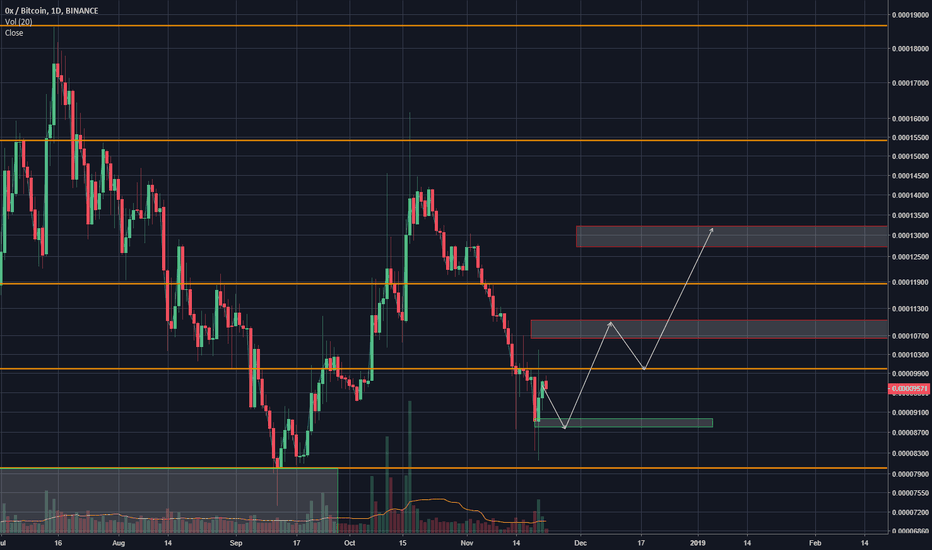
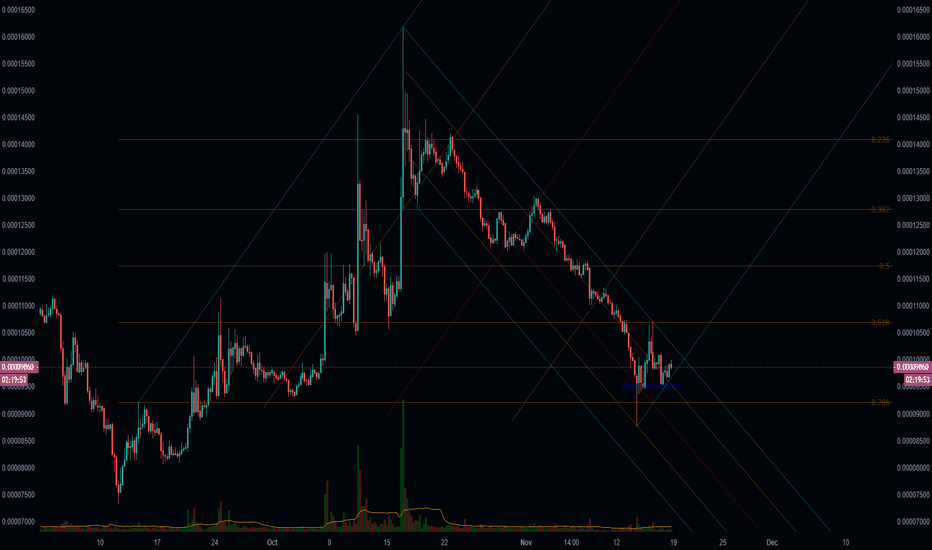
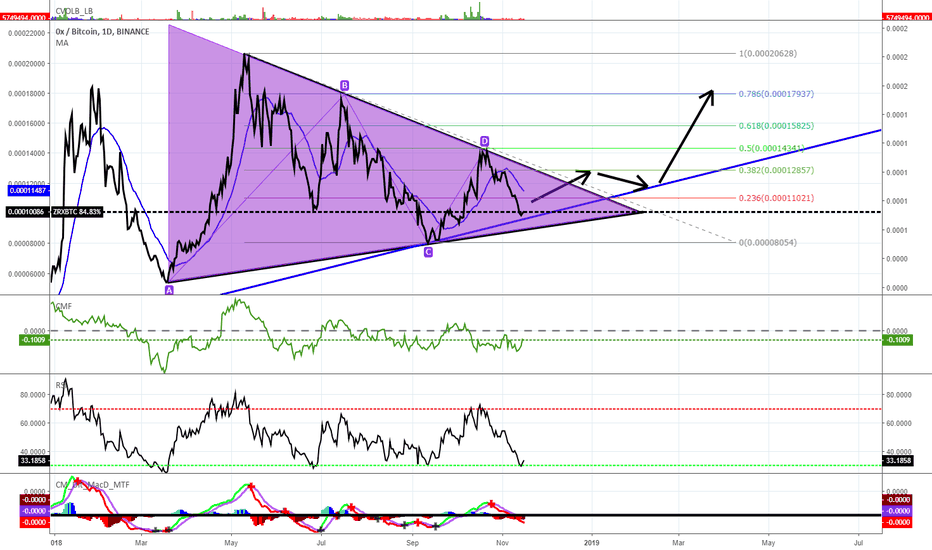
ZRX grow mapZRX shows some bullish movement. Not sure where to pick it up, but it will definetely grow (if bitcoin will). Nearest targets and resistance zones are marked on the chart. They will workout for sure.
10550 seems to be the main resistance. This resistance zone may work up to 10850. Plus trendlines. Each line breakout will cause big price action. Nearest target is 11700.
Check out day chart to see where the trendlines come from.
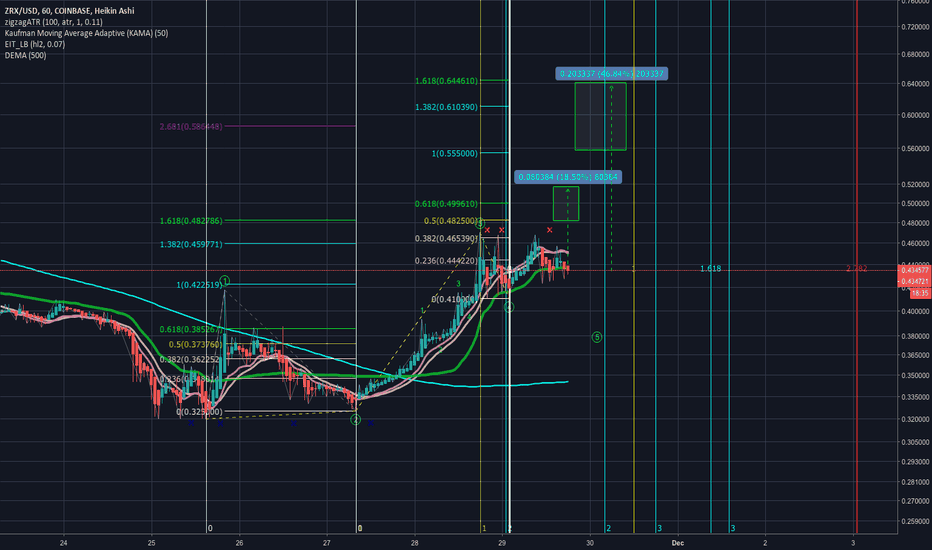
ZRXUSD-Initiate STRONG BUY-Primary Wave Extending (Coinbase)COINBASE:ZRXUSD is the best performing alternative coin on coinbase.
I would trade your 'BCH Coinbase' for ZRXUSD before BCHABC collapses....
Primary Wave is developing and extending...
Coins Performance on Coinbase.
Count:
Fib Extensions
Fib Time:
Targets:
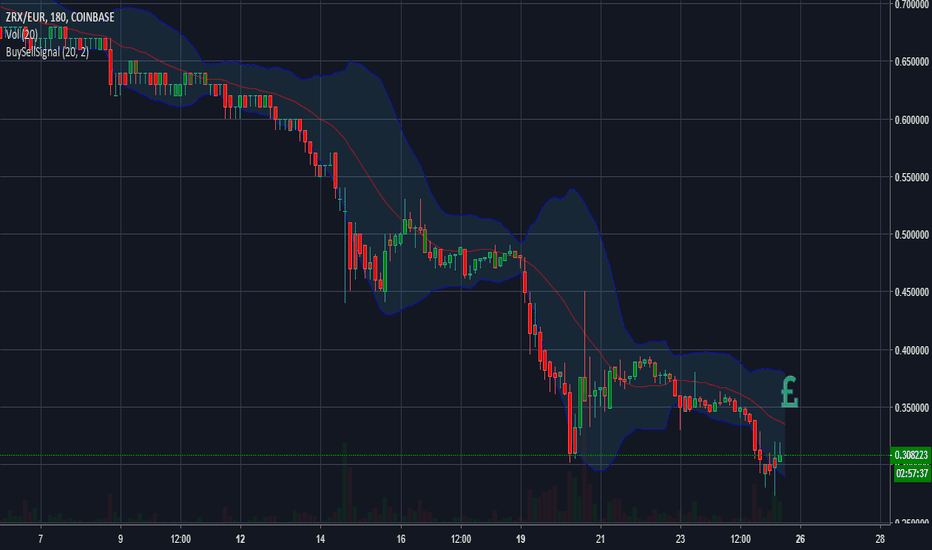
dollar cost average into ZRX/EURfor me this is the best time to buy in i have doubled my cash input from $100 to $200 a week into zrx i think the market will make recover withing in months an hit new highs lets wait out the panic sells :) also please dont listen to the fake news bitcoin dead crypto dead etc ITS A WORLDWIDE MARKET CRASH CORRECTION 1-5-10-20-30-years trading will still be here THEY WISH CRYPTO WAS DEAD :D
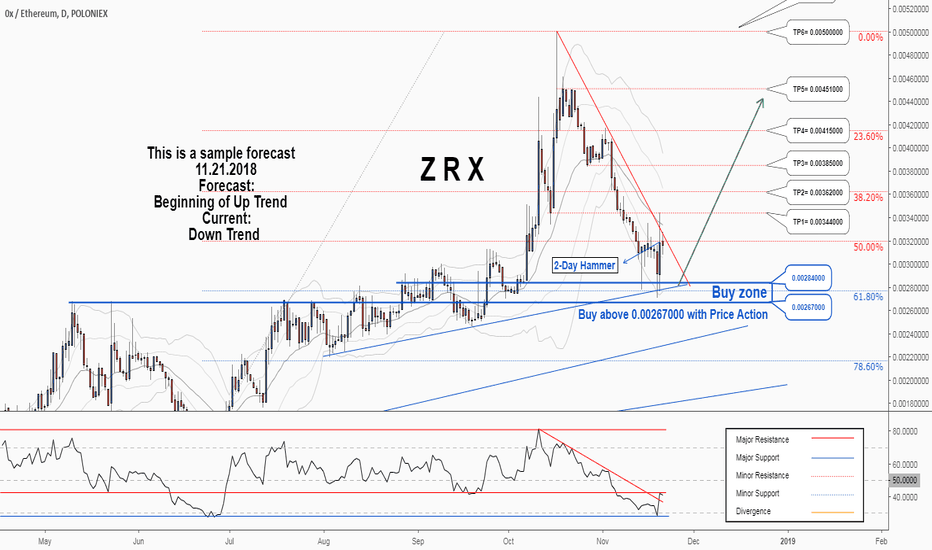
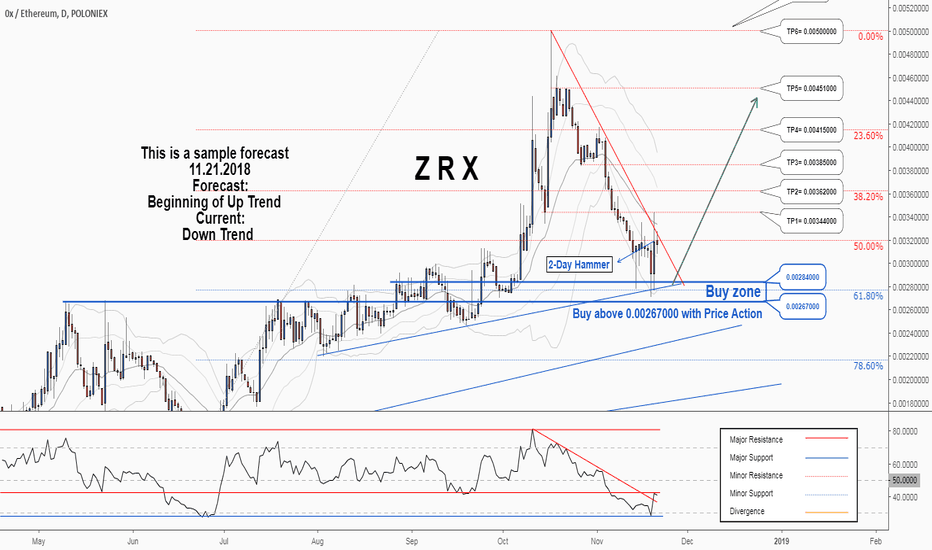
There is a possibility for the beginning of an uptrend in ZRXETHTechnical analysis:
. 0X/ETHEREUM is in a down trend and the beginning of uptrend is expected.
. The price is below the 21-Day WEMA which acts as a dynamic resistance.
. The RSI is at 40.
. While the price downtrend in the daily chart is not broken, bearish wave in price would continue.
. The RSI downtrend is broken, so the probability of the resumption of an uptrend is increased.
Trading suggestion:
. There is a possibility of temporary retracement to suggested support zone (0.00284000 to 0.00267000). if so, traders can set orders based on Price Action and expect to reach short-term targets.
Beginning of entry zone (0.00284000)
Ending of entry zone (0.00267000)
Entry signal:
Signal to enter the market occurs when the price comes to " Buy zone " then forms one of the reversal patterns, whether " Bullish Engulfing ", " Hammer " or " Valley " in other words,
NO entry signal when the price comes to the zone BUT after any of the reversal patterns is formed in the zone.
To learn more about " Entry signal " and the special version of our " Price Action " strategy FOLLOW our lessons:
Take Profits:
TP1= @ 0.00344000
TP2= @ 0.00362000
TP3= @ 0.00385000
TP4= @ 0.00415000
TP5= @ 0.00451000
TP6= @ 0.00500000
TP7= Free
