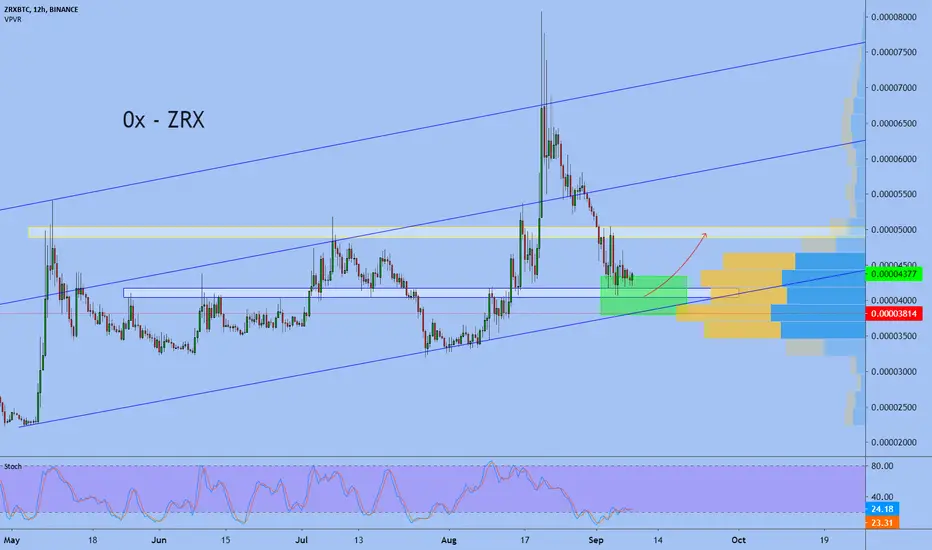
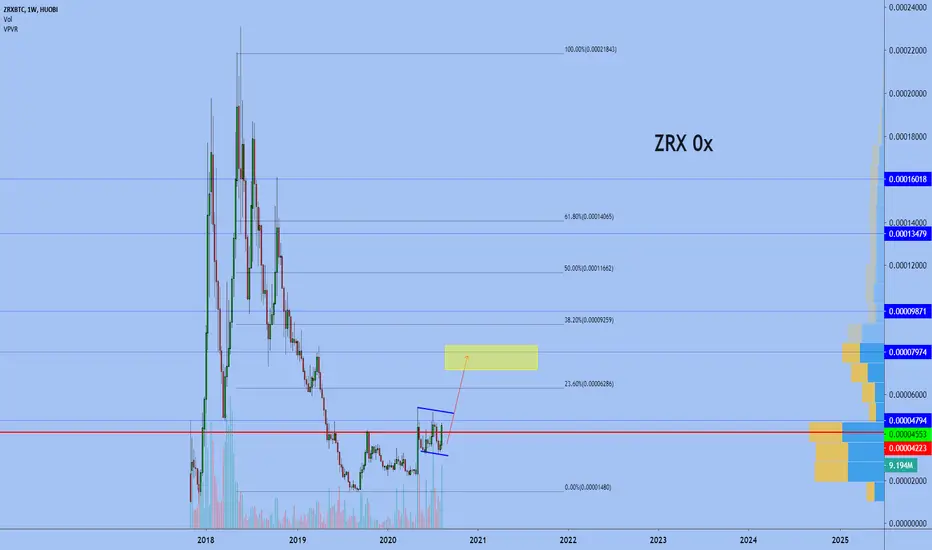
ZRX/BTCZRX/ BTC near support line of uptrend channel also we can see a horizontal support zone
0x (ZRX) is an open-source protocol that provides smart contract infrastructure and liquidity to enable the peer-to-peer exchange of tokens on the Ethereum blockchain. ZRX is the token that allows 0x users to vote on Improvement Proposals that evolve the system over time. ZRX token holders can also delegate ZRX to market maker staking pools to earn protocol liquidity rewards (in ETH).
ZRX : Token, Platform, Decentralized exchange, DeFi, Substrate, Polkadot
Best regards EXCAVO
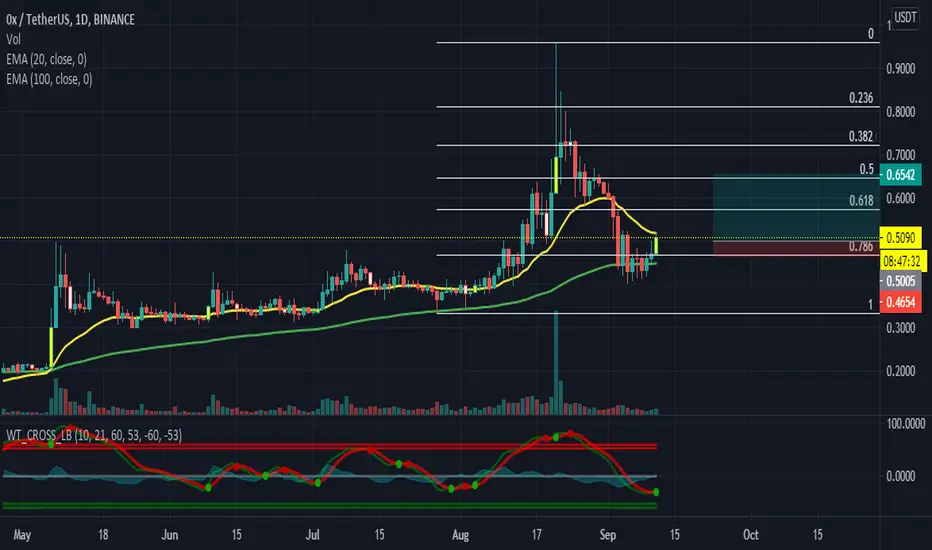
Zrxusdt
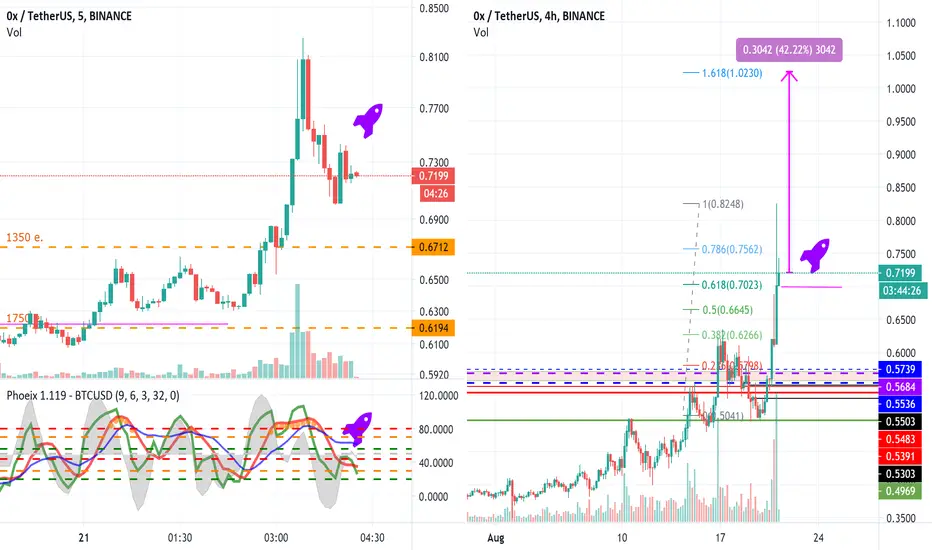
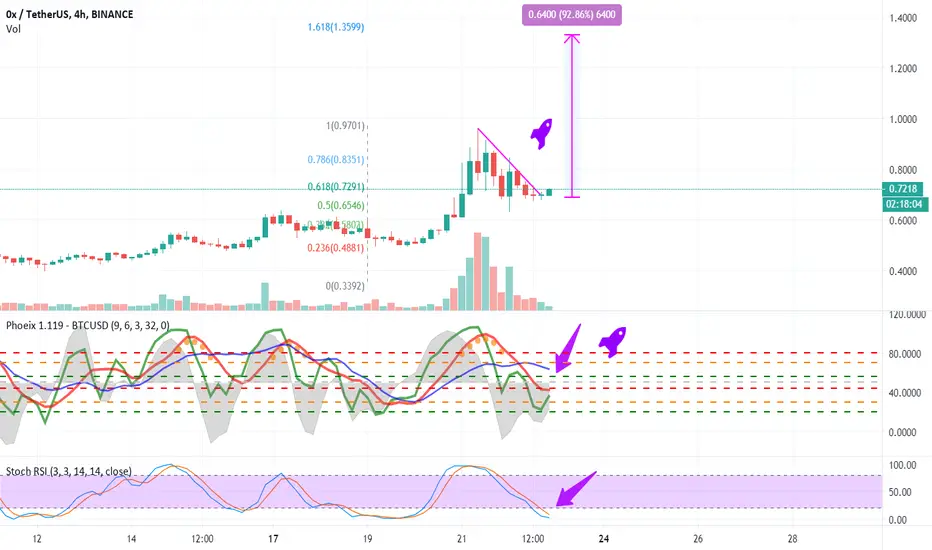
ZRX/USDTZRX/USDT performed a price reversal exactly at point 0.78 of the Fibonacci retracement.
RSI, SMIIG, WT CROSS are possible in the daily period. Now, the price coming back above the EMA 20 while maintaining support for the EMA 100 will indicate an excellent profit possibility.
This is just my idea, always do your own research.
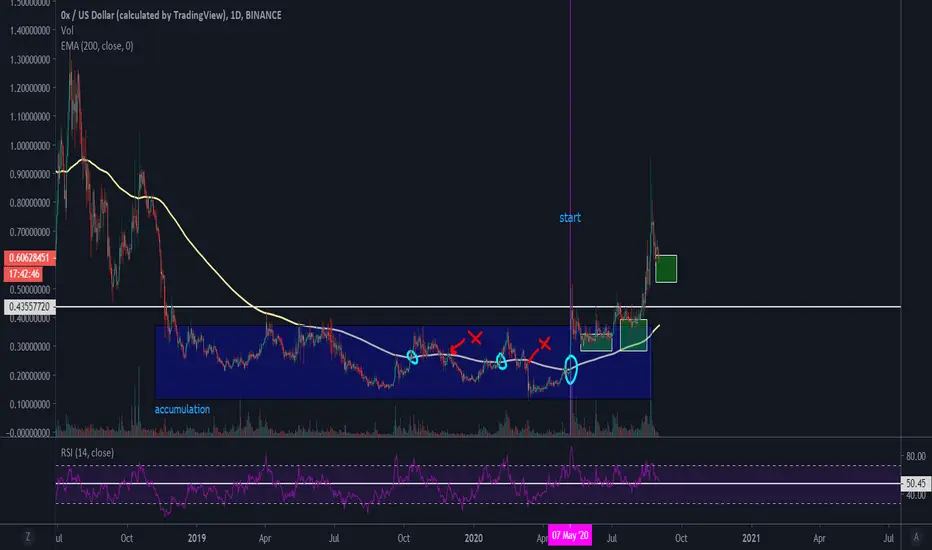
ZRXUSD RSI/EMA buy oppsThis is simple buy startegy for bullmarket (1D,USD chart).
Buy opportunities are based off RSI and EMA200 close only.
1. When a shitcoin crosses over EMA200 properly (with good volume etc.), this is the time you start using this strategy!
2. This asset now needs to stay above EMA200.
3. Put a horizontal line at 50 RSI, when RSI is around that level, u start u looking for buys. When RSI hits 50 or lower, its a good buy opp. Risky buy opps are around 60-51 RSI.
4. EMA200 hits are your other buy opp if the price drops back that far.
5. No sell targets.
Sometimes the price may dip below EMA for a few days, so do not panic if it does! U should start to worry only if the price is over than a week under this magic line, or the price tests it as resistance on a daily when under.
After the accumulation range is broken u usually don't get EMA touches anymore, but when u look at RSI u can still get a few good entries before moon and lambos.
buy boxes:
green: good buy (50 or lower RSI, maybe touching EMA)
yellow: risky buy (60 to 51 RSI, far from EMA)
blue box: accumulation
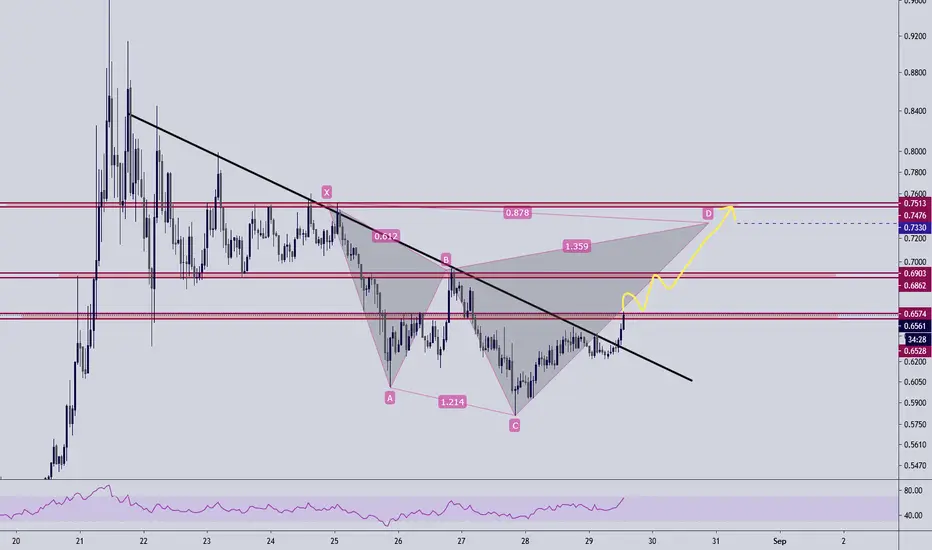
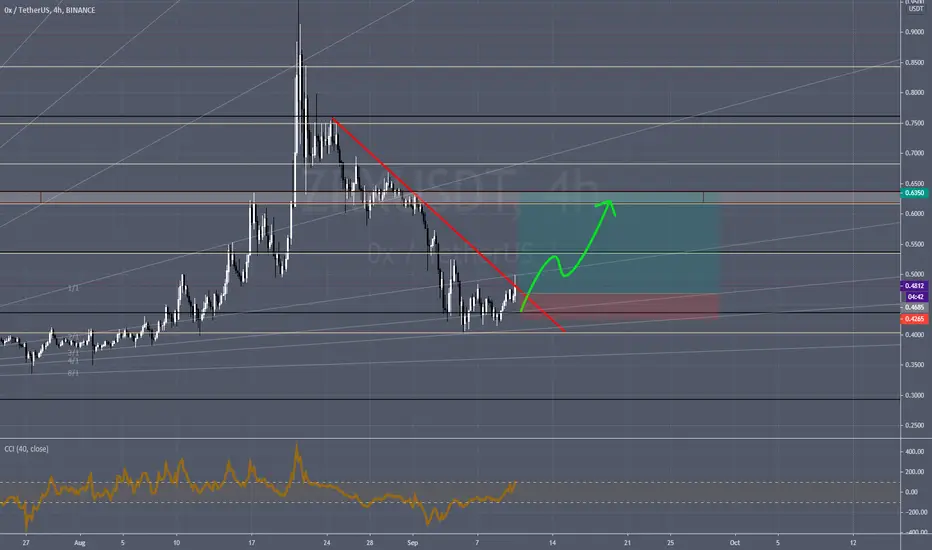
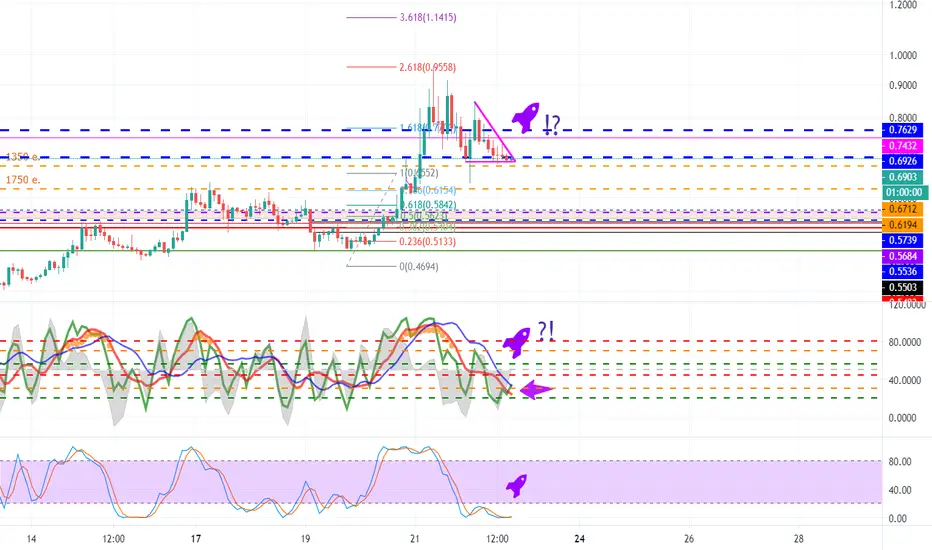
ZRXUSD: Long is possibleAt D1, the cloud is directing upward, indicating an uptrend.
And the price found support at the Fibonacci level of 61.8%-50%.
At H4, the cloud is directing downward, indicating a price correction at the D1 timeframe.
In addition, the RSI reached the oversold level, after which the price broke the local downtrend line of the falling wedge model.
We recommend buying ZRXUSD now with a stop loss at 0.58 and take the profit near the level of $1 - $1,1.


ZRX/BTC (Pullback to Previous Resistance?)ZRX/BTC
-The Bear flag has been confirmed after the break of local support at 6000 sat
-The potential downside target is somewhere around 5064-4696 sat range
-This is a good rebuy zone or potential strong support area
-It is a previous resistance region plus the 0.618 golden Fib
-Watch this level carefully for any Bullish rejections
-Look for any signs of reversals before entering a Buy position

Bullish pennant breakout on ZRX happening right now. With ZRX having formed a bullish pennant on both ZRXUSDT and ZRXBTC a breakout is now imminent.
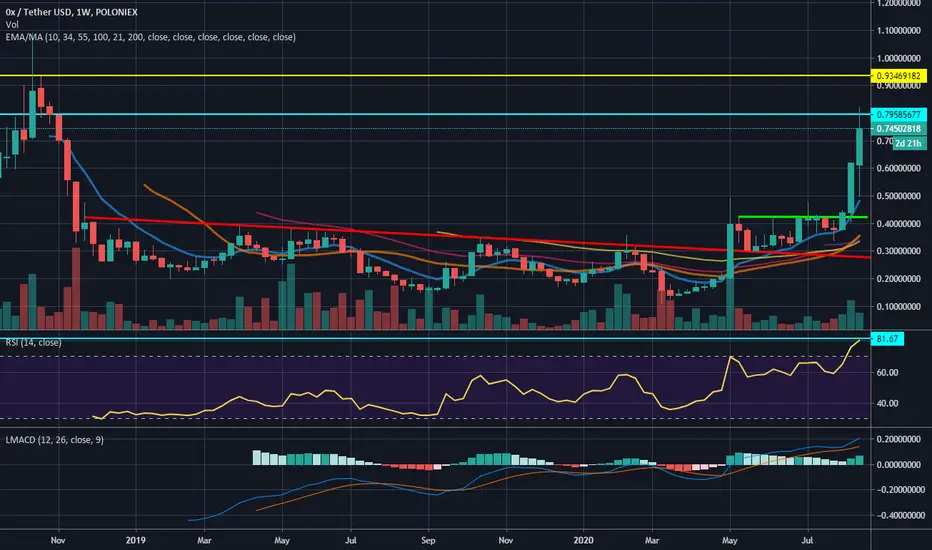
ZRX - Can it break 0.79c? RSI indicates the way forwardOn this weekly chart of ZRX we can see ZRX has broken the major red resistance line. ZRX then went on to form an ascending triangle and broke through the lime green line.
The light blue resistance line at 0.79cents coincides with the RSI hitting it's own resistance level at 81.67 on the RSI.
If ZRX can break the light blue line the next target is the yellow resistance line is at 0.93cents where we expect some heavy resistance.
The RSI has hit 81.67 shown by a light blue resistance line.
On this daily chart below you can see the significance of the RSI blue line at 81.67
Is it a time to short when the RSI hits 81.67 or wait for the pullback and add to the long?
Happy trading legends!
HTBB
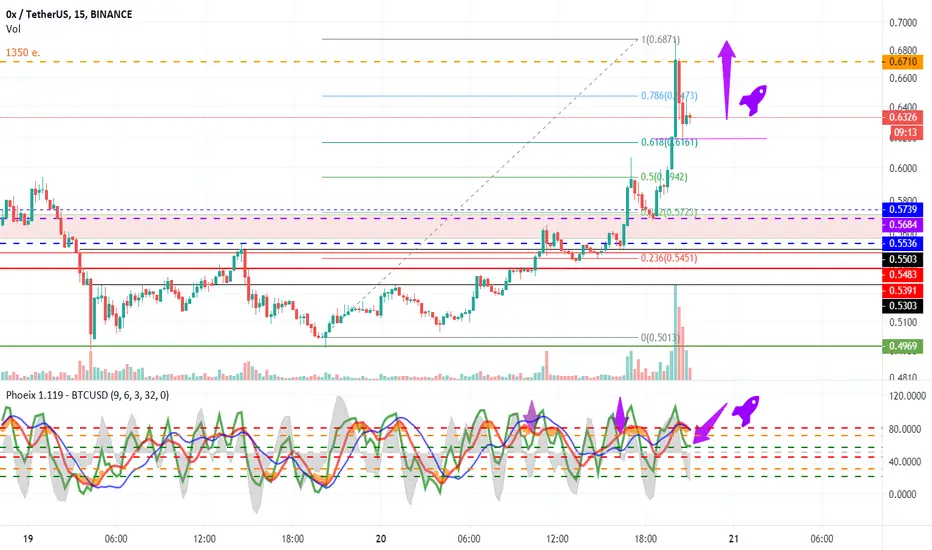
ZRX USDT Cup and Handle Possibility ?? Cup and Handle >> It is not an Investment Advice. It is for Tracking Purposes
Good Luck :))

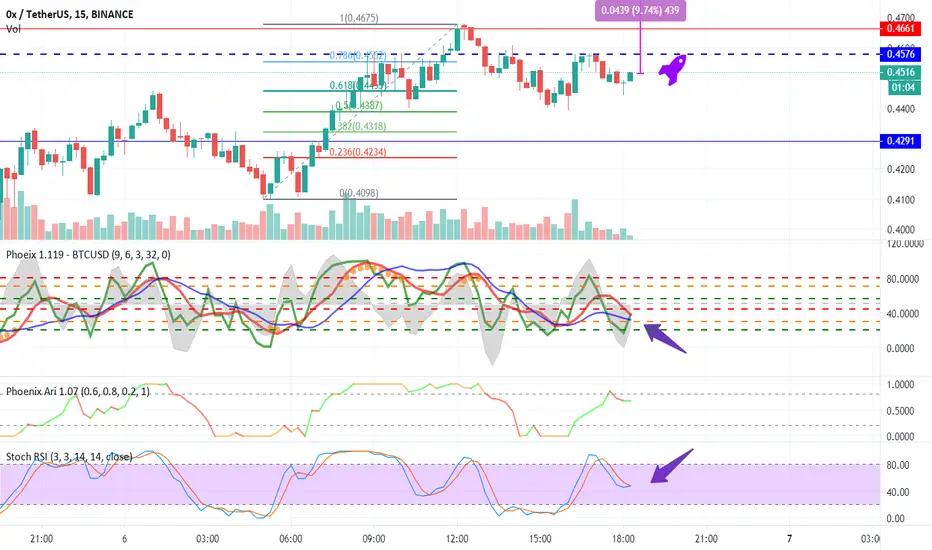
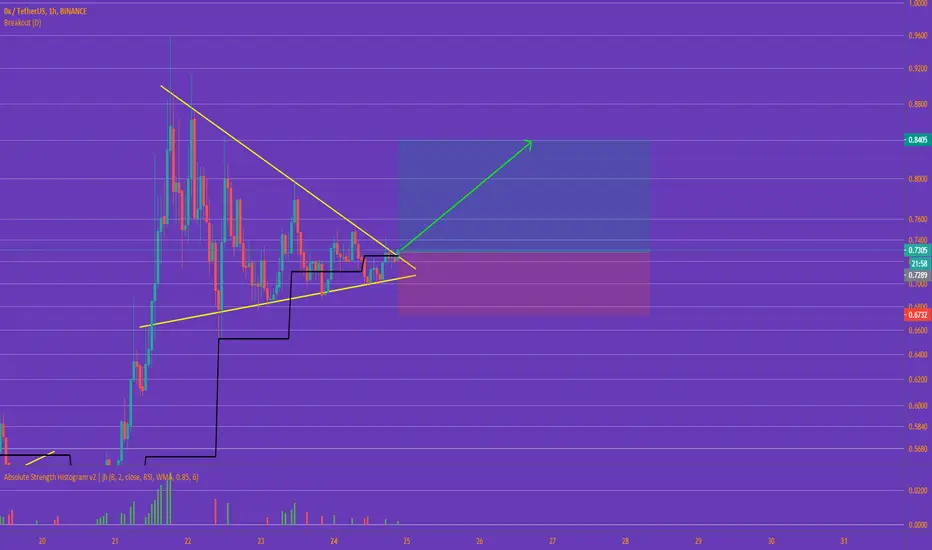
Here I go long on 0x and ZRX will go upHere I go long on 0x and 0x will go up The price is testing the major resistance, so now I go 5x long and the bullish breakout will start And 0x will go up. See you up there
ZRX/BTC (Testing Recent High)ZRX/BTC
-The key support area is set at 3300 sat
-The price is now testing the previous top
-If we can clear this area and acceptance above 4600 sat
-Chances of going up higher will increase
-Our upside target is up to 8000 sat

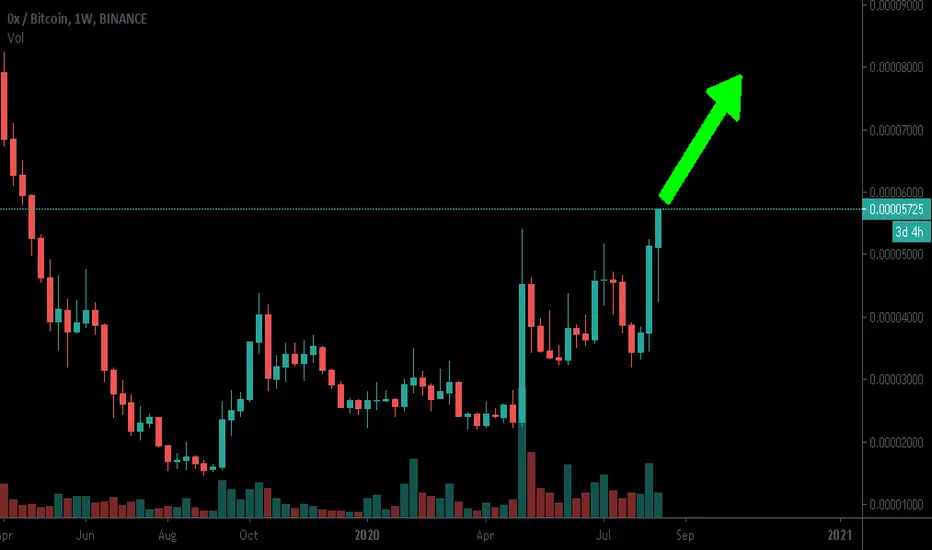
ZRX - 0xWe can see long term accumulation before the pump
I see a bull flag
Next few days we will see break out all resistance
Best regards EXCAVO
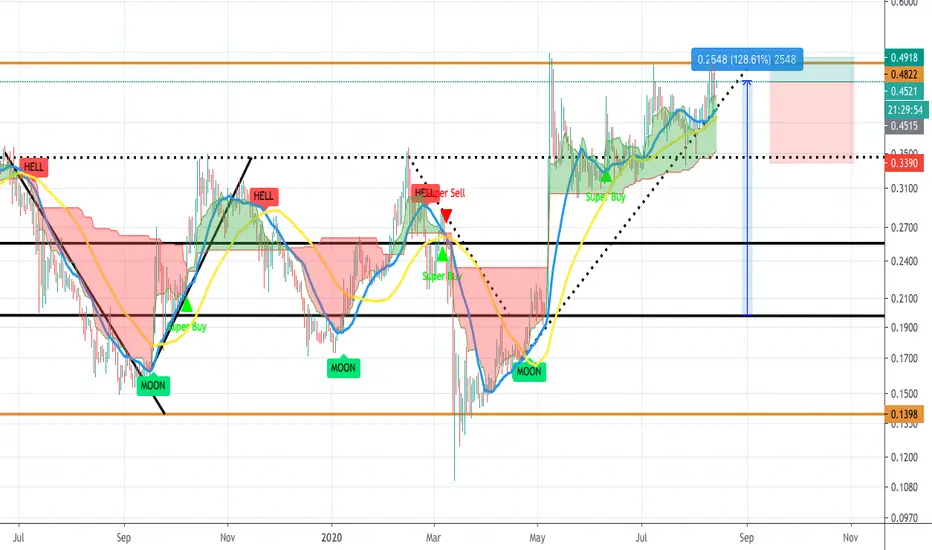
ZRXUSDT AnalysisPeople who bought ZRX on April from the MOON signal, enjoy your 128.61% PROFIT that you made in 4 months!
There are also MA20-MA50 cross strategy present with MOON signal & the cloud is green as a buy signal.
If you are holding ZRX, do not hurry to sell since there are no sell signals present. If you want, you can take profit at the resistance level (0.48) or you can sell when the candles open close below the support level (0.34).
Also, if you want to buy ZRX, do not hurry to buy since the risk & reward ratio is lower than 2. You can buy when the candle open close above the resistance level (0.48).
After you buy, watch out for EngineeringRobo's sell signals to not lose your money or your profit.
ZRXUSDT AnalysisI am mostly positive about ZRX. Engineering Robo is giving a Buy 2 signal. In addition, the MA 20 (blue line) is above the MA 50 (yellow line) indicating that it is time to buy it. If the candles continue to go up and pass the 0.4826 resistance level with an open-close candle, I can buy it. If, however, the candles move down, I can wait for a hell or sell signal to sell it.

ZRXUSDT analysisWe can buy at support 0.4480USDT. We can sell when we get either sell2, hell or red robo signal.

ZRX 0x upside potentialThe chart looks primed for a move up.
The volume is rising and the indicators show a strong buy recommendation.
Can make a 50% gain.
If you are interested to test some amazing buy and sell indicators, which give the signal at the beginning of the candle, not at the end of it, just leave me a message.
