Was this the best buying opportunity since 2011?Sure, here's a rewritten version of your text in an engaging tone:
"Have you ever heard of the Zweig Breadth Thrust? Well, let me tell you, it’s an incredible metric that can really shed some light on the current market situation!
So, what would it take for me to believe that this bounce isn't just another bear market rally? My first step would be to dive into the breadth indicators and look for signs of that elusive breadth thrust.
Think of a breadth thrust like a rocket taking off. You need a strong initial boost to break free of gravity's grip. If the thrust is weak, the rocket can’t escape, and the same applies to stock market reversals. When we see a robust breadth thrust, that's a signal that a significant reversal is underway. Without it, we could be facing another false bounce.
Now, let’s talk numbers! As of Friday, April 25th, the SPX has surged an impressive 14.2% from its recent lows, and while that’s quite a leap, it’s essential to keep it in perspective. Just think back—this index was down 21.35% from its all-time high earlier in February during the panic sell-off. Now, with the recent strength, it’s only 10.75% off its peak.
The Zweig Breadth Thrust is calculated based on the 10-day EMA of NYSE Advances divided by the sum of Advances and Declines. A bullish signal pops up when the ZBT shifts from below 0.40 to above 0.615 within just ten days or less. Keep an eye on that—it might just help us navigate these choppy waters!"
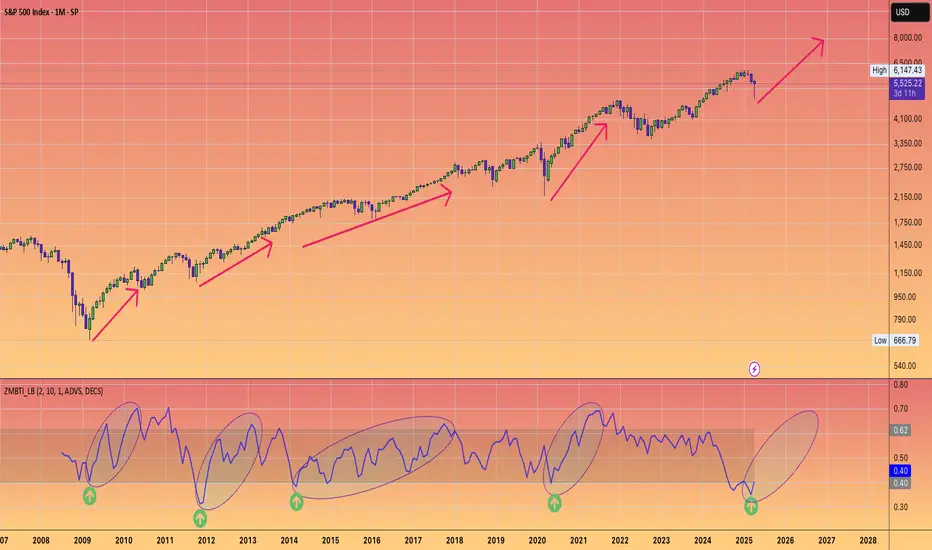
On the monthly chart, it’s clear that what we’ve been seeing in the broader economy (you know, Main Street) is actually showing us some bearish divergence—a concept I've mentioned in my previous ideas.
Since 2009, we've had four notable instances on the Monthly chart where the ZBT dipped below 0.40, only to bounce back up past the 0.6 mark. Remember back in November 2011? That was when we got a significant signal with a low reading of 0.31, which climbed back to 0.62 by February 2013. That surge sparked a bull run that peaked in February 2020!
So, the takeaway here is that this breadth thrust is generating the positive momentum we need to reach new stock market highs this year. Exciting times ahead!
Zweig
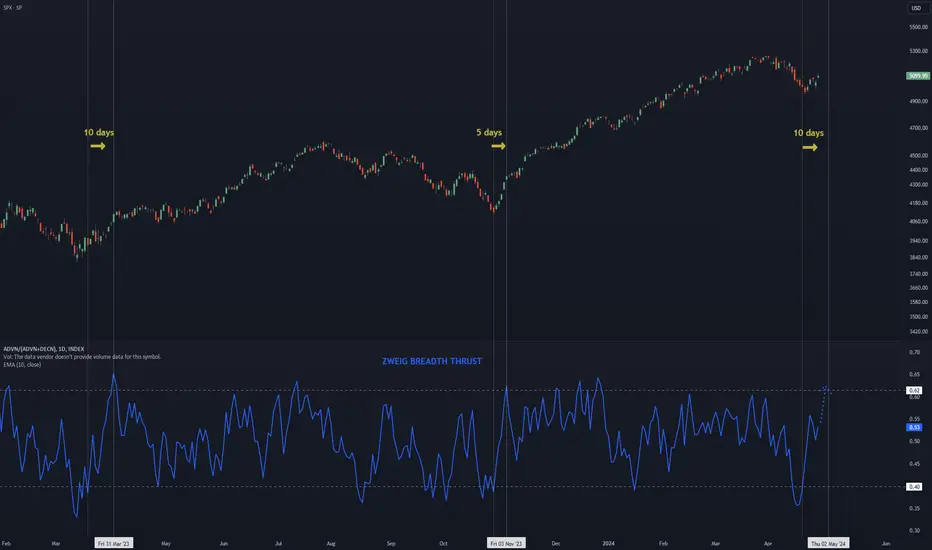
The Zweig Breadth Thrust above 0.615 in 4 days or else no rally!Precisely 6 days ago, the Zweig Breadth Thrust indicator was at 0.39 (thus below 0.40), having reached 0.53 at this moment.
In order for a solid rally to be sustained by sufficient momentum (to make it last at least 3 months), the ZBT indicator needs to surpass 0.615 in 10 days at most since its last reading below 0.40.
Thus, if ZBT is not above 0.615 by the 2nd of May at the latest, we should not expect sustainable bullish momentum over the next few to several months.
The Dark Side of the Zweig Breadth ThrustThe Zweig Breadth Thrust (ZBT) is an indicator developed by Martin Zweig. The indicator shows how quickly the New York Stock Exchange ratio of advancing (number of stocks with gains) and declining (number of stocks with losses) goes from poor to great. The underlying principle is that there is a rush of liquidity in the market that benefits a wide number of stocks and shows the beginning of a bull run. You can build the indicator by dividing ADVN (advancing issues) by ADCN+DECL (total issues) and multiply by 100. In other words the percentage of issues that are advancing. Then apply a 10-day Exponential Moving Average (EMA) to this number. The indicator is oversold when it drops below 40% and is overbought when it goes above 61.5%. The "Thrust" occurs when it goes from oversold (below 40%) to oversold (over 61.5%) within a 10-day period.
What does the Thrust mean? It is a leading indicator of a great bull run about to happen. There have only been 14 thrusts since 1945, but with an average of 24.6% gains in the next 11-12 months after the thrust!
Great! So what's the dark side? Someone mentioned on fintwits a few weeks ago that the Zweig Breadth Thrust almost occurred, barely missed, but framed it as a bullish sign. By default, I'm a bull and love great news, but I also like to test assumptions. So I backtested this comment. What happens when the Zweig Breadth Thrust almost occurs, but does not occur. So I tested instances in historical data that the indicator went from oversold to almost overbought (above 60.59 within 10-days) but not above the threshold of 61.50. I played with the 60.59 to isolate to a reasonable number of cases for study. The indicator will at times go over the 61.50 a few days later, but does not do so within 10 days.
On the chart, you have two views. The top is the indicator with two different colored circles. The white circles mark actual Zweig Breadth Thrusts. You can go look at those and see that they do in fact have huge gains over the next several months. The most recent was this year on May 21. We've all experienced the amazing gains that have occurred since that time. The yellow circles mark the times the indicator almost made it but backed off.
The bottom chart is the NYSE composite index, taking into account the breadth of the market's gains and losses. The yellow lines correspond to the yellow circles in the indicator chart. You can see in most cases that there is a short pump from the increasing amount of advancing stocks. But overtime, the failed attempt at Thrust eventually results in a lower low.
I find these types of things interesting. But don't overweight the estimate or the prediction. It's just another thought to chew on and balance with what else is going on. There is a tremendous amount of liquidity being created by government stimulus and the low bond yields. It's a very unique time historically in the market. So there could be more and more upside. At the same time, there's a lot of danger in that liquidity flowing into failing sectors that have no guarantee of turning positive in the near term. Eventually, the money comes back out, consolidating into a smaller breadth of areas and then eventually into alternative investments (if those become attractive).
