Was this the best buying opportunity since 2011?Sure, here's a rewritten version of your text in an engaging tone:
"Have you ever heard of the Zweig Breadth Thrust? Well, let me tell you, it’s an incredible metric that can really shed some light on the current market situation!
So, what would it take for me to believe that this bounce isn't just another bear market rally? My first step would be to dive into the breadth indicators and look for signs of that elusive breadth thrust.
Think of a breadth thrust like a rocket taking off. You need a strong initial boost to break free of gravity's grip. If the thrust is weak, the rocket can’t escape, and the same applies to stock market reversals. When we see a robust breadth thrust, that's a signal that a significant reversal is underway. Without it, we could be facing another false bounce.
Now, let’s talk numbers! As of Friday, April 25th, the SPX has surged an impressive 14.2% from its recent lows, and while that’s quite a leap, it’s essential to keep it in perspective. Just think back—this index was down 21.35% from its all-time high earlier in February during the panic sell-off. Now, with the recent strength, it’s only 10.75% off its peak.
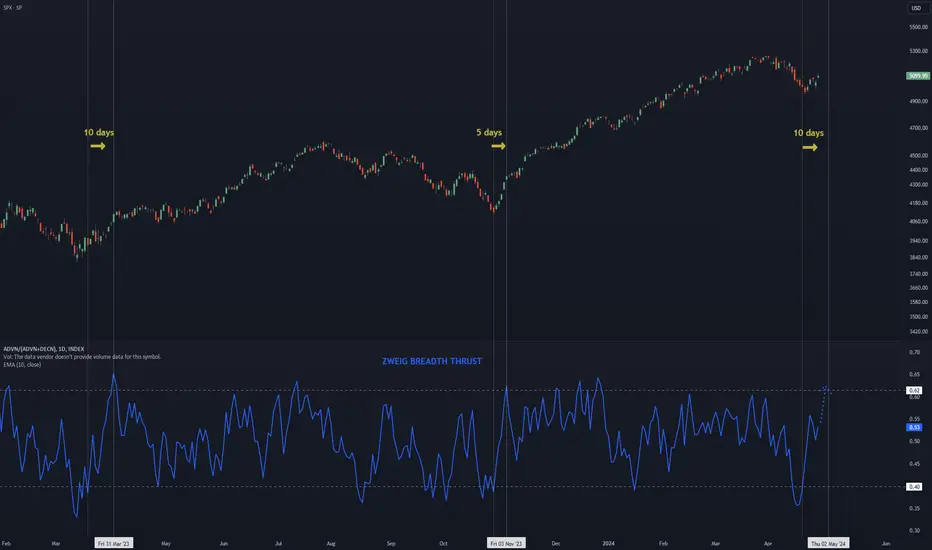
The Zweig Breadth Thrust is calculated based on the 10-day EMA of NYSE Advances divided by the sum of Advances and Declines. A bullish signal pops up when the ZBT shifts from below 0.40 to above 0.615 within just ten days or less. Keep an eye on that—it might just help us navigate these choppy waters!"
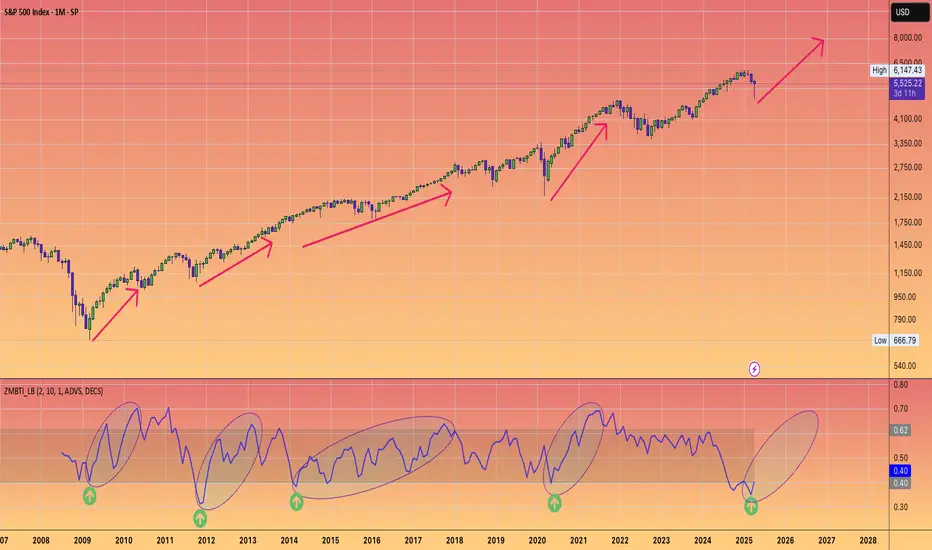
On the monthly chart, it’s clear that what we’ve been seeing in the broader economy (you know, Main Street) is actually showing us some bearish divergence—a concept I've mentioned in my previous ideas.
Since 2009, we've had four notable instances on the Monthly chart where the ZBT dipped below 0.40, only to bounce back up past the 0.6 mark. Remember back in November 2011? That was when we got a significant signal with a low reading of 0.31, which climbed back to 0.62 by February 2013. That surge sparked a bull run that peaked in February 2020!
So, the takeaway here is that this breadth thrust is generating the positive momentum we need to reach new stock market highs this year. Exciting times ahead!
Zweigbreadththrust
The Zweig Breadth Thrust above 0.615 in 4 days or else no rally!Precisely 6 days ago, the Zweig Breadth Thrust indicator was at 0.39 (thus below 0.40), having reached 0.53 at this moment.
In order for a solid rally to be sustained by sufficient momentum (to make it last at least 3 months), the ZBT indicator needs to surpass 0.615 in 10 days at most since its last reading below 0.40.
Thus, if ZBT is not above 0.615 by the 2nd of May at the latest, we should not expect sustainable bullish momentum over the next few to several months.