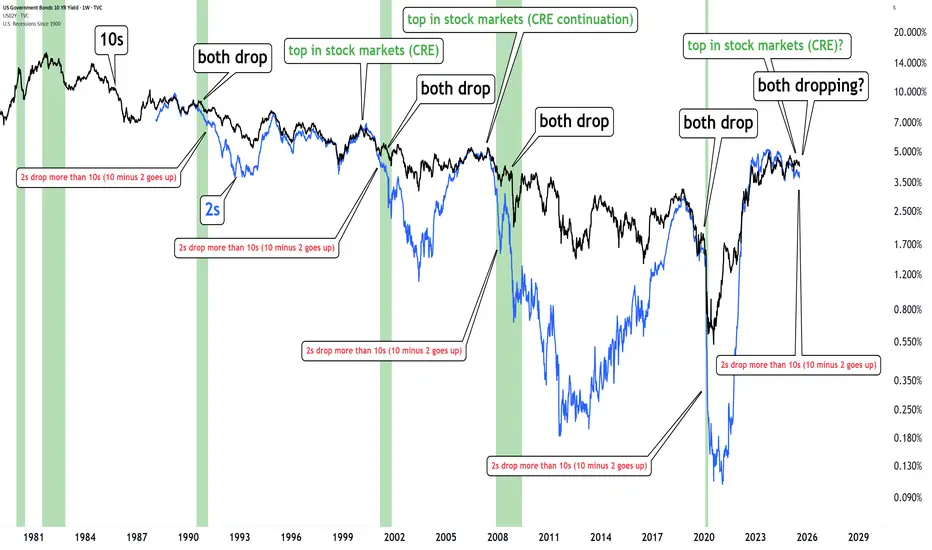
The bond market is warning us.When both 2s & 10s drop together and the yield curve steepens (10–2 rises)... It’s historically followed by important market turmoil
Happened in 2000, 2008 and 2020.
It's possibly happening again.
The bond market is warning us.
Government bonds
US10Y1. Labor Market Data
Average Hourly Earnings m/m:
Actual: 0.3%
Forecast: 0.3%
Previous: 0.2%
Interpretation: In-line with forecast and slightly above the prior period, indicating stable wage growth. This suggests inflationary pressures from labor costs remain steady, not accelerating unexpectedly.
N
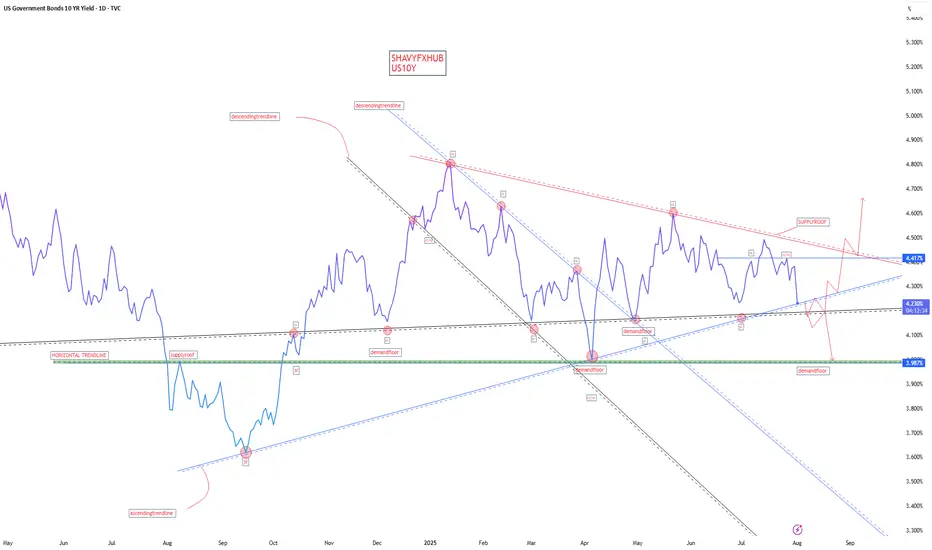
US Treasury 10Y Technical Outlook for the week July 28-Aug 1 US Treasury 10Y Technical Outlook for the week July 28-Aug 1 (updated daily)
Overnight
Overnight, U.S. Treasury yields reversed their upward trend and traded lower as investors awaited key developments from the Federal Reserve’s upcoming policy meeting and ongoing U.S.-China trade talks. The benchm
U.S. homebuilders tumble as rate cut bets decrease after Powell'** Shares of U.S. homebuilders slide on Weds after Fed chair Powell says no decision yet on rate cuts
** Markets now pointing to odds dropping below 50% that the Fed will cut rates at its next meeting in Sept, as benchmark U.S. 10-year yield
US10Y
extends rise
** Rising yields can potentially le
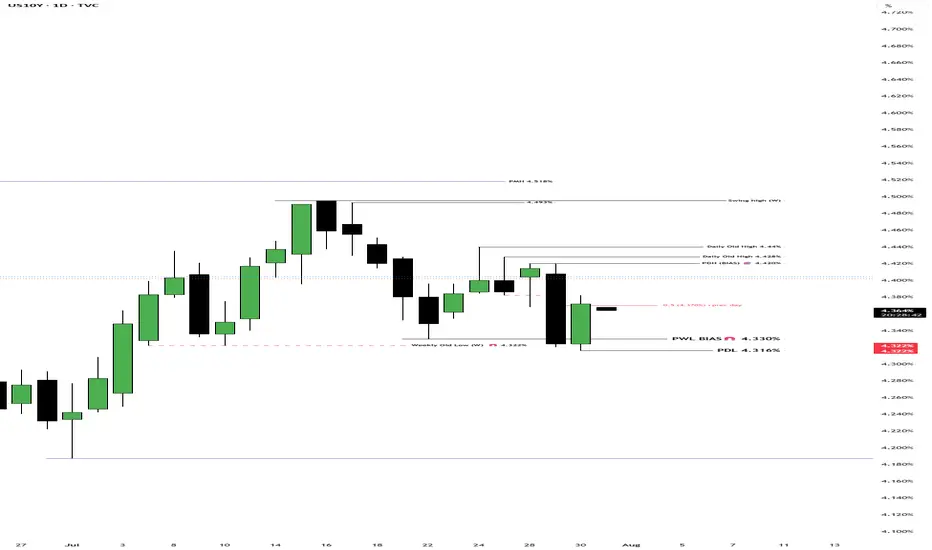
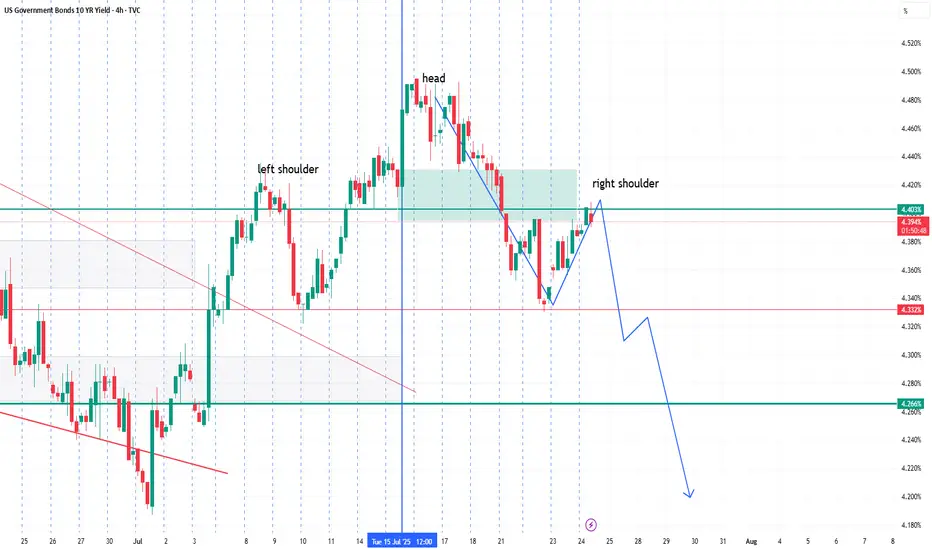
T-Bond Futures & US10Y Yields Weekly BiasUS10Y: 4.288% - 4.240%
T-Bonds: 115.11 - 115.24
Bullish t-bond, bearish US10Y

Crude Oil Spikes - Russia / Ukraine / USA sanction? Concerns about the possibility of tighter global oil supplies are supporting crude prices after President Trump warned of "secondary sanctions" if Russia fails to reach a ceasefire in Ukraine within 10 to 12 days.
These sanctions have absolutely burned the shorts in oil and can cause a 3 bar surge

US05Y Bullish ideaWe can see we had rejection after taking out our sell side liquidity and balancing our daily fair value gap. We are still showing strength in the bond market as well with the dollar index. Our DOL is to the upside in the form of buyside liquidity and our daily volume imbalance at 4.073%.
* Fundamen

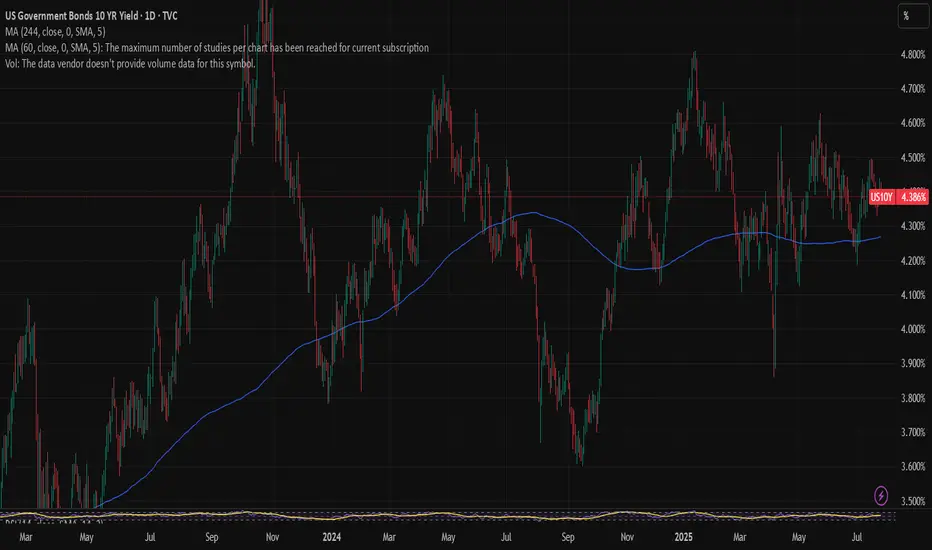
US 10Y TREASURY: FOMC week During the previous week investors were digesting the latest macro data aiming to set expectations for the forthcoming FOMC meeting, which is scheduled for Wednesday, July 30th. The 10Y Treasury yields were moving between 4,32% and 4,44%, closing the week at 4,38%. The drop in yields during the seco
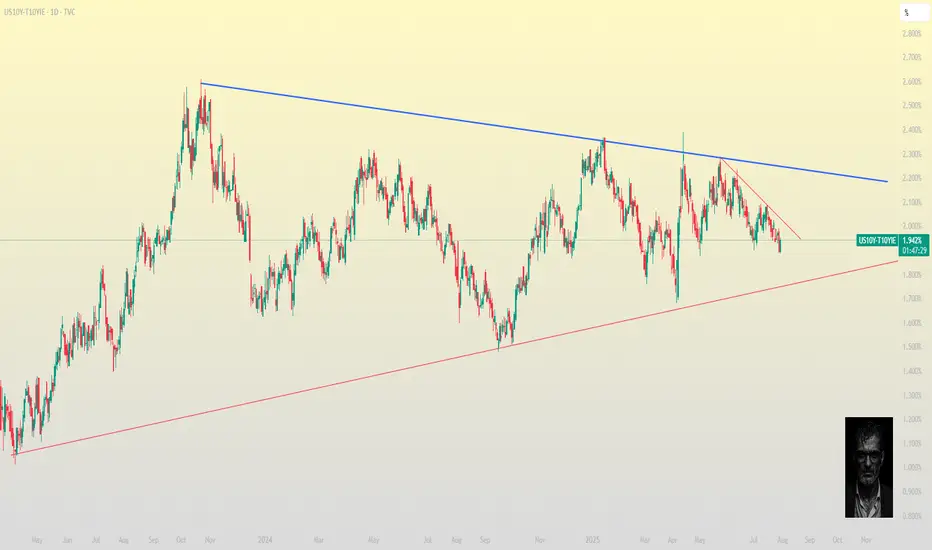
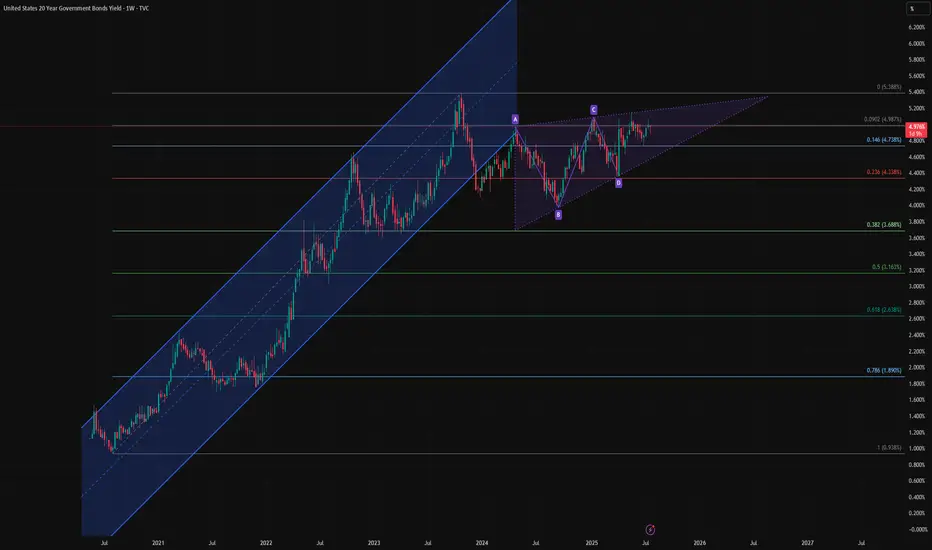
Bond Bulls Smell Blood: 20-Year Yields Likely to Fall🧩 Fundamental Bear Case for 20-Year Yields
1. Recession Risk and Slowing Growth
Leading economic indicators (e.g., ISM Manufacturing, Conference Board LEI) continue to suggest softening demand across key sectors.
A recession or significant slowdown would drive capital into long-duration Treasuries
See all popular ideas
SymbolPrice & chgYield
SymbolYield / Price
Bond collections
| 1 month | 3 months | 6 months | 1 year | 3 years | 5 years | 10 years | 30 years | |
|---|---|---|---|---|---|---|---|---|
| - | - | - | - | - | - | - | - | |
| - | - | - | - | - | - | - | - | |
| - | - | - | - | - | - | - | - | |
| - | - | - | - | - | - | - | - | |
| - | - | - | - | - | - | - | - | |
| - | - | - | - | - | - | - | - | |
| - | - | - | - | - | - | - | - | |
| - | - | - | - | - | - | - | - | |
| - | - | - | - | - | - | - | - |