A 3-5% Pull Back Then Rally Into New Year With New Highs Lets see when big boys come back tomorrow the come in sell off some
Be ready BTD Say 575
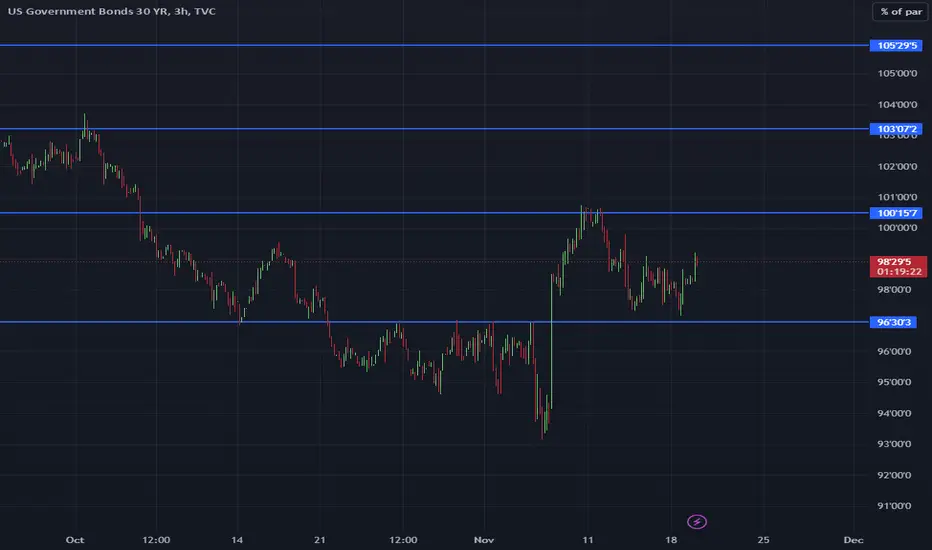
Government bonds

Market Update: EU 10-Year Yield Under Pressure The 10-year yield has faced mounting pressure over the past month, and we’re now approaching critical support levels—notably, 2.00/2.01, the recent low.
🔍 Key Insights:
• The RSI has dipped to 16, suggesting that this zone may hold on the initial test.
• However, the broader pattern since 2023 is starting to resemble a potential topping formation.
⚠️ What to Watch For:
A weekly close below 2.00 could expose the market to significant downside risks:
➡️ Targets include:
• The 2024 low at 1.89
• The December 2022 low at 1.75
• Longer-term potential to slide toward the 200-week moving average, currently around 1.46
As the bond market approaches these pivotal levels, it’s critical for investors to stay vigilant and prepared for potential shifts in the macro landscape.
Disclaimer:
The information posted on Trading View is for informative purposes and is not intended to constitute advice in any form, including but not limited to investment, accounting, tax, legal or regulatory advice. The information therefore has no regard to the specific investment objectives, financial situation or particular needs of any specific recipient. Opinions expressed are our current opinions as of the date appearing on Trading View only. All illustrations, forecasts or hypothetical data are for illustrative purposes only. The Society of Technical Analysts Ltd does not make representation that the information provided is appropriate for use in all jurisdictions or by all Investors or other potential Investors. Parties are therefore responsible for compliance with applicable local laws and regulations. The Society of Technical Analysts will not be held liable for any loss or damage resulting directly or indirectly from the use of any information on this site.

10 year yield in downfallThe 10 year yield broke the trendline and we see a bearish divergence which is playing out.
If trends continues risk-on assets could surge!

10 year yield in downfallThe 10 year yield broke the trendline and we see a bearish divergence which is playing out.
If trends continues risk-on assets could surge!

US 10Y TREASURY: NFP on scheduleRegardless of a Thanksgiving Holiday in the US, during the previous week the 10Y US Treasury yields slides back till the levels from October this year. The yields started the week around the level of 4,42% while they are ending the week at 4,17%. Feds favourite inflation gauge, the PCE Price Index was released early in the week, which was in line with market expectations. On the other hand, FOMC November meeting minutes were released suggesting a Feds members conclusion that in case of further inflation relaxation and labour data in line with their expectations, there will be a case for further rate cuts.
At this moment, the CME FedWatch Tool suggests 66% odds that the Fed might cut interest rates by another 25 basis points at their December meeting. The US Treasury yields reacted to these expectations. As per current sentiment, there is still space for a further drop in yields, at least until the market properly tests the 4,0% level. It should be considered that Non-farm Payrolls are scheduled to be released in a week ahead, in which sense, some volatility might follow the US yields.

US10yr yield headed higher after pullback towards 4%Self explanatory.
Early stages if wave 5 higher for yields to 6%+ in coming quarters but likely to see a pullback to 4% in days/weeks ahead first.

US 10Y TREASURY: watch for October PCEPrevious week markets spent on digesting currently mixed economic data as well as statements from a few Fed officials. The most important question at the moment is whether the Fed will cut interest rates at December's FOMC meeting or not. Statements of two Fed officials were rather mixed. On one side, Chicago Fed President Goolsbee noted his view on a need for more rate cuts, but the pace of it should not be speeded up. On the other side is Fed Governor Bowman, who stated that the fight against inflation “appears to have stalled”. The week ahead is important for markets, as October PCE data are set for a release, in which sense, might provide some clearer picture to markets of a potential next Fed move. At the current moment there are only 35% odds that the Fed will cut rates by 25% in December.
The 10Y US Treasuries were traded in a relatively mixed manner, exposing market uncertainty over the potential Feds move. The yields started the week around the level of 4,48% and for the rest of the week was oscillating around the 4,4% level. Further relaxation might continue during the week ahead, in case that the October PCE is in line with the current market expectations. In case that there are some deviations, then the yields might return toward the 4,5%. However, the most probable scenario is further relaxation of yields, at least to the level of 4,3%.

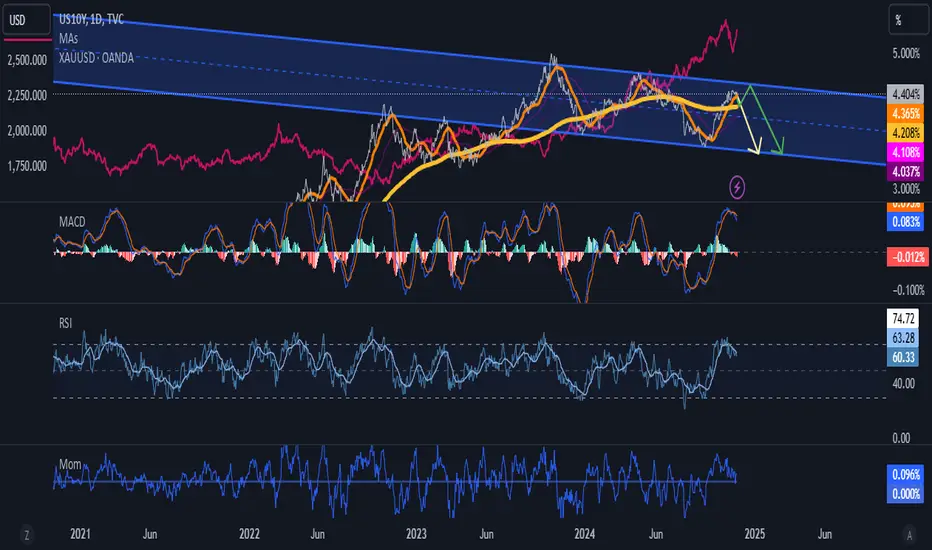
Bonds, gold and nextwe see, every wave has shorter distance on the time 200ma and when ever price touches to 20 ma, it stars falling. We also see indicators has sell signal.
How ever it still has LITTLE chance to see top side of channel quickly because momentum looks very wavey (green arrow).
In this case i put my bet for bears. Because there is more reasons for me(yellow arrow).
Also i want to notice that bond and gold has still correlation. NOT like before but still...If we look from this point gold has already started pricing this action.
And sory guys for messy chart but all need i guess. And again sory for bad english.
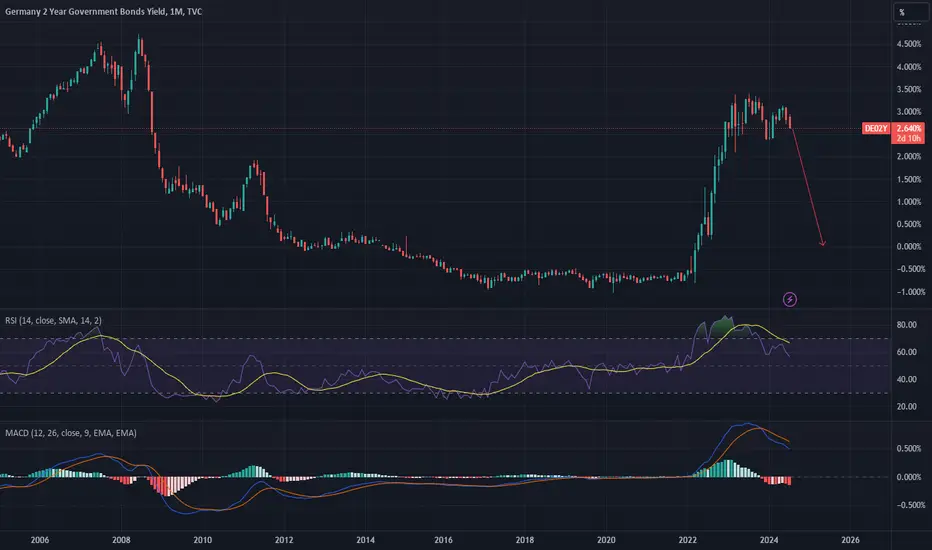
2 Year German Government Bond Yield going down.2 Year German Government Bond Yield is going down.
Hold 2 Year German Government Bonds to capitalize on it. (Yield down, Bond price up)
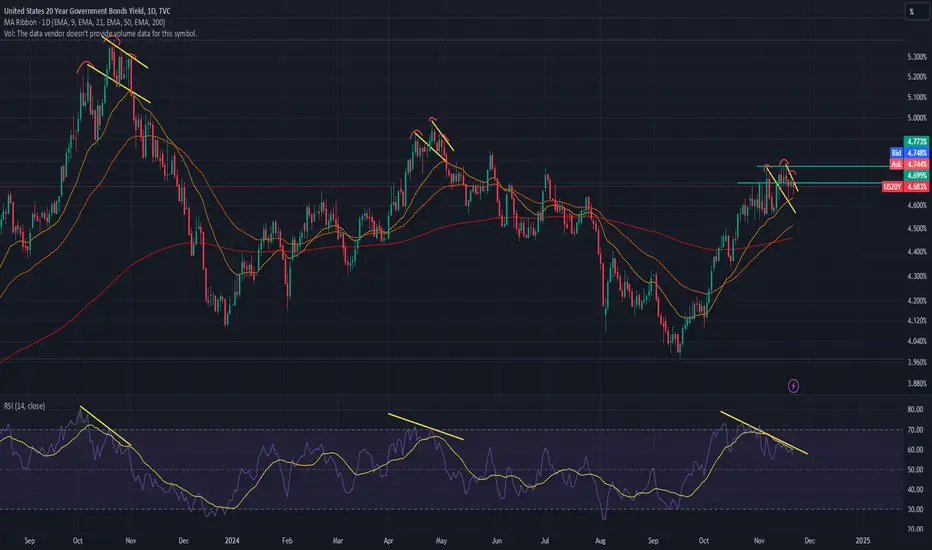
Yields to go down IMMINENTLYDo you see it?
Inverse HnS forming with a down channel.
This formation will be confirmed with a failure at the 9 EMA.
Loaded TLT Calls for this move.
US DOLLAR - Let Me Explain My Bearish Thesis...In this video, I’ll share why I believe the markets are on the verge of a major downturn.
By analyzing the US dollar chart alongside Gold, the S&P 500, and Bond Yields, I’ll explain why we may be approaching the final stages of this market cycle for stocks and asset prices.
This shift could devastate the economy, setting the stage for the next bull market. While the extent of the drop will depend on market forces, I’ll explore how such a scenario could unfold. We’ve already seen Oil prices plunge to zero—if you think that can’t happen to other markets, time may prove otherwise.
This is simply a turning point, a necessary reset to pave the way for future growth.
This is not financial advice.

Long Term - US 2y with SPYThis 2 year plan is explained below.
Chart = US 2 year on the top // SPY on the bottom
To understand my charting and thought process, if you wish to, it’s best to start with the macro idea here. I’m tracking the US2 year yield. The peaks in ’89, ’00, ’06, ’18 and ’23 have created overturned cycles leading into recessions. Sure, the 2023 peak has not yet resulted in a confirmed - back dated - recession but the data is thick enough to predict one in my opinion.
I think an equally important point here is to understand that putting a chart together with as much information as you can on an encompassing idea over a longer period of time is beneficial. It is to me anyway. I’ve chosen to focus on the largest market in trading…the bond market.
So that being said, it’s probably best to just explain the lines and y’all can make your own conclusions.
Ingredients:
Vertical Lines
Red = SPY market tops. And note the following % loss
Green = SPY market bottoms that note the following % gains
(it’s hard to read yes…anyone can build the chart and see the #’s if they want)
Black = when a recession was officially declared. It’s always too late…FYI😊
Purple thick = when a 50bps reduction was mandated during FOMC. What I think is interesting here is that a -50bps cut happened 4 times during the ’07-’08 GFC, 9 times through the DotCom era and even 3x in the early 90’s. We’ll see a few more -50 in 2024-25 for sure and when interest rates are at 3.75-4.0 I’ll be mostly out of equities I think. If 2y doesn’t dead cat bounce from here I’m looking at as early as Q1 2025 to exit.
The rest is self-explanatory. Bond yields are getting ever increasingly more volatile // 370% swing low to high post Dot-com to 5000% post covid to 2023?!. WTF…lol. We can see it clearly in the RSI. S&P is getting more volatile since 2018 too. Nice for trading but not ideal for recent long term investors.
Horizontal Lines
Blue = the bottom channel-ish on the 2y yield. It’s my own idea, so take it with a grain of salt please. I’ll be borrowing money at 1.5% or so in mid 2026 and going long AF.
Of course as the charts evolve the thesis may get massaged but as an overall macro trend I don’t see a flaw in it yet.
I think that’s it. Stay well traders and all the best.
MR

Technical Analyses1. Market Direction (up or down)
2. Trend ins (up or down)
3. Entries
i. Higher high- on top) for down trend
ii. Lower low DL for up trend
4. Stop loss
i. 2 levels below
5. Take profit
i. 1:3
US 10Y TREASURY: Fed is not in hurryPrevious week on the US Treasury bond market was marked with Fed Chair Powell's comment that the Fed is “not in a hurry to lower interest rates”. The note came from Feds perception of a strong US growth, in which sense, there is no need to cut interest rates too soon. This marked investors confidence, so 10Y Treasury yields continued their path toward the upside. The highest weekly level reached was 4,49% at one point, however, yields are ending the week at 4,44%.
It will take some time until the markets digest the mentioned note from Fed Chair Powell. Now the question is whether the Fed will cut interest rates at their December's meeting, or the rate cut will be postponed for next year. As per CME FedWatch Tool, the market is expecting with a 62% odds, that the Fed will cut in December by 25bps, while the rest is of opinion that the Fed will keep rates unchanged. This digesting might bring some volatility back on the market, where yields might move between 4,5% and 4,4% during the week ahead.

BUFFET AINT TAKIN NO L'S : 10Y FORECASTForget the metrics
forget the indicators
This man is all the indicator i need and if he selling 75bn NASDAQ:AAPL stock while owning 356bn TVC:US10Y why deny it of course NASDAQ:AAPL overvalued along with the rest of tech but recession is recession baby

XAO - AU10YR - Australian Stock Market - 10 YR Bond YieldsStarting with this video, I'll begin incorporating insights from AriasWave into each new release.
Here, I dive deep into what I believe to be the true pattern of the Australian Stock Market and discuss what might unfold next.
I also analyze 10-year bond yields, presenting a case for significantly higher rates—potentially reaching at least 16%. This isn't just about making bold predictions; I break down the reasoning behind these conclusions using detailed wave analysis.

US10Y 1D RSI Bearish Divergence signals a long-term sell.The U.S. Government Bonds 10YR Yield (US10Y) has been trading within a Channel Down pattern since the December 27 2023 Low. The price is above both the 1D MA50 (blue trend-line) and the 1D MA200 (orange trend-line) and is approaching the patterns top.
The 1D RSI is already making a bearish reversal though, having posted Lower Highs against the price's Higher Highs, which technically is a Bearish Divergence. As a result, we expect the Bullish Leg to top soon and then reverse to the Channel's new Bearish Leg.
The previous one made a Lower Low at the bottom of the pattern on the 1.2 Fibonacci extension level and as a result our Target is just above it at 3.500%.
-------------------------------------------------------------------------------
** Please LIKE 👍, FOLLOW ✅, SHARE 🙌 and COMMENT ✍ if you enjoy this idea! Also share your ideas and charts in the comments section below! This is best way to keep it relevant, support us, keep the content here free and allow the idea to reach as many people as possible. **
-------------------------------------------------------------------------------
💸💸💸💸💸💸
👇 👇 👇 👇 👇 👇

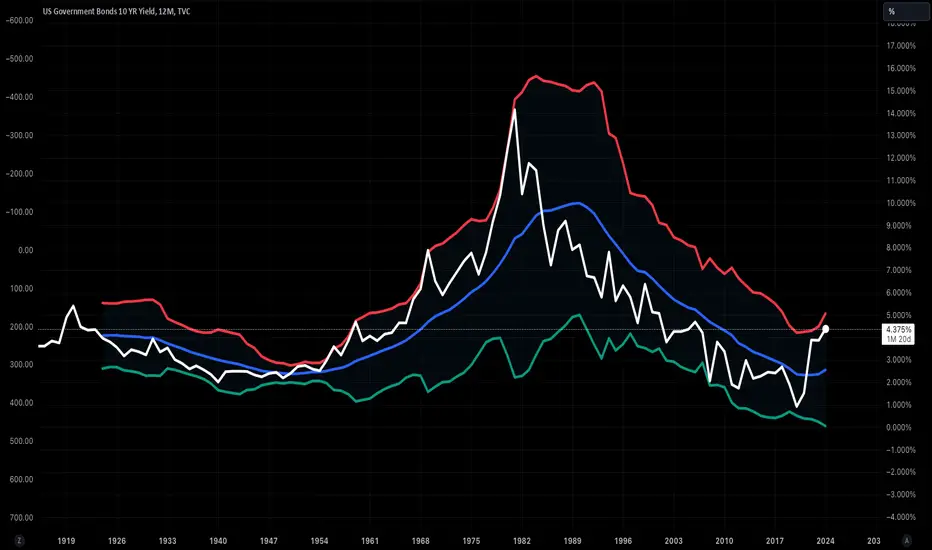
The Best Explanation of The Bond Market You're Ever Gonna Get12 Month US10Y Bollinger Bands between 2.5 and 2.9 Standard Deviations away from a moving average model greater than 4 years in length, preferably exponential. I haven't optimized this to perfection, but it's close enough to give you the basic idea.
The bond market is just a simple oscillator emerging from a complex system and simply does what every other very large and complex system does. It has a trend around which it travels but in decades and centuries not years. It isn't complicated, but it is extremely slow.
There are 2 phases and a 5,000 year long trend. It goes up. It goes down. Over the course of centuries it declines. In the down phase, it stays below trend and does the exact opposite in the opposite phase. A kindergartener can trade this thing.
Currently the phase is turning over from a down phase that lasted from 1980 to 2020, and entering into a new up phase that will most likely last for 3-4 decades.
Trading it: buy secondary market long duration government bonds at the bond yield 3 standard deviation line and sell at the trend. Repeat for the next 30-40 years. Easy peasy.
US 10Y TREASURY: still digestingIt was an interesting week for US Treasury bonds. Although markets went into hype after the election of Donald Trump as the next President of the US, the 10Y Treasury yields remained out of this scope. Their exclusive focus was on the FOMC meeting and Fed’s next move. As expected, the Fed cut interest rates by another 25 bps, with a solid overview of the US economy at this moment. The 10Y Treasury benchmark reached its highest weekly level at 4,47%, after which some relaxation came, down to the level of 4,30%.
Markets will use the week ahead to digest currently available data. The Fed has another FOMC meeting scheduled in December. Markets are expecting, with currently 75% odds that the Fed will make another rate cut by 25 bps. In line with this sentiment, it could be expected that 10Y Treasury yields will continue with a relaxation. However, some volatility might also be expected, where the yields might shortly turn to the upside, testing levels modestly above current 4,3% level, before they make a move toward the 4,2% level.

US 10Y Yields - Are The Bulls Loosing Momentum? The continued draw up into premium pricing might be weakening.
Remember, there is nothing irregular about a minor retracement back down into a sellside imbalance in the grand scheme of the uptrend

10-2 year yield outlook updated My expectation
Fed cuts,
10-2 year yield drops
Fuel for the final rally - assuming it'll be 4-8 wks and extremely aggressive
Just an idea, not financial advice
As always, pictures can evolve or change

US 10Y Yields - 4.493% Is Up For Debating Bullish but taking a lot of cautions due to the current sentiment at the moment.
Low resistance liquidity run from 3.599% to 4.386% in a little over 7 weeks is a trend that could continue but as a trader who likes to see both sides of the story, it's; only a matter of time before the trend will reverse.
The real question is when??

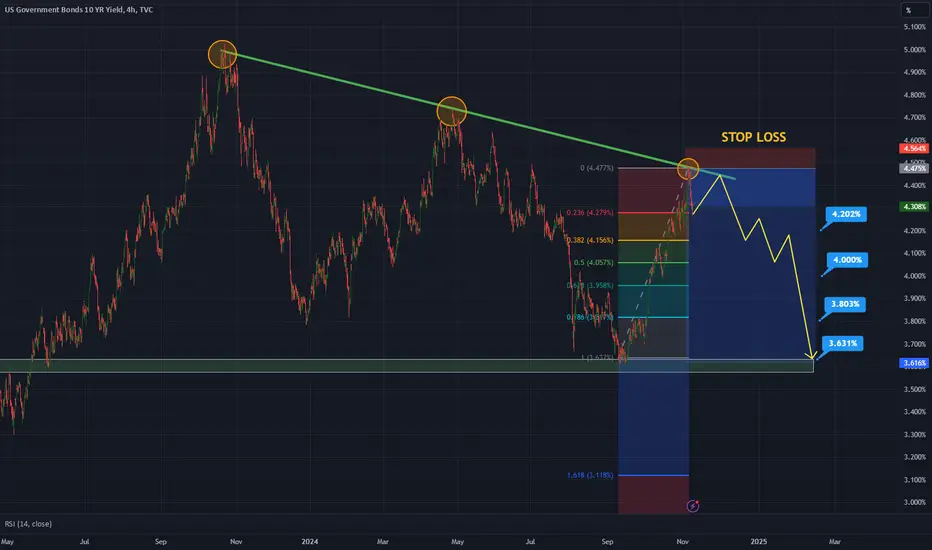
10Y BOND MARKETS CAB DROP TILL!!!!!HELLO FRIENDS
AS I can see 10Y Bond markets to have Drop with a view of technical analysis it had tested trend line on 3rd test and fail to break and if we see Fib retracement then don't forget its just starting and can test golden ratio 0.50 & 0.618 easily chart is based on 4hr TF till design TP
Friends this is just a technical view share Ur thought with us on this chart stay tuned for more updates