We are close folks. 2 year bond market close to shift to a downtrend that could be trigger a major correction on spy . Recession time ahead folks
Government bonds

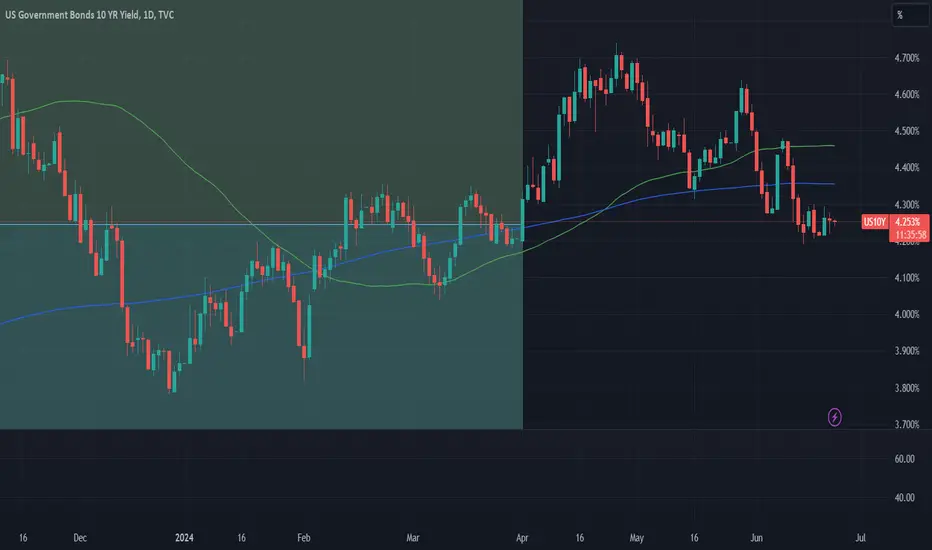
US 10Y TREASURY: June inflation and PPIMarkets reacted to released unemployment data during the previous week. The increasing unemployment to 4.1% in June from 4.0% in May was an indication to investors of a possibility that inflation pressures will slow down on decreased employment and that it will provide the necessary space for the Fed to cut interest rates in September. After struggling to sustain yields during the past several weeks, the market finally reacted in a relaxed manner during the previous week, by bringing the 10Y benchmark yields down to 4.28% on Friday. Yields started the week around level of 4.48%.
For the week ahead, it should be considered that June inflation and PPI data will be published. Although surprises in inflation data are not expected, still, in case that posted figures do not fit market expectations, the market will correct current pricing. As per current charts, the level of 4.20% is indicated as the next level to be tested. However, some volatility might be expected, but not higher from 4.30%.

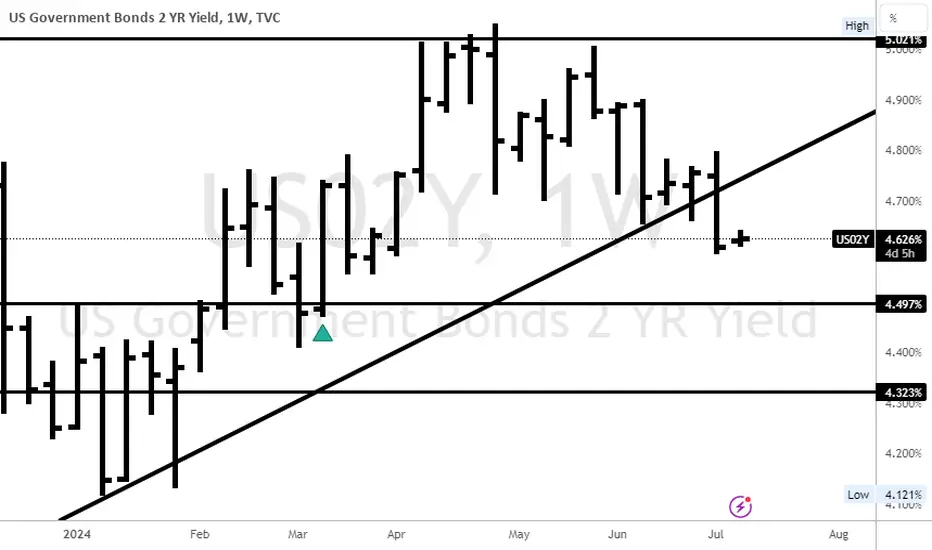
Can higher projected US02Y impact GOLD price ?TVC:US02Y has been trading to attractive levels fibonacci levels of 50% resulting in formation of bullish flag. Price is projected to go to 5.5% according to flag pattern. Recent NFP had higher than expected unemployment claims. Will this scenario attract investors to buy more bongs ?
What do you think will be impact of bullish bonds yield to the price of GOLD ?

Be careful when the RSI for the US10Y gets to 46. For the DOT COM crash + Financial Crisis crash, the market tops happened when US10Y monthly RSI touched 46. Only downhill after.
Pay attention!

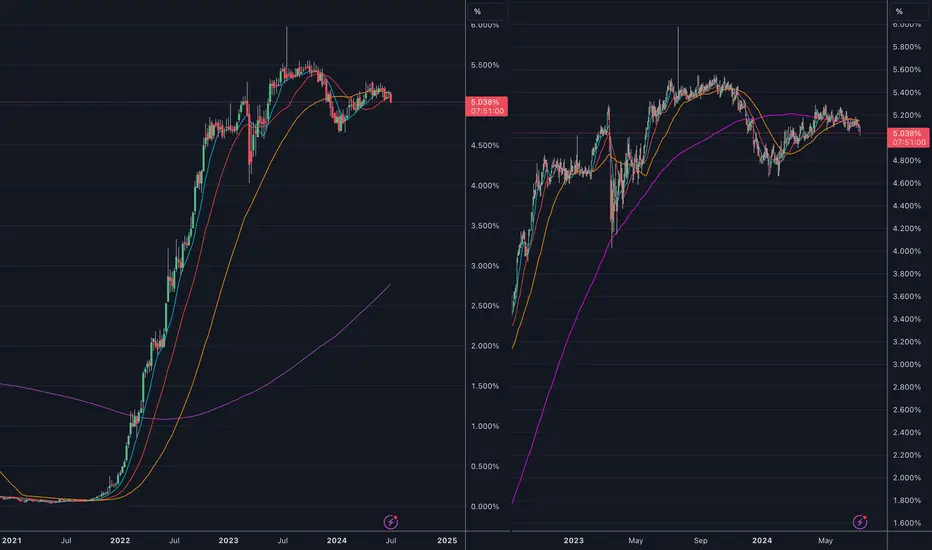
US01Y Treasury Head and ShouldersBeen watching the US01Y treasury as its chart patterns certainly are just as valid as normal stocks, but it really reflects the basis of the whole US economy being highly correlated to the fed interest rate.
Right now we have a very well-defined head and shoulders pattern after quite the straight line up from near-zero from the covid era.
The action this week in particular is interesting, in that it may be starting to reveal an initial tipping point.
Up until this week, I wasn't sure if it was going to be a head-and-shoulders fakeout leading to a continued uptrend in rates, but this looks more like the possible beginning of a new trend back down, **if this decline continues over the next few weeks...**
The 200-week SMA on the left screen would be a likely target, so somewhere between 2.5% - 3%...
Let's see!
2Yr Yield Rolling Over?And there goes the the 2Yr Yield, it is whimpering.
Unless something happens this is rolling over further.
10Yr Yield had a nice bounce but it is also rolling over.
TVC:TNX is only 33 basis points from normalization!
Short term #yield is looking very weak, 6 month and 1 Yr, not shown.
More info see profile...

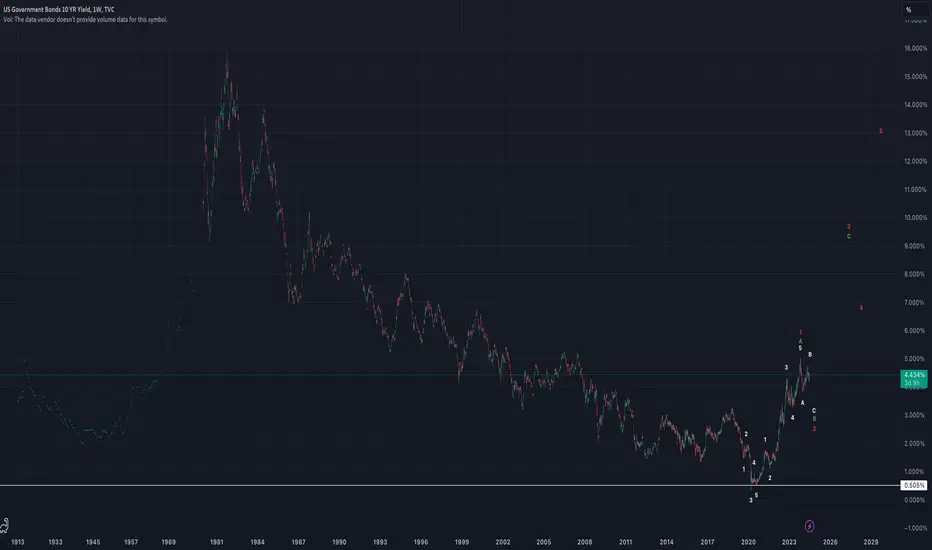
US10Y, morning updateUS10Y doesn't paint too rosy a picture for the cost of debt, it would seem.
This count shows a truncated bottom at COVID-low, pretty clear impulse wave up from 0.505% to complete an A wave or wave 1.
Wave B or 2 looks like a zigzag so far.
If count is correct, the implications for the US economy would be dire, I would think.
US 10Y TREASURY: digesting inflation dataFriday brought some higher volatility on the markets as newest inflation data were released, as well as the consumer sentiment. Although 10Y Treasury yields spent the first half of the week testing levels above 4.20%, still, released inflation data pushed the yields toward the 4.40% level. Released PCE data showed inflation at 2.6% y/y, which was the lowest level for the last three years. Still, the market also took into consideration Michigan consumer sentiment, which reached the level above the market estimate, and exposed consumer expectations that the inflation will stay elevated around 3% within the next year.
The market priced recent available information regarding the potential Fed's move in the coming period. The CME Group's FedWatch Tool is still showing that the majority of participants are expecting that the first rate cut might occur at September`s FOMC meeting. Still, it should be noted that Fed Governor Michelle Bowman noted in an interview during the week, that she does not dismiss the possibility of increasing interest rates if inflation turns to the upside again.
Since the market reached the 4.4% level on Friday, it could be expected that digesting of the latest inflation data will continue within the week ahead. In this sense, there is a higher probability that yields will ease during the week, at least to the level of 4.3%.


Wen Next Recession?Noise reduced monthly vantage point for the 10 year minus 2 year yields.
consolidating ABOVE
12 month moving average
Tic toc...
#recession #rates #inflation #yields #fomc #fed

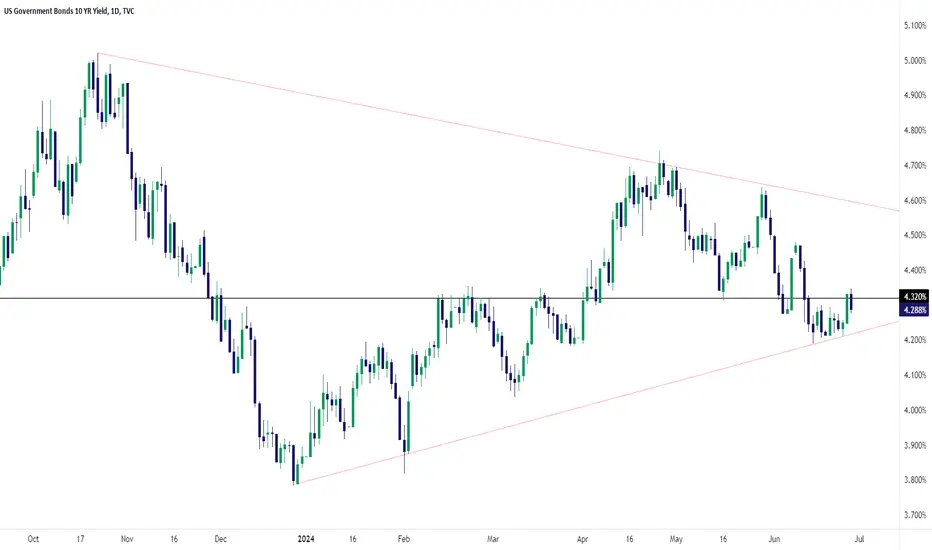
10yr Treasury Yields Consolidate at Key 4.32% LevelThe world’s most important market, the 10yr US Treasury, is trading directly at a critical level. Going back years, the 4.32% level has served as reliable support/resistance, and today’s drop after peeking above that level yesterday has only emphasized the importance of that key level.
At the same time, the 10yr Treasury yield has put in a series of lower highs and higher lows dating back to Q4 of last year, creating a symmetrical triangle pattern that could lead to an outbreak of volatility in the coming weeks. A bullish breakout above 4.60% would hint at a possible retest of 5.00% (and likely weigh on risk assets like stocks and higher-yielding currencies), whereas a bearish breakdown in yields would open the door for a drop toward the December lows near 3.80%.
-MW
Yields are in a do or die situationYields are pulling back a bit from the run they had yesterday. It was expected to have a bounce at the support levels.
The 2Yr & 10Yr #Yield both look as if they want to settle a bit but time till tell . We will see how Yield reacts over the next few days. It is important as a crashing yield can mean higher prices all across the board in many assets.
We've stated before that they CANNOT lower rates but at the same time CANNOT raise them. Seems as if they are playing around a bit providing liquidity to keep markets propped up a bit AND they may keep rates steady or just have 1 rate drop, before election.
TVC:TNX

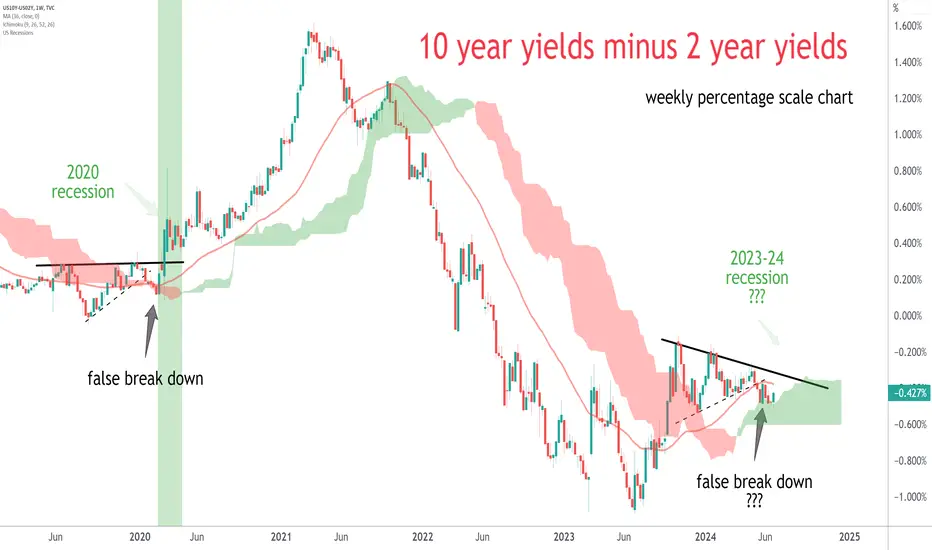
10 year minus 2 year yieldsWinter is coming...
10 year minus 2 year yields
weekly percentage scale chart
#recession
S&P500 & Nasdaq inverse correlated to 2/10yr curveThis is US10Y-US02Y (inverted) in blue, S&P500 in orange & Nasdaq in light blue.
The 2's/10's spread has steepened meaningfully 3 times this year & each time has coincided with a sell off in the S&P500 & Nasdaq. It's just steepened again & the S&P500 is holding it's 4hr 50ema for now having made a lower high. Let's see what happens.

US10Y 2024 FULL YEAR FORECASTI will start forecasting full years in advance
and provide updates from there finally understand how the bond markets works
dont be fooled folk 2024 nasdaq is crashing market is overbought the recovery was too quick
easy come easy go and only the informed are preparing their shorts
if u appreciate my work
like, tip, comment, follow

US10Y - Targeting Buystops This WeekBullish bias going into next week with high probability setup forming if we are to witness a short-term sweep of sellside @ 4.190% before a retracement

US 10Y TREASURY: PCE weekUS Treasury yields had a relatively calmer week. Higher volatility was exhausted after the FOMC meeting, two weeks ago. The economic data are weighted and in expectation of the new ones the 10Y US benchmark was moving within a relatively short range, between levels of 4.20% and 4.29%. However, the major concern of market participants continues to be when the Fed will cut interest rates?
Recent economic data are showing some potential that the US economy is beginning to slow down. This might be one of the triggering events for the Fed to cut interest rates, despite relatively elevated inflation figures. The week ahead is bringing PCE data for May, which is Fed`s favorite inflation gauge. In case of any surprises, the volatility might be easily back on markets. As per current charts, there is some potential for 10Y yields to test a bit higher ground, above 4.30%, while continuing to test the 4.20% level.
3M US10YThe 10yr treasury yield is headed to 8-10% in the early 2030’s, as the commodity super-cycle ensues. Expect a pull-back in yields to re-test trend-line, then it’s off to the races.

US10Y - 4.335% Equilibrium In The Works We are witnessing a relief rally from the massive capitulation last week.
A lil upside movement won't harm a fly right??

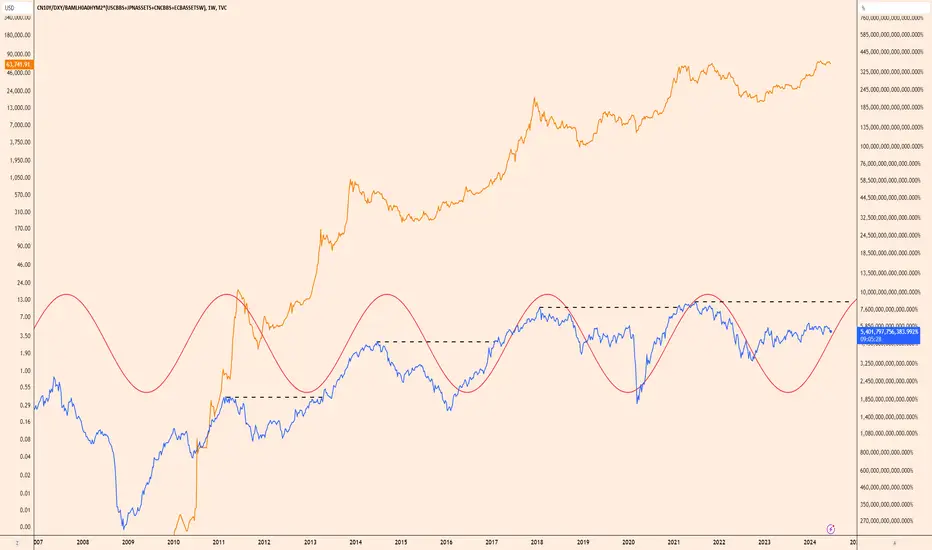
Bitcoin and Global LiquidityWhenever global liquidity increases, this liquidity increase fuels Bitcoin and supports Bitcoin's rise. This pattern has been continuing in the form of a sine wave since 2009. Global liquidity falls at certain times and rises at certain times. Since 2011, global liquidity has been rising in a low-speed trend, exceeding the previous peak each time it rose. Global liquidity, which last peaked in 2022, returned to a slow increase at the beginning of 2023. I think there is currently at least a 100% gap for this rise to be completed. I think Bitcoin will also rise as this gap is filled. I think it is essential for at least a long-term cryptocurrency investor to follow global liquidity closely. While this global liquidity is not meaningful to explain the SP500 or Nasdaq indexes, it appears to be in full correlation with Bitcoin.
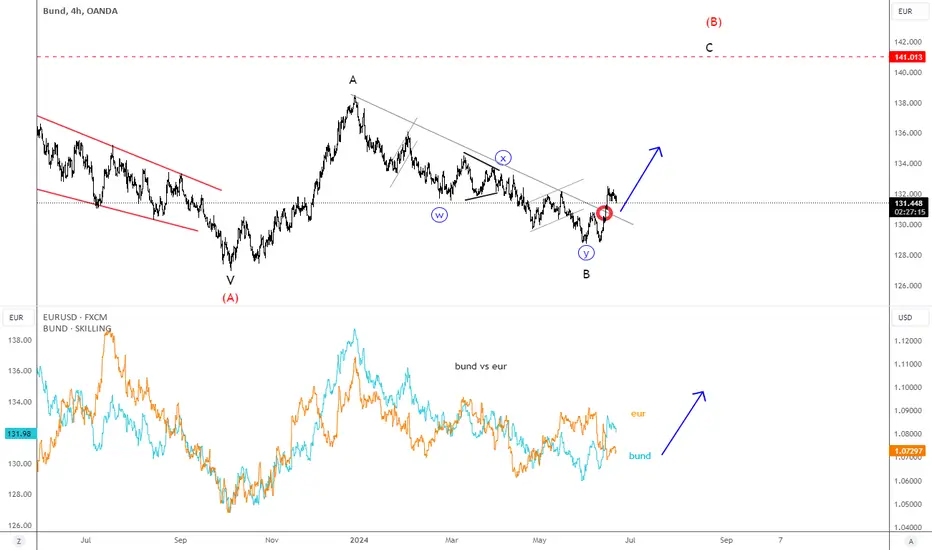
German Bund Can Stabilize and Recover The EURUSD PairGerman Bund is nicely breaking above important trendline after a completed complex w-x-y corrective decline in wave B, which can now send the price higher for wave C towards 140 resistance area. If we respect a positive correlation between German Bund and EURUSD currency pair, then EURUSD could easily stabilize and recover.
Bund ProjectionsSometimes a drawing can speak better than words, or at least present an idea in a better and more efficient way. This project involves projected tendencies and forces that might affect the price, represented with the curves as attractors and influencers with their respective arrows pointing the direction of the potential simulated pressure applied to the tendencies of the market.
Rectangles are projected potential support and resistance in their respective time zone. The white one is different, the exception to the rule, but it could end up having some interesting price action near it (/if the price reaches that zone).
The purple cross is interesting with it's time stamp for a potential time zone of interest, while it's marked price level could be relevant if the price reaches it in this project. Orange rectangle is the wild card which could end up being irrelevant as trying to predict potential simulated scenarios of evolution of price action is not a concrete and exact science and we deal with probabilities and tendencies.
The purple monster curve wishes to be the big kahuna of the project if it ends up being a success, meaning relevant price action is to be watched near it. All elements can provide signals through Japanese Candlestick analysis and hunt for inflection points / reversals, but the purple one could be the big showdown whether it is a bounce, or a break and retest, the function of the curve is applied with the intention of catching as many as possible potential simulated scenarios and unfoldings of events.
Nen projects are for recreational purposes only and the authors are not liable in case of loss of capital caused by the trading decisions inspired by them. Every trader is responsible for his own trades and decisions. May the force of profits be with you!
