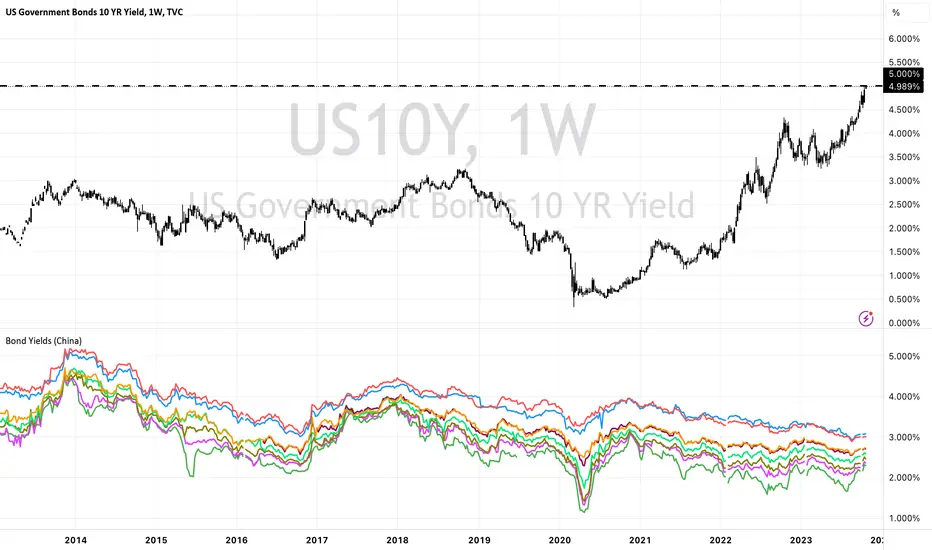
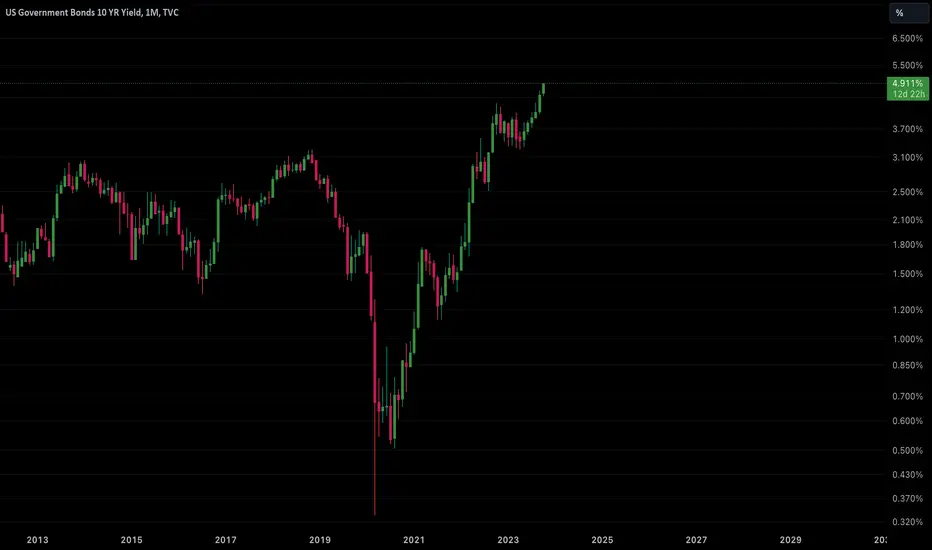
US 10Y Yields First time US 10Y Yields have hit the 5% mark since July of 2007.
Interesting to note.
Concurrent to this China has recently turned on the money printers which has lead to more PBOC Liquidity etc.
With that being said it has partially driven crypto prices, albeit low sentiment.
Which is lovely to see :)
Before I get political, this may or may not get controlled soon. I'll let my political views be up for speculation.
They may though deploy the same as Japan some yield curve control.
Crypto is still long for me (ofc).
Although, stocks and other risk assets are becoming more uncorrelated.
So do with that what you may.
There is no current sign of exhaustion, for the 10Y in the short term.
Soon enough though there will be.
Government bonds
US 10Y TREASURY: has finally topped?It was a sort of game of nerves during the previous week, watching the US 10Y yields reach the level of 5%. This occurred for the first time after 2007, but the difference on charts was that no one was sure whether yields would stop at this level. It was such a strong push to the upside, after Fed Chair Powell's speech at the Economic Club of New York on Thursday. Although he said nothing new with respect to potential further rising of interest rates or inflation, still, the markets did not want to hear that jobs and economic growth need to suffer in order to bring the inflation down to 2%. Adding to it the developments within the Middle East crisis, the perfect storm occurred with US Treasuries.
Friday`s trading session brought some ease in 10Y Treasury yields, so they finished the week at the level of 4.91%. In case that they continue to ease in the week ahead, then the level of 4.80 might be the next stop for yields. However, in the case of any potential negative news which might bring yields to the higher grounds from 5%, it would certainly not be at all a good sign for the future prospectus for the US economy.

IS THIS STILL RELEVANT?This thread will be dedicated to my thoughts more about inflation and sharing my "monetary" non-political point of view.

uptrend till 5,25%I only see uptrend till 5,25% guys like rockie-feller, roths-child and the rest of scumbags elites just print money and buy bonds to hold its price...you must short the T-note future contracts ZN1 and fVck all them up!

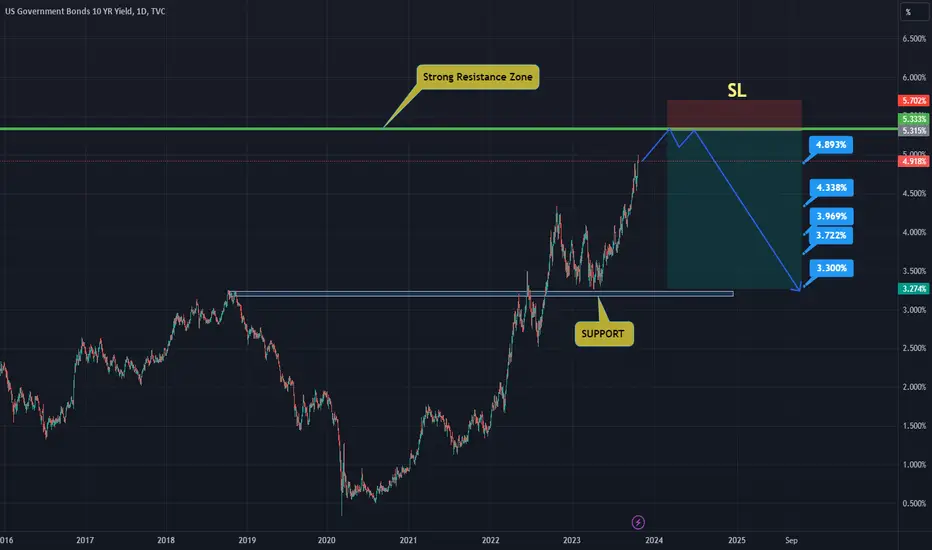
US YIELD 10Y SELL FROM RESISTANCE ZONE HELLO TRADERS ,
As i can the chart is going to reach at a strong resistance zone and 10Y already our bought
so i am looking to let it complete this move and then we will get in trade with a very low risk and higher rewards ....
kindly share Ur trade ideas and stay tunes for new updates on these charts
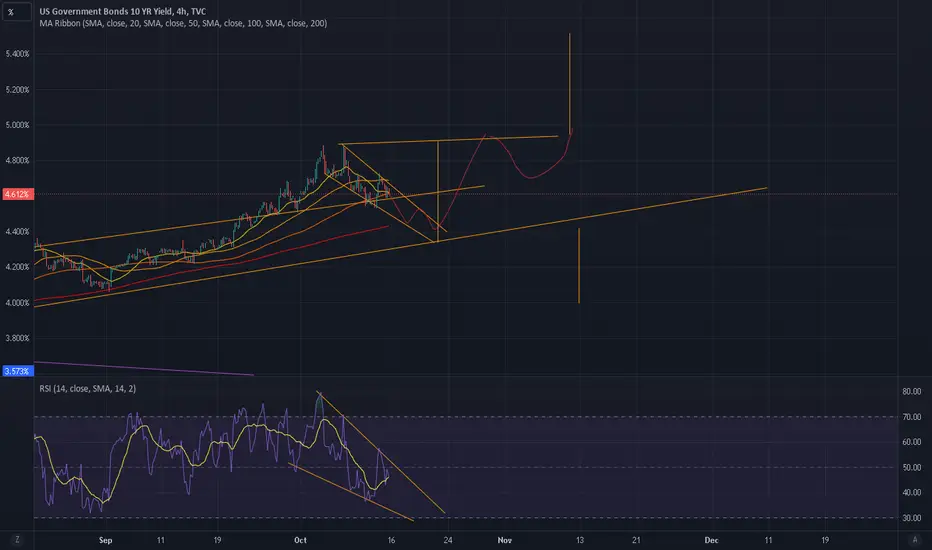
US10Y Bearish Divergence tells us it may be time for correctionLast time we looked at the U.S. Government Bonds 10YR Yield (US10Y), it gave us a technical bounce and profitable buy signal (see chart below) as the Higher Lows trend-line held:
This time we get an opposite signal as the 1D RSI formed Lower Highs, while the price is on Higher Highs, which is a technical Bearish Divergence. The asset is still supported both by the 1D MA50 (blue trend-line) and the Higher Lows 3 trend-line since the May 04 Low.
Our strategy is to sell and target a price slightly above each Higher Lows trend-line, then re-sell if a 1D candle closes below that Higher Lows trend-line. Target 1 is 4.745, if a 1D candle closes below Higher Lows 1, we will re-sell and target 4.645 (expected contact with the 1D MA50). If Higher Lows 2 break, then re-sell and target 4.465 on Higher Lows 3 and a projected contact with the 1D MA100 (green trend-line).
-------------------------------------------------------------------------------
** Please LIKE 👍, FOLLOW ✅, SHARE 🙌 and COMMENT ✍ if you enjoy this idea! Also share your ideas and charts in the comments section below! This is best way to keep it relevant, support us, keep the content here free and allow the idea to reach as many people as possible. **
-------------------------------------------------------------------------------
💸💸💸💸💸💸
👇 👇 👇 👇 👇 👇

US BondsAfter true analysis on 30 Oct 22 that published on my Twitter account now see the Update.
I think the correction will continue to the first support zone of about 4.5%.

US10Y: IS THIS THE TOP FOR YIELDS?Using the fib retracement from our last previous cycle high, we can see yields have rallied to our 1.618 level, potentially signifying a top in yields may have been reached
We also have a triple bearish divergence on the monthly RSI almost creating this rounded top / head & shoulders pattern, signifying bonds could rally significantly with stocks if this is truly confirmed to be the top
shoutout to @JTheretohelp1 for mentioning this on X :)

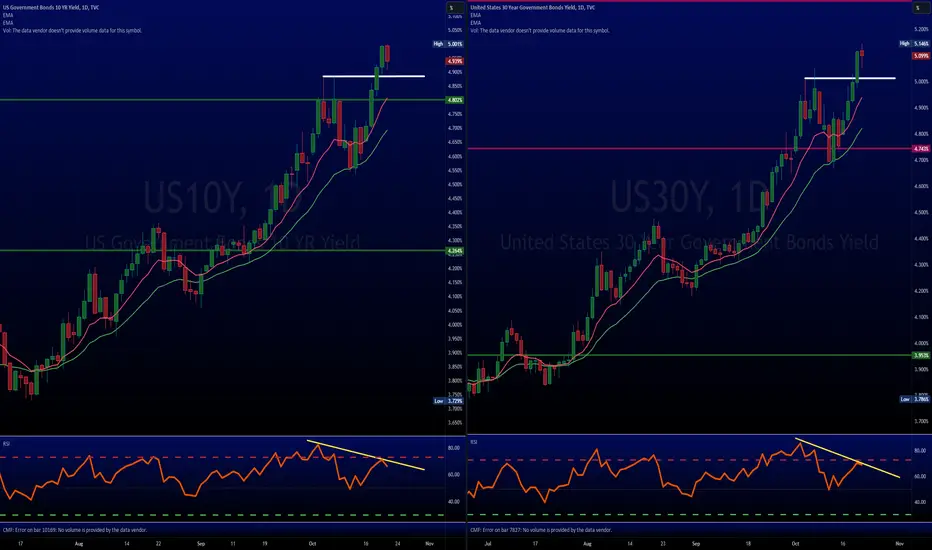
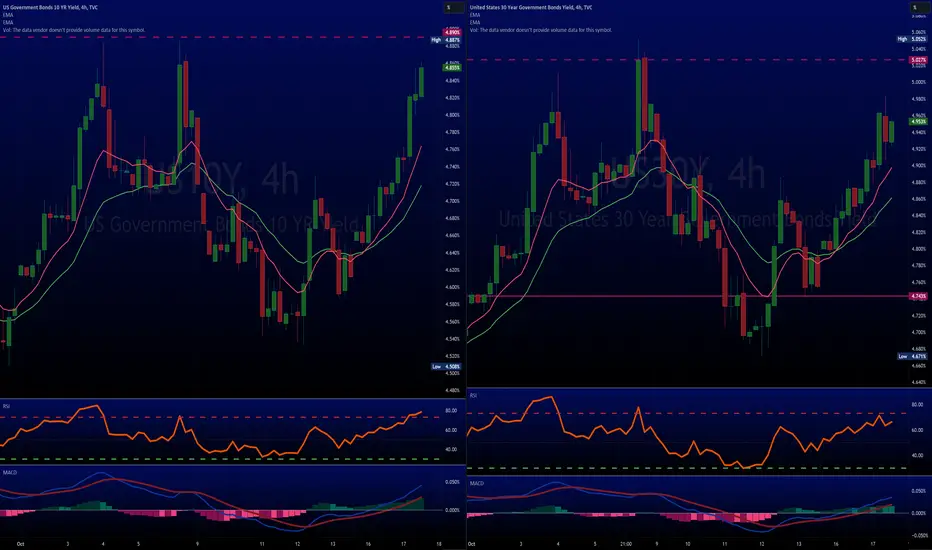
10Y & 30Y Yield losing more steamGOOD MORNING!
#interestrates look like they want to slow down a bit, short term top.
We see the 10Y & 30Y pulling back a bit...
But this is better seen intraday.
We'll see how that unfolds...
IF IT DOES, it could cause a sharp rise in #Stocks.
Coincidentally, DJ:DJI @ support & TVC:NDQ is near a major support.
TVC:TNX AMEX:DIA NASDAQ:QQQ
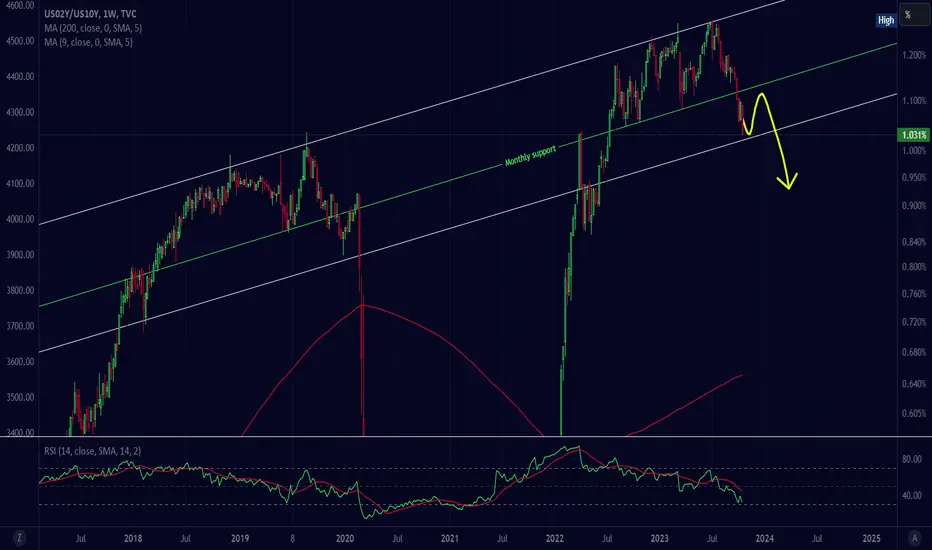
The bear steepener and when we will get our scripted eventWatch this curve because the market always knows, and the market isn't as free as many think. Gives us a sign when the true risk off kicks in. Might be due for a short relief soon, and then it starts. A potential bounce area is market as white, might not match and steepen now, but the breadth indicates that more likely than not we will get it in a matter of weeks now since we've technically broke out from the pattern.
US 10 Year Treasury Bonds - TOP Call Coming! (For now) $TNXWhat Major Event will occur to force thirst for US and G20 Treasury Bonds? It's happening soon. I wish I had a crystal ball to say what will cause it, but it'll happen. We're almost there IMO 5.19-5.25% topline target - then I hope in whatever this Market or world event will force yields to go back down to 3.19-3.25% Before eventually continuing back up in the next major World event to create Inflation AKA Wave 2 Inflation

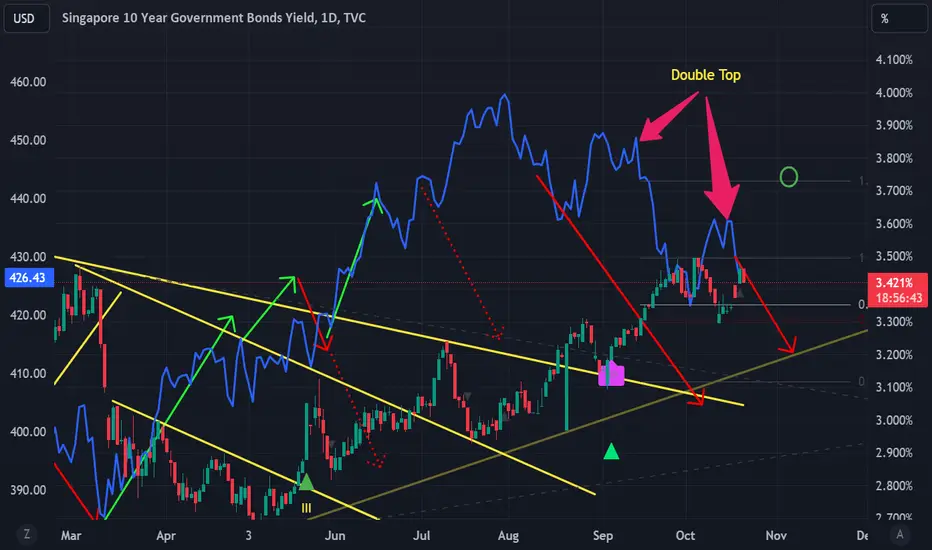
SG10Y Govt Bond and SPY relationship Part VIII - Here the bear!Back to this set of chart overlay...
So, it is where it isand the SG10Y Govt Bond yields are again rocketing. This is yet again to push the SPY further down. Combine this with the double top seen recently; probabilities stack up for more downside into November.
An important chart you aren't aware ofThe calculation of the US10Y - US02Y has commonly been used to measure the yield curve inversion. Historically, when the curve inverts and then inverts back, it has led to a significant recessionary period globally.
And I know this information might be hard to understand for attention-deficient people like zoomers, so I included some helpful meme labels for them to understand.

US 30yr yieldsUpdate on US long end rates view. YCC or not this is what I think could happen over next 2 years. When I was on the fixed income trading desk at Lehman in '88 we had short end paper that yielded double digits....and given the amount of fiat being printed this could be just the start of the back up in yields

Still a secular bull market for yieldsHate to disappoint you fixed income bulls
We are in the early stages of a secular bull market for yields (started 2020) as inflation will prove persistently bad
There may be pullbacks along the way but the path is higher
Long bond yield>10>50>200 ma

10yr technical breakoutUS10yr is attempting a technical breakout. I never thought FedFunds would expand meaningfully beyond 3.5%, simply because the US Treasury could not handle rates that high. There is a major disconnect in IG/HY credit spreads. Duration is absolutely not reflecting the premium it should require. Everyone seems oblivious to the incoming pain, especially the US Treasury Secretary. See her on TV gushing over the “strong economy”. When asked about debt issuance she grins and says she isn’t worried at all. There will be buyers.. I would ask for how much longer at these rates. Price down yield up

WHY RISING YIELDS ARE PROBLEMATIC FOR SP500Have you ever wondered why on Earth equity traders cannot take their eyes off from US10Y chart?
The answer is the alternative trade. What does that mean?
When you invest in a company, such as buying its stock, you are taking risk. However, US10Y are riskless. This means every time you take a risk, you have to look at what the other less risky investments promise in returns.
This is why US10Y matters. As it rises, it puts lots of question and uncomfortable thoughts into investors mind. Should the investor take risk and buy the stock hopefully earning 10% or should just invest in US Treasury bonds and receive a yummy fat coupons?
That is why US10Y matters a lot and it is telling us that the 2024 holds volatile for assets.
-Signalwyse Team
30 & 10yr yield short term analysisThe 30 yr #yield Is having a hard time in this area.
We're seeing a severe negative divergence, RSI is losing steam
The 10Yr yield went higher today but it's pulling back a bit, at the moment at least.
It's also shows RSI losing steam.
#Stocks are not doing so bad all things considered.
Will higher rates be the norm again?
TVC:TNX

2 Year Treasury Yield Topped2 Year Yield will be the first to go down when the Fed starts cutting rates.
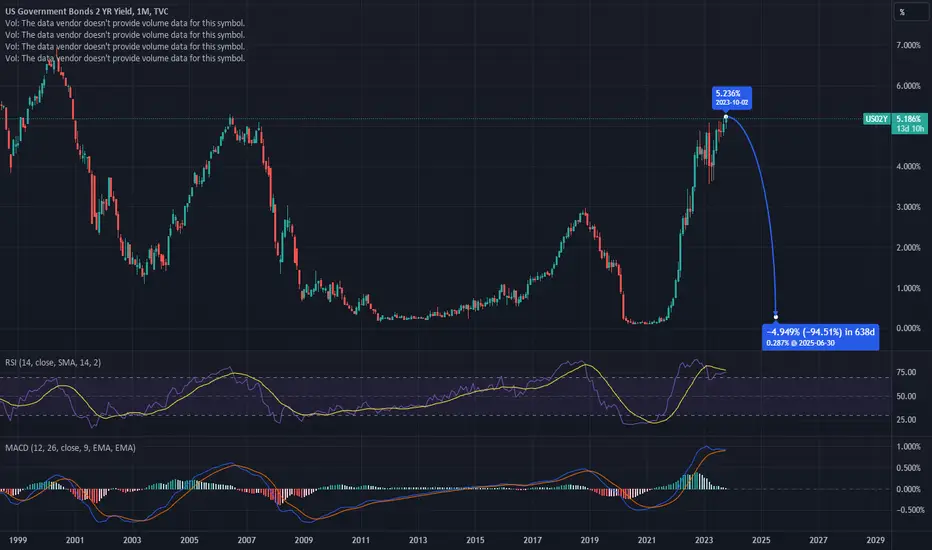
2 Year Yield On the EdgeThe US Treasury bond 2 year yield is at a level last seen in May 2006. In July 2022 the yield broke out of what was a long term down trend since 1989. Now we can see what happens next. Will the rates breakout above this level? If they do then that could indicate a real trend shift.

US Treasury Yields Surge: Impact on Brazilian Markets📈🇺🇸 ON THE RISE! The 10-year Treasury bond yield surged by 15 basis points in a single day, reaching 4.85%, the highest level since 2007. The 2-year Treasury bond yields also climbed to 5.21% (+12 basis points), approaching levels not seen since 2006.
This increase followed a surprising boost in retail sales last month, raising speculation that the Federal Reserve (FED) might raise interest rates again. Despite the FED's expectation of another rate hike later this year, several policymakers have indicated in recent weeks that they do not believe further rate hikes are necessary.
This implies that Americans are likely to continue paying more for their mortgages, credit card balances, and bank loans, potentially curbing demand for goods and services as uncertainty grows.
The rise in interest rates in the United States has a significant impact on the Brazilian stock market, exerting negative pressure on the markets. The increase in U.S. rates can lead to a phenomenon known as "risk flight," where foreign investors seek refuge in U.S. Treasury bonds, considered a safe haven in times of financial turbulence.
This investor migration towards U.S. Treasury bonds may result in capital outflows from the Brazilian stock market, pushing down stock prices and generating volatility. "Brazilian risk" becomes a concern, as economic and political uncertainty in the country may prompt investors to reallocate their resources into safer assets, such as U.S. Treasury bonds.
Therefore, it is crucial to closely monitor the relationship between U.S. interest rates and the behavior of financial markets in Brazil, as these events have significant implications for our investments and the economy. #Finance #Economy #Markets #FinancialMarkets #BrazilianRisk #Investments 💹🇧🇷🇺🇸💼💰

Long Term Yields catching a bidGood Afternoon!
Long Term #interestrates are PUMPING today!!!
The 10 & 30 Yr have been struggling in this area.
They are currently forming a negative divergence. We'll see how that goes.
3Month - 1Yr haven't moved much.
2Year #yield is also moving. This is "good"! That means that the normalization of yield curve is not happening yet.
#stocks #gold #silver
possible cup and handle on 10 year things are getting fast, i think we consolidate shorterm in this bullish wedge then continue breaking on to new highs, the way the news has been its anyones guess what happens next