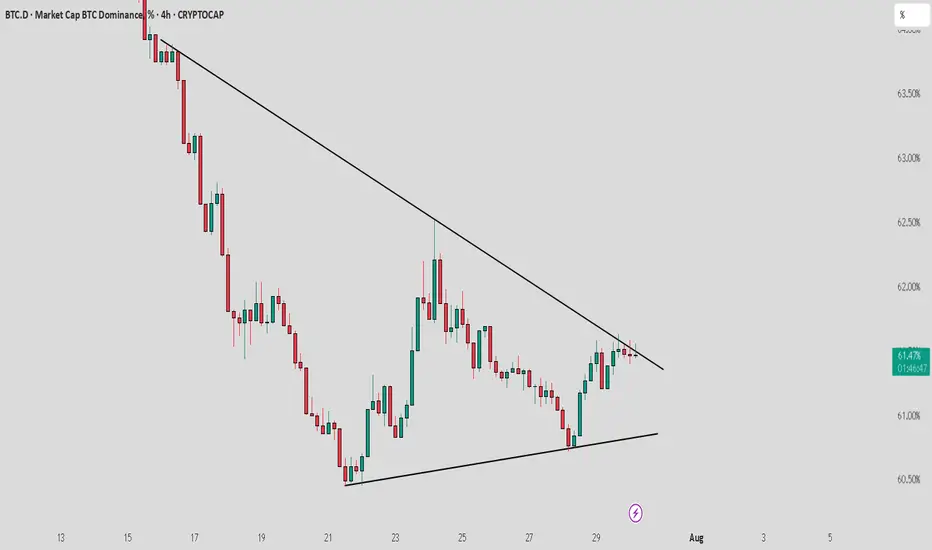
BTCDOM : Near to breakout from trendline resistanceBitcoin dominance is nearing a breakout from trend line resistance. Keep a close watch as a breakout from here could lead to a short-term market correction, negatively affecting altcoins. Stay cautious with your long positions and use proper stop loss strategies.
KEEP A CLOSE WATCH ON IT
Crypto market
XRPUSD 4 Hour BottomXRP has broken out of the weekly wedge leaving a long weekly candle stick close. Price has pulled back indicating it it ready for the next leg higher. Daily candle closed bullish and 4 hour time from has double bottom.

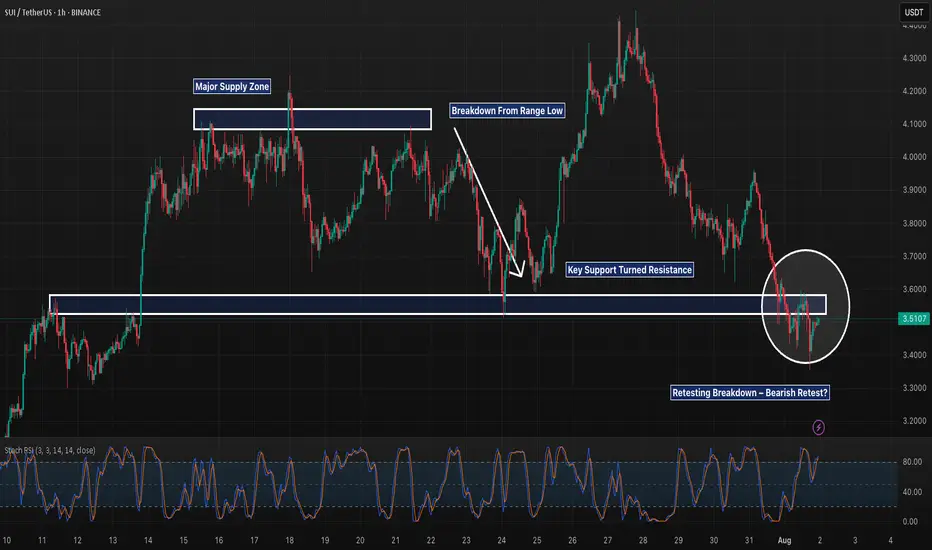
SUI 1H – Breakdown & Retest of Key Support, But Will It Reject?SUI 1H – Breakdown & Retest of Key Support, But Will It Reject or Reclaim?
Description:
SUI just completed a textbook range breakdown after weeks of sideways chop between ~$3.60–$4.10. The prior support floor has now flipped into resistance, and the recent bounce appears to be retesting that structure. If this retest gets rejected, continuation toward lower support zones (potentially $3.30 and below) becomes likely.
However, reclaiming and holding above $3.60 could trap late shorts and fuel a squeeze. Structure still favors bears for now, but it’s decision time.
📌 Breakdown structure
📌 Bearish retest
📌 Eyes on confirmation or invalidation
This is the battle zone — stay sharp.
RNDR/USDT at a Critical Turning Point: Golden Pocket as the Key?✨ Overview:
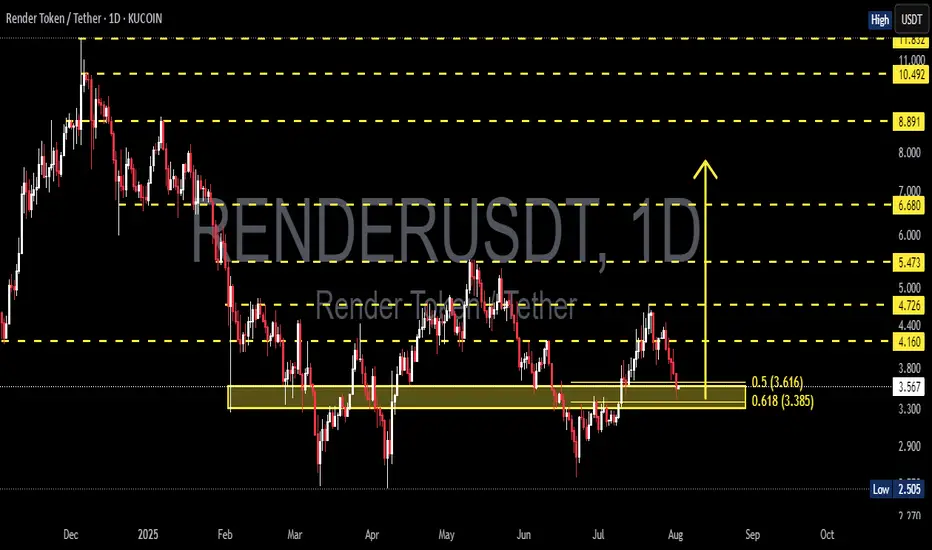
Render Token (RNDR) is currently testing a crucial support zone — the Golden Pocket Fibonacci Retracement between 0.5 (3.616) and 0.618 (3.385). This zone not only represents a significant retracement level but has historically acted as a strong demand area, often serving as a springboard for major price reversals.
---
🧠 Detailed Technical Analysis:
🔸 Support Zone & Golden Pocket
Price has retraced back to the 0.5 – 0.618 Fibonacci zone, a high-probability reversal area.
This zone has acted as a demand base multiple times since February 2025.
How the price reacts here will likely define the next major trend direction.
🔸 Market Structure
The overall structure shows a mid-term downtrend, marked by lower highs and lower lows.
However, the current price action shows slowing bearish momentum, indicating potential hidden accumulation.
A potential double bottom pattern could be forming, hinting at a bullish reversal if confirmed.
---
📈 Bullish Scenario:
1. Strong Rebound from the Golden Pocket
Watch for bullish candlestick patterns (e.g., pin bar, bullish engulfing) near $3.38–$3.61.
Initial resistance levels: $4.16 – $4.72
If broken, mid-term targets could extend to $5.47 – $6.68
2. Double Bottom Confirmation
A confirmed double bottom with a neckline breakout around $4.16 would greatly strengthen bullish momentum.
3. Increased Buying Volume
A spike in volume during the rebound would validate bullish sentiment and potential trend reversal.
---
📉 Bearish Scenario:
1. Breakdown Below the Golden Pocket
If the price breaks below $3.385 with strong volume, we could see a move down toward $2.77, the next significant support.
2. Weak Bounce / Lower High
A failed breakout above $4.16 may indicate a bearish continuation after a temporary relief rally.
---
📌 Summary:
RNDR is currently at a technically sensitive zone. The Golden Pocket between $3.38 and $3.61 is the key area to watch. A strong bullish reaction could signal the start of a trend reversal, while a breakdown could trigger further downside continuation. Traders are advised to wait for clear confirmation via price action before committing to any strong positions.
---
🔖 Key Levels to Watch:
Level Description
3.38 – 3.61 Golden Pocket (Potential Buy Zone)
4.16 Minor Resistance
4.72 Bullish Breakout Trigger
5.47 – 6.68 Mid-Term Reversal Targets
2.77 Strong Support if Breakdown Occurs
---
🧩 Chart Patterns Observed:
Potential Double Bottom – early bullish reversal signal.
Golden Pocket Reaction Setup
Descending Structure – still intact but weakening.
---
🔍 Trade Ideas:
🔄 Wait-and-see approach: Wait for clear bullish confirmation on daily candles.
🎯 Aggressive Long Entry: Around 3.40–3.60 with a tight stop-loss.
⚠️ Short Opportunity: If a strong breakdown below 3.38 occurs with volume confirmation.
#RNDR #RenderToken #RNDRUSDT #CryptoAnalysis #GoldenPocket #FibonacciRetracement #DoubleBottom #PriceAction #SupportResistance #AltcoinSetup #CryptoSignals #TechnicalAnalysis
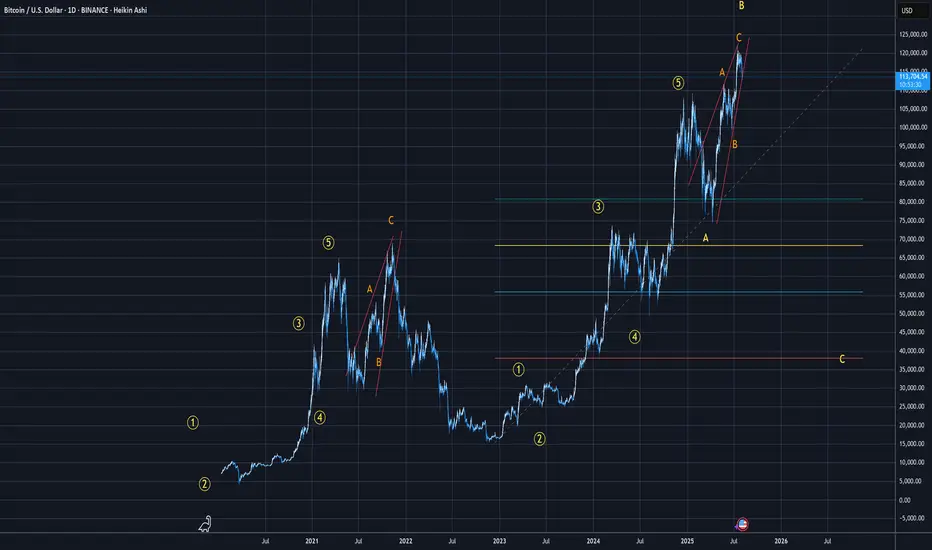
BTC Daily Elliott Wave CountAs mentioned in my analysis on youtube post on Total Market Cap short-term, the daily bullish case is now verified, canceling the bearish case with a break through the daily bearish invalidation level.
This past week price action suggests a move towards the completion of a blue wave x. Make sure to check out my latest analysis on short-term Crypto Total Market Cap.
The link to the chart:
Bullish Count

BTC | Swing Plan UpdatePrice failed to break out above 1D supply and sharply rejected, losing key 4H demand at $117,300.
HTF demand at $109,000 (1D FVG + BOS + S/R) is the next major area of interest—this is where I’ll look for fresh swing setups if the market flushes further.
No need to rush new positions until a clean setup prints or levels are reclaimed.
Plan:
Wait for price to test $109,000 zone before considering a swing long.
Only consider LTF scalp longs if we reclaim the 4H BOS at $118,300.
Stay flat until high-probability entry, let the market show its hand.

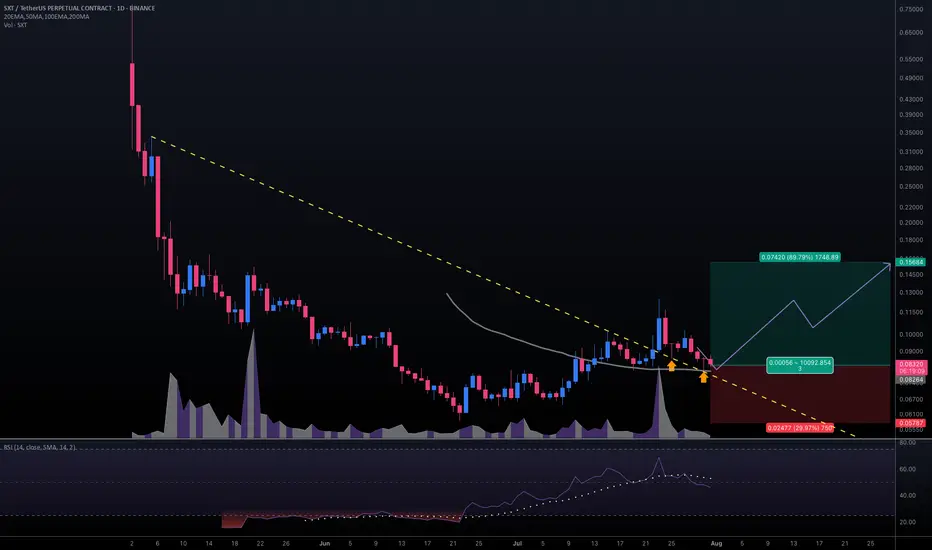
#SXTUSDT #1D (Binance Futures) Descending trendline break retestSpace and Time (SXT) pulled back to 50MA daily support, looks ready for mid-term recovery after those two dragonfly dojis in a row.
⚡️⚡️ #SXT/USDT ⚡️⚡️
Exchanges: Binance Futures
Signal Type: Regular (Long)
Leverage: Isolated (2.0X)
Amount: 5.0%
Entry Targets:
1) 0.08264
Take-Profit Targets:
1) 0.15684
Stop Targets:
1) 0.05787
Published By: @Zblaba
NYSE:SXT BINANCE:SXTUSDT.P #1D #SpaceAndTime #ZK #AI #DPoS spaceandtime.io
Risk/Reward= 1:3.0
Expected Profit= +179.6%
Possible Loss= -59.9%
Estimated Gaintime= 1 month
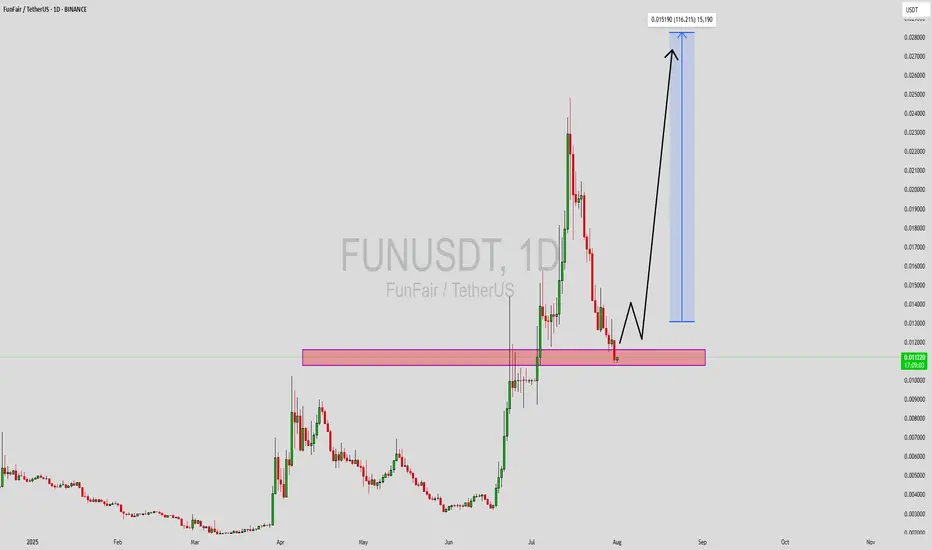
FUNUSDT Forming Bullish ReversalFUNUSDT is currently forming a bullish reversal pattern, signaling a potential shift in market momentum after a prolonged consolidation. This pattern, combined with a steady increase in trading volume, suggests growing investor interest and the possibility of an upcoming trend reversal. The structure aligns well with historical price action, where FUN has previously bounced from similar technical setups, making this an attractive chart for swing traders and medium-term investors.
The volume profile shows accumulation behavior, typically seen before major breakouts. This reflects the confidence of larger market participants entering at lower levels. If FUNUSDT confirms the breakout above resistance zones, the next leg up could lead to a potential price surge of 140% to 150% from current levels. Given its relatively low market cap and recent technical developments, the upside potential remains significant if momentum sustains.
What adds to the bullish thesis is the overall pattern integrity supported by clear trendline reactions and support zone validation. FUN has also maintained a healthy base formation, which often precedes explosive upward moves. A close above key resistance with volume confirmation would likely attract more traders and potentially push FUN into price discovery territory.
Keep this altcoin on your watchlist as it presents a high-reward setup supported by solid technical foundations and increasing trader sentiment.
✅ Show your support by hitting the like button and
✅ Leaving a comment below! (What is You opinion about this Coin)
Your feedback and engagement keep me inspired to share more insightful market analysis with you!
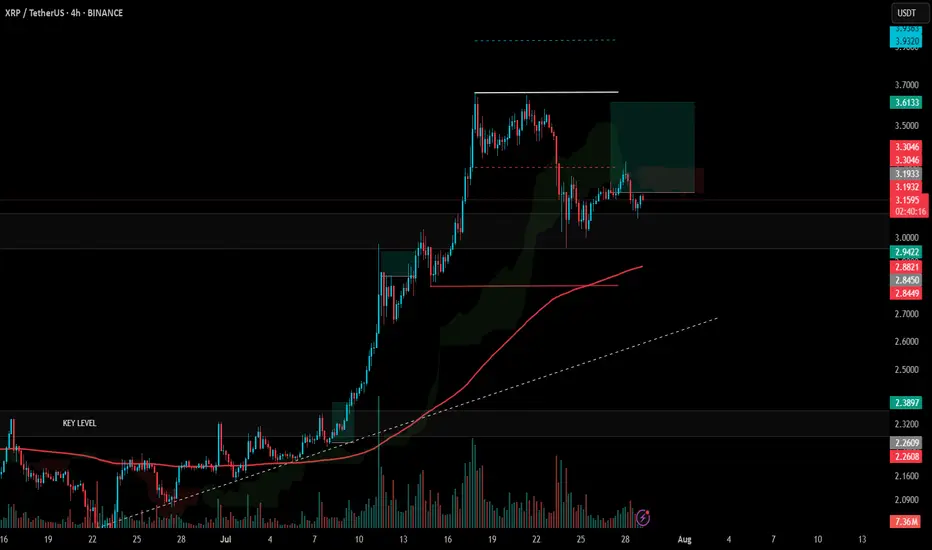
#XRP Update #5 – July 29, 2025#XRP Update #5 – July 29, 2025
The long position we opened two days ago is still active, and as I mentioned earlier, I’m not planning to use a stop. In the previous trade, we took profit with 30% of our capital at the $3.33 level. Although there has been a pullback, I’m still holding the position. I have no intention of placing a stop and will continue by averaging down if necessary.
Currently, XRP has reacted from the K-Level zone. Its target is the $3.93 level, but the first major resistance it needs to break is at $3.66. I’m continuing to hold the position for now.
The next levels for Solana coinIn this video I recap the previous video and discuss what may be next after the current retracement .
I reveal some important levels that sit below as well as the relationship with the Eth/Btc chart.
Tools used vwap, Fibs and volume profile .

HYPE/USDT: "A++" Long Setup - A Perfect Storm of ConfluenceHello traders,
This analysis covers what I consider to be an "A++" high-probability long setup on HYPE/USDT, viewed on the 9H timeframe. It is rare to see this many powerful technical factors align at once, signaling a potential major bottom and the start of a new bullish leg.
1. Trend & Context (The "Why")
The price has pulled back into a critical zone where a confluence of price, time, and momentum indicators are all screaming bullish.
Here is the checklist of the extraordinary confluences:
1. Price Action (LSOB Demand): The primary signal comes from price action. The price has entered a major Bullish LSOB (Liquidity Sweep Order Block) on the 9H chart. This is a critical institutional demand zone where we expect strong buying interest.
2. Time-Based Confluence (Fibonacci Cycle): This is a unique and powerful confirmation. The potential reversal is occurring precisely on a 144 Fibonacci Time Cycle line. When a key price level aligns with a major time cycle, the probability of a significant market turning point increases dramatically.
3. Dynamic Support : The LSOB zone is also confluent with the EMA 200, adding another layer of strong dynamic support to this area.
4. Momentum Exhaustion (MC Orderflow): The momentum oscillator provides the final, undeniable confirmation:
The MC Orderflow itself is in the OVERSOLD zone on this 9H timeframe.
THE CRITICAL CONFLUENCE: The Multi-Timeframe Cycle Table shows that the 4H and Daily timeframes are BOTH "Oversold". This trifecta of oversold signals (4H, 9H, and Daily) is the highest level of momentum confirmation we can get.
2. Entry, Stop Loss, and Targets (The "How")
This powerful alignment provides a very clear trade plan with an exceptional risk-to-reward ratio.
Entry: An entry at the current price level ($38.50 - $39.30) is ideal, as it is directly within the LSOB demand zone.
Stop Loss (SL): $37.50. This places the stop loss safely below the entire LSOB zone and the recent swing low. A break below this level would invalidate this entire bullish structure.
Take Profit (TP) Targets:
TP1: $42.50 (Targeting the cluster of short-term EMAs, which will act as the first resistance).
TP2: $45.00 (The bottom of the Bearish LSOB supply zone, a major magnet for price).
TP3: $49.90 (The major swing high of the range, for a full trend continuation).
Conclusion
This is one of the highest-quality setups I've seen. The perfect alignment of a key price level (LSOB), a major time cycle (Fib 144), and multi-timeframe momentum exhaustion (4H & Daily Oversold) creates a textbook, high-conviction environment for a significant bullish move.
Disclaimer: This is not financial advice. This analysis is for educational purposes only. Always conduct your own research and manage your risk appropriately.

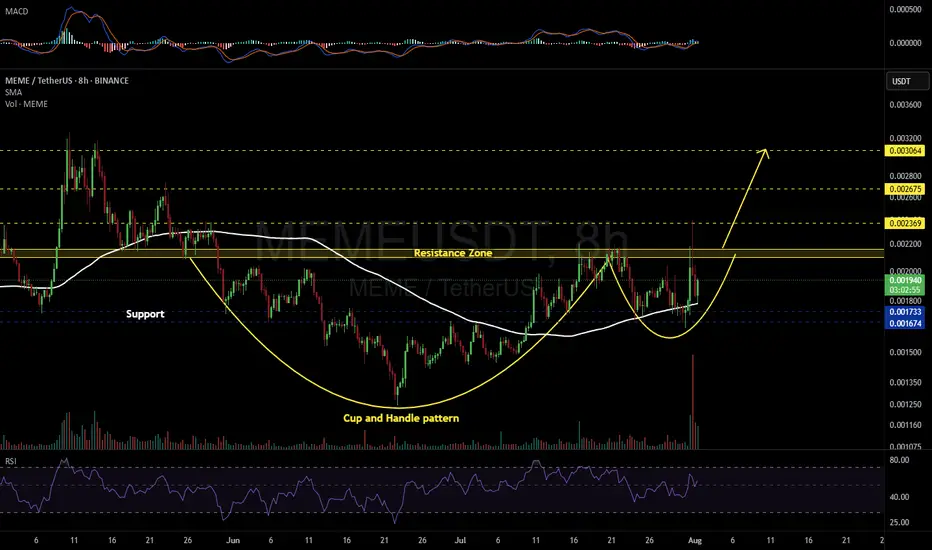
MEMEUSDT 8H#MEME has formed a Cup and Handle pattern on the 8H timeframe. It has bounced nicely off the SMA100, and volume is showing signs of strong accumulation.
📌 Consider entering this coin only after a solid breakout above the resistance zone.
If the breakout occurs, the potential targets are:
🎯 $0.002369
🎯 $0.002675
🎯 $0.003064
⚠️ As always, use a tight stop-loss and apply proper risk management.
Solana above the $160 level ┆ HolderStatBINANCE:SOLUSDT is retracing toward the $160 support after failing to hold above $190. Price previously broke out from a falling channel and may find support at $160 again, where multiple reversals have occurred. A bounce here could fuel a move to $200.

ETH/USD Double Bottom with Bullish RSI Divergence 1HETH/USD has formed a double bottom pattern on the 1 -hour timeframe , signaling a potential bullish reversal after recent downside pressure. The pattern is supported by a bullish RSI divergence, where price made lower lows but RSI printed higher lows — indicating a momentum shift.
A buy stop entry is placed just above the neckline, targeting a continuation toward key resistance zones.
Trade Setup
Buy Stop Entry: 3539.52 (on confirmed neckline breakout)
Stop Loss: 3424.13 (below second bottom – invalidation level)
Take Profit 1: 3658.19
Take Profit 2: 3774.71

CAKEThis idea is best for person that control risk management.
entry: 2.535
sl: 2.450
tp: 2.700 - 2.900 - 3.080

Eliot ABC correctionThe theory maintains that markets move in repetitive fractal patterns, where each complete cycle consists of eight waves: five in the direction of the main trend (impulsive) and three in the opposite direction (corrective). Wave C, being the last component of the ABC correction, offers opportunities to enter positions favorable to the resumption of the major trend.
LTC/USDT Robbery Underway | Bullish Setup, Get In Now!🔥💎 LTC/USDT HEIST PLAN: ROB AT ANY PRICE! 💎🔥
🚨 Bullish Move Incoming | Layered Entries | Thief Trader Exclusive 🚨
🌟Hi! Hola! Ola! Bonjour! Hallo! Marhaba!🌟
Dear Money Makers & Market Robbers, 🤑💰💸✈️
The time has come for another high-stakes Thief Trading heist, and this time we're lockin' in on LTC/USDT – aka "Litecoin vs Tether" 💣💸
🎯 Thief’s Mission Plan: BULLISH AT ANY PRICE LEVEL!
We're going full stealth mode with a layering strategy — stacking multiple limit orders like a true pro thief preparing for a clean escape! 🔪📉📈
🚪 ENTRY: "Anywhere, Anytime" 🚪
📈 Buy from any price level — but for optimal entry:
🟢 Use Buy Limit orders near recent lows (15-30 min TF)
🔔 Don’t forget to set alerts for breakout confirmation!
🛑 STOP LOSS: Strategic Defense 🛑
🗣️ "Listen up, team! Stop loss ain’t a maybe — it’s your armor. Place it smart, or prepare for pain." 🔥
📍Recommended SL: 100.00
🔐 Adjust based on your lot size & how deep you stack your orders.
🏁 TARGET: 130.00 🏁
💸 But always Escape Early if the plan gets too hot!
Use a Trailing SL to lock in gains and slip out clean 😎🧨
🧠 PRO TIPS from the THIEF:
🔎 Only Buy. No Shorting!
💣 Scalpers: Jump in with the trend, not against it.
🧲 Swing Traders: Stay patient, and execute the full heist.
🚀 Use Trailing Stops – Let profit ride, but stay protected!
📢 MARKET INSIGHT:
🔥 Bullish Bias backed by:
✅ On-Chain Metrics
✅ Sentiment Shifts
✅ Macro Flows
✅ COT Reports
✅ Intermarket Divergence
⚠️ TRADING ALERT: Stay Sharp!
📰 News Events = Volatility.
💡 Avoid fresh entries during high-impact events.
📉 Use Trailing SL to secure your running trades.
💖 SUPPORT THE CREW 💖
🚀 Smash that Boost Button if you believe in the Thief Style Strategy
👑 Let's rob the market together, one level at a time.
🧠 Stay sharp, stay sneaky – and I’ll see you at the next target 🎯
— Thief Trader 🐱👤💰🚁🌍

#LINK/USDT targeting 17.77 $ ?#LINK
The price is moving within a descending channel on the 1-hour frame and is expected to break and continue upward.
We have a trend to stabilize above the 100 moving average once again.
We have a downtrend on the RSI indicator that supports the upward break.
We have a support area at the lower boundary of the channel at 15.60, acting as strong support from which the price can rebound.
We have a major support area in green that pushed the price higher at 15.30.
Entry price: 15.84
First target: 16.47
Second target: 17.00
Third target: 17.77
To manage risk, don't forget stop loss and capital management.
When you reach the first target, save some profits and then change the stop order to an entry order.
For inquiries, please comment.
Thank you.

Ethereum Breakdown Imminent: Bearish Triple Tops confirmedEthereum has fired off multiple bearish signals that traders and investors cannot ignore. A confirmed triple top on the daily chart suggests exhaustion at resistance, while the appearance of a hanging man candlestick pattern adds weight to the reversal thesis.
The daily RSI has confirmed a bearish divergence, and the MACD has officially crossed below the zero line—marking a shift in momentum and confirming bearish control.
In this video, I’ll break down:
• The triple top formation and its implications
• Why the 200 EMA is the next major support target
• The significance of RSI and MACD confirmations
• What traders should watch for in the coming sessions
This isn’t just noise—Ethereum’s technicals are flashing red. Make sure you’re prepared.

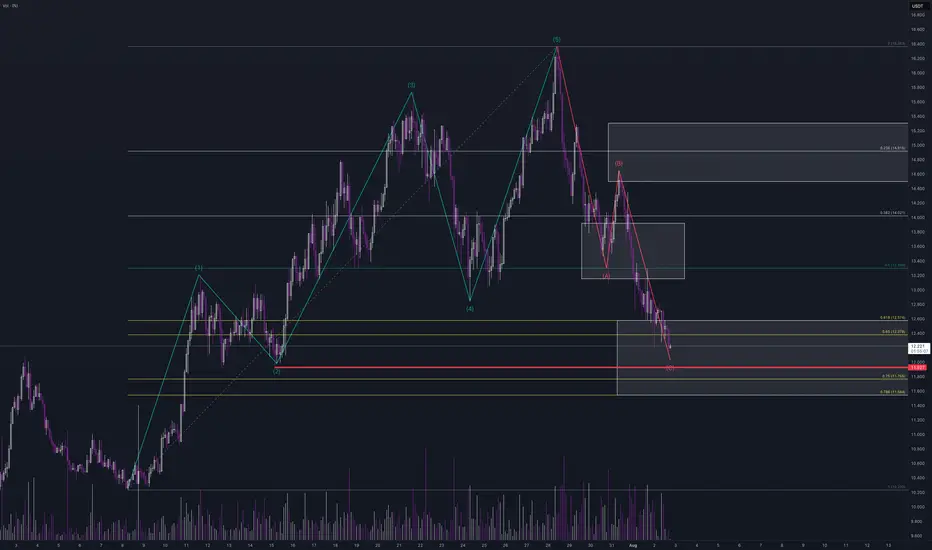
is BTC dead again ?I was really bullish until wave 4 didnt really bounce between the 38 and 50
suddenly very bearish
SUSHI LONG TERM POSITIONGoing to be entering at the .618 Fib level (Golden Pocket) for a long position.
ETH has been pumping, this money will start rotating soon enough and i'm betting sushi swap will get a nice pump in the upcoming weeks...

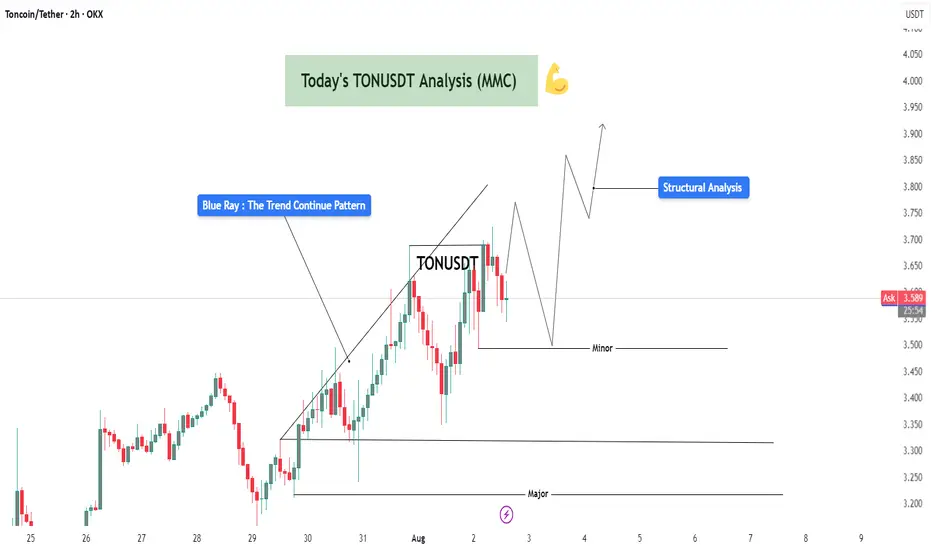
TONUSDT Bullish Structure Continuation – Minor Pullback Leg Up🧾 1. Overview of the Chart Setup:
The current TONUSDT (Toncoin/USDT) 2-hour chart exhibits a strong bullish market structure, characterized by a clear sequence of higher highs and higher lows. This confirms bullish momentum and suggests that the market is in a well-established uptrend.
The key highlight here is the "Blue Ray – Trend Continuation Pattern", which signals sustained bullish pressure following a clean breakout. This breakout was preceded by a consolidation phase, indicating accumulation by smart money before the expansion move.
🔍 2. Technical Structure and Pattern Breakdown:
🔵 Blue Ray – Trend Continuation Pattern:
This diagonal support trendline captured the initial breakout after the market bottomed near July 29–30.
Price respected this ascending line multiple times before accelerating, confirming bullish control.
Once the price broke above the previous swing high, it completed the pattern and triggered a momentum-driven rally.
🔲 Structural Zones – Major and Minor:
Minor Support Zone (~3.50 USDT):
Currently acting as short-term demand.
Price is showing early signs of rejection here, suggesting bulls may reload for a second impulsive move.
If this zone holds, we expect a new higher high to form, potentially targeting 3.80–4.00+ USDT.
Major Support Zone (~3.20–3.25 USDT):
Acts as long-term bullish defense.
In case of deeper retracement or shakeout, this is the key level to watch for possible trend continuation and re-entry.
📈 3. Structural Analysis and Price Projection:
The projected path on the chart shows a classic price action structure:
Impulse
Correction (toward minor support)
Next Impulse (break of recent high)
Higher low (continuation within trend channel)
Potential final push toward the 3.90–4.00 range
This type of Elliott Wave-inspired behavior suggests we're in wave 3 or 5 of a bullish sequence, with minor dips offering low-risk long setups.
📊 4. Candlestick & Market Behavior:
Recent candles show long lower wicks, suggesting buyers are stepping in during dips.
Bearish candles are relatively smaller and followed by immediate bullish response.
This indicates buy-the-dip sentiment, common in a trending market.
🔄 5. Trading Plan & Scenarios:
✅ Bullish Continuation (Base Case):
Wait for a clear bullish engulfing or price bounce at the minor support zone (~3.50 USDT).
Enter with confirmation: bullish candle close, volume spike, or trendline reaction.
Targets:
TP1: 3.80 USDT
TP2: 4.00–4.10 USDT
Stop Loss: Below 3.45 (or structure-based trailing stop)
⚠️ Bearish Case / Deeper Pullback:
If 3.50 fails, look for signs of accumulation around the major support (~3.20–3.25).
This zone can serve as the ultimate defense for trend continuation and provide a second long opportunity with better R:R.
🧠 6. Mindset for Traders:
Don’t chase: Let price come to your level, and focus on confirmation.
Trade with the trend: Structure supports bullish movement — trade in the direction of strength.
Use proper risk management: Define SL and TP before entering. Partial profits at key resistance zones are a smart strategy.
Avoid overtrading : Wait for structural retests or confirmation candles to stay on the right side of the market.
XLM Stellar - Previous video continuation, as forecasted.Not much to say. Just watch the forecast on previous video a few days back. Close to Fib now - no entries.
Video:
Enjoy!
