The key point to watch is whether it can rise to 3900.73-4107.80
Hello, traders. Nice to meet you.
If you "Follow," you'll always get the latest information quickly.
Have a great day.
-------------------------------------
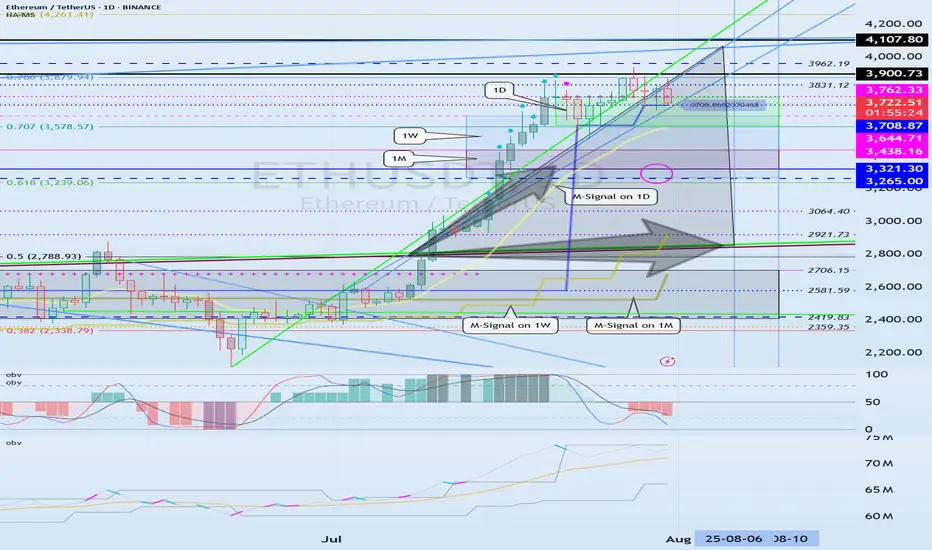
(ETHUSDT 1D Chart)
The upward trend continues, with the M-Signal on the 1D chart > M-Signal on the 1W chart > M-Signal on the 1M chart.
Therefore, if the price holds above 3265.0-3321.30, a medium- to long-term uptrend is likely.
Currently, the HA-High ~ DOM(60) range is formed across the 3265.0-3762.33 range on the 1M, 1W, and 1D charts.
Therefore, the key question is whether support is found within the 3265.0-3762.33 range.
-
While the price is trending upward along the short-term trendline, if it falls below the short-term trendline and encounters resistance by falling below the M-Signal indicator on the 1D chart, a decline to the 3265.0-3321.30 range is likely.
ETH's volatility period is expected to last from August 6th to 10th.
The key point to watch is whether it can rise above the 3900.73-4107.80 range after this volatility period.
-
Since the StochRSI indicator has entered an oversold zone, the downside is likely to be limited.
Since the OBV indicator of the Low Line ~ High Line channel remains OBV > OBVEMA, a significant decline is unlikely.
However, since the TC (Trend Check) indicator is below zero, selling pressure is dominant.
Therefore, a decline below 3708.87 could lead to further declines. However, as previously mentioned, the decline is likely to be limited, so a significant decline is not expected.
Once the M-Signal indicator on the 1D chart is encountered, the trend is expected to re-establish itself.
-
Thank you for reading to the end.
I wish you successful trading.
--------------------------------------------------
- This is an explanation of the big picture.
(3-year bull market, 1-year bear market pattern)
I will explain in more detail when the bear market begins.
------------------------------------------------------
Crypto market
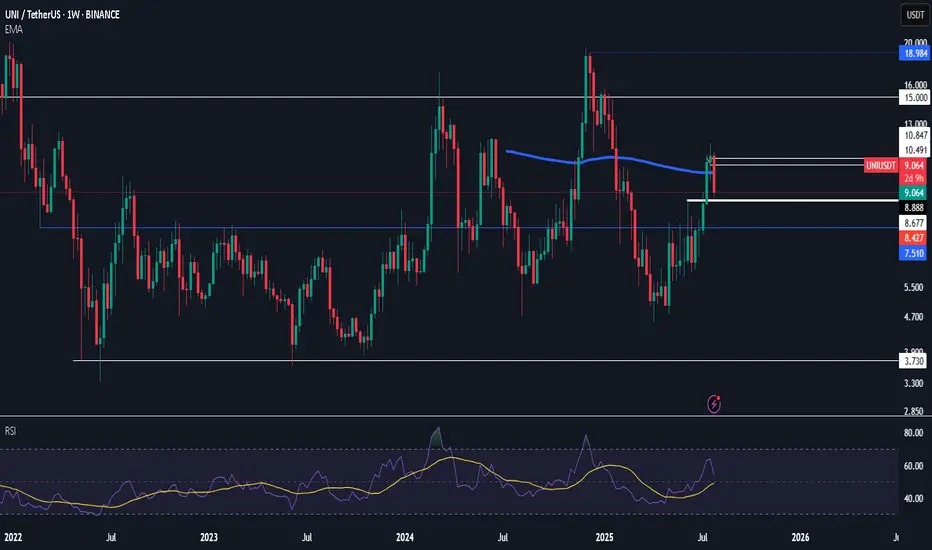
$uni stop a tad below white thick line
may or may not reverse this move by monday for now longing it and expecting dominance to roll over
Solana Bullish Wave 5 coming?solana has completed the 3rd impulsive wave and now the recent decline was not impulsive but corrective meaning wave 4 has almost completed now we can look for wave 5 tp and sl are on the chart

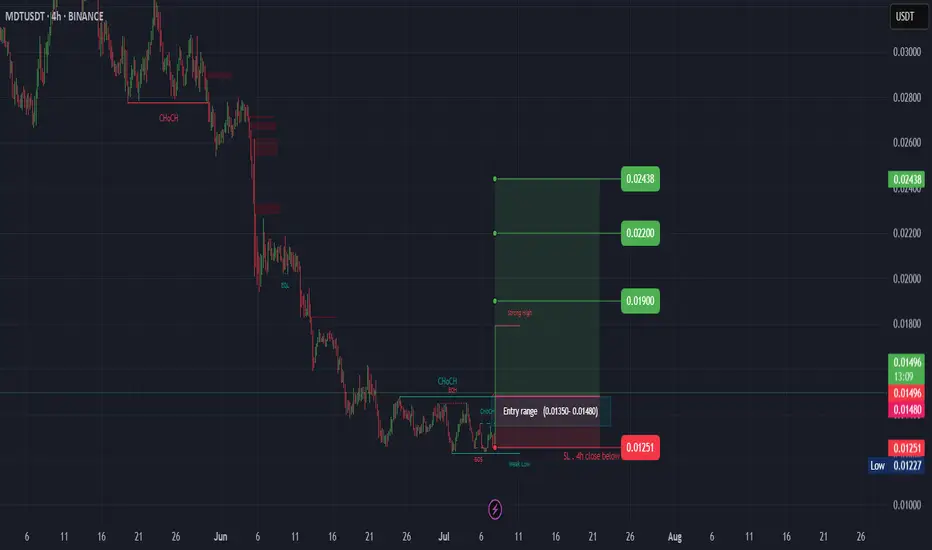
MDT (SPOT)BINANCE:MDTUSDT
#MDT/ USDT
Entry range (0.01350- 0.01480)
SL 4H close below 0.01251
T1 0.01900
T2 0.02200
T3 0.02438
_______________________________________________________
Golden Advices.
********************
* collect the coin slowly in the entry range.
* Please calculate your losses before the entry.
* Do not enter any trade you find it not suitable for you.
* No FOMO - No Rush , it is a long journey.
#MAGIC/USDT Falling Wedge + Fib Confluence #MAGIC
The price is moving within a descending channel on the 1-hour frame, adhering well to it, and is on its way to breaking strongly upwards and retesting it.
We have support from the lower boundary of the descending channel at 0.1620.
We have a downtrend on the RSI indicator that is about to be broken and retested, supporting the upside.
There is a major support area in green at 0.1662, which represents a strong basis for the upside.
Don't forget a simple thing: ease and capital.
When you reach the first target, save some money and then change your stop-loss order to an entry order.
For inquiries, please leave a comment.
We have a trend to hold above the 100 Moving Average.
Entry price: 0.1780.
First target: 0.1827.
Second target: 0.1905.
Third target: 0.1962.
Don't forget a simple thing: ease and capital.
When you reach your first target, save some money and then change your stop-loss order to an entry order.
For inquiries, please leave a comment.
Thank you.

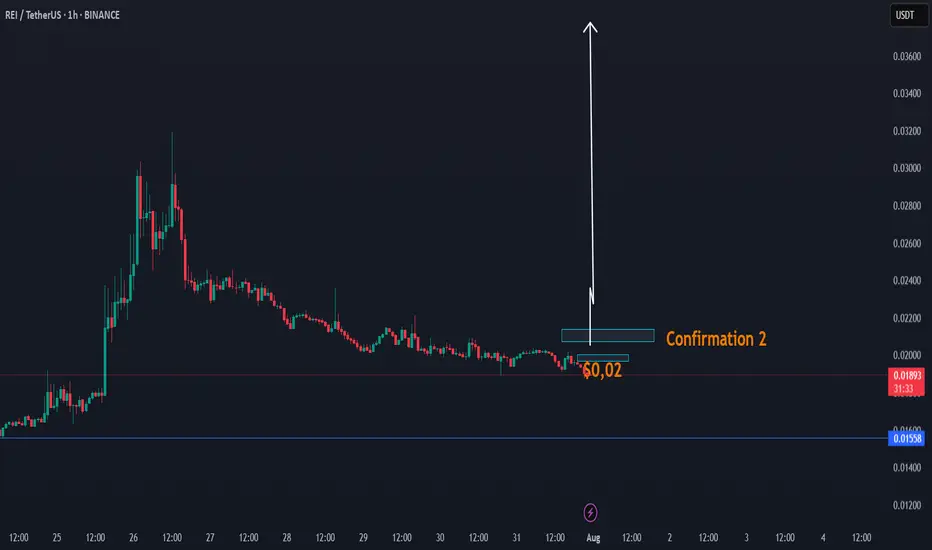
DAY UPDATE REI/USDT THE INCREASE CANDLE OF UP $0,03 - $0,05REI is an interesting coin since the update of Q4
We have seen that this coin was able to increase to $0,031 and until here $0,018 zone, a return to where we are now. There is a high chance that this coin can recover next 24H if this coin is able to confirm the confirmation $0,02 - $0,021
This coin, as before, was targeted at $ 0.02 and had low volume. We expect that if it comes back to $ 0.02, it will be confirmation of the volume, which can take the trend with a candle to up $0,03
REI CONFIRMATIONS ZONE
Higher time frame
When you look normally at this coin, then this coin is in a trend line of breakdown. This can change with the next confirmations. The question is, are we going to see again $0,02 the next 24h? If yes high chance of a break.
We also have a cycle update 2025, check it here, expecting $0,90
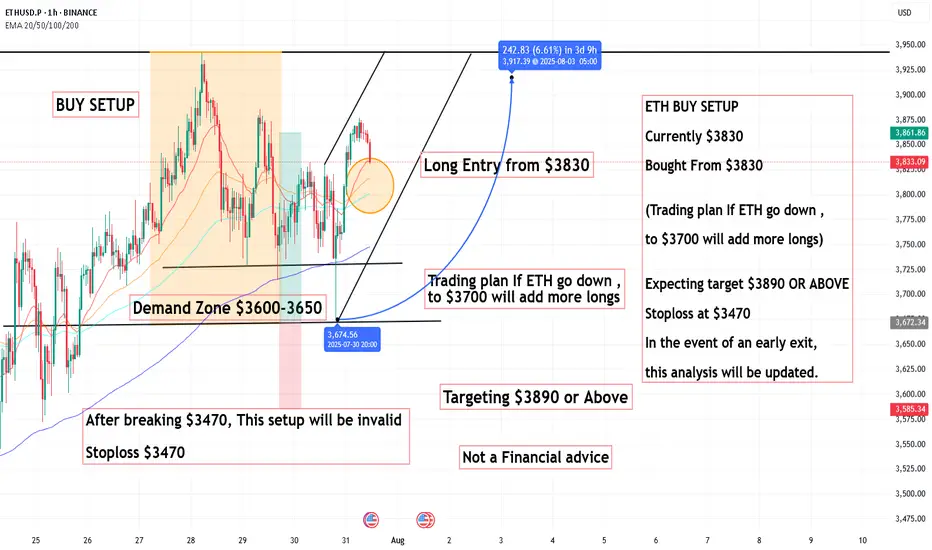
ETH BUY SETUP ,Bought From $3830ETH BUY SETUP
Currently $3830
Bought From $3830
(Trading plan If ETH go down ,
to $3700 will add more longs)
Expecting target $3890 OR ABOVE
Stoploss at $3470
In the event of an early exit,
this analysis will be updated.
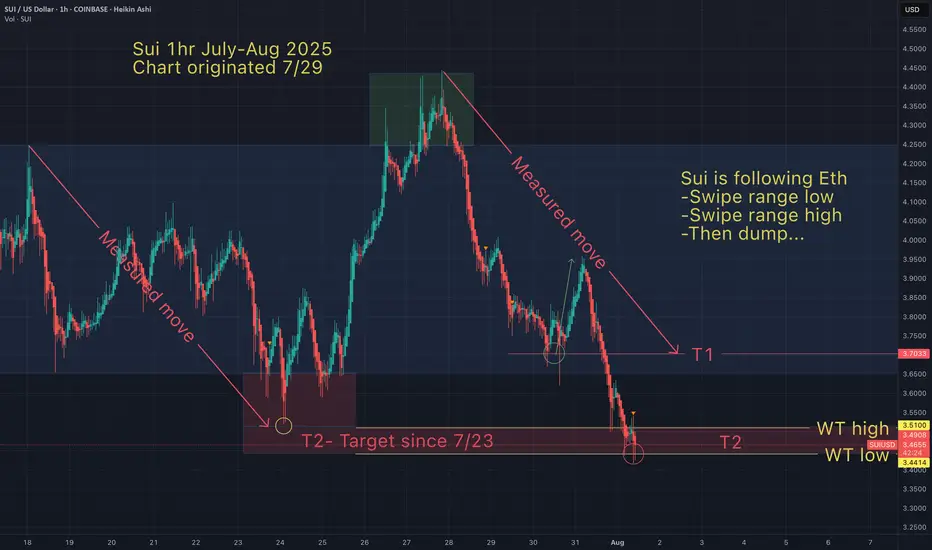
Sui - Target 2 just hit (alternate view)I love it when a plan comes together.
I hope my T3 doesn't hit (after this next bounce).
May the trends be with you.
Targets and their point in timewe use the threshold breaks to determine targets AKA areas of liquidity. we also utilize pattern detection paired with the threshold breaks to validate cycles and where we are in said cycle.

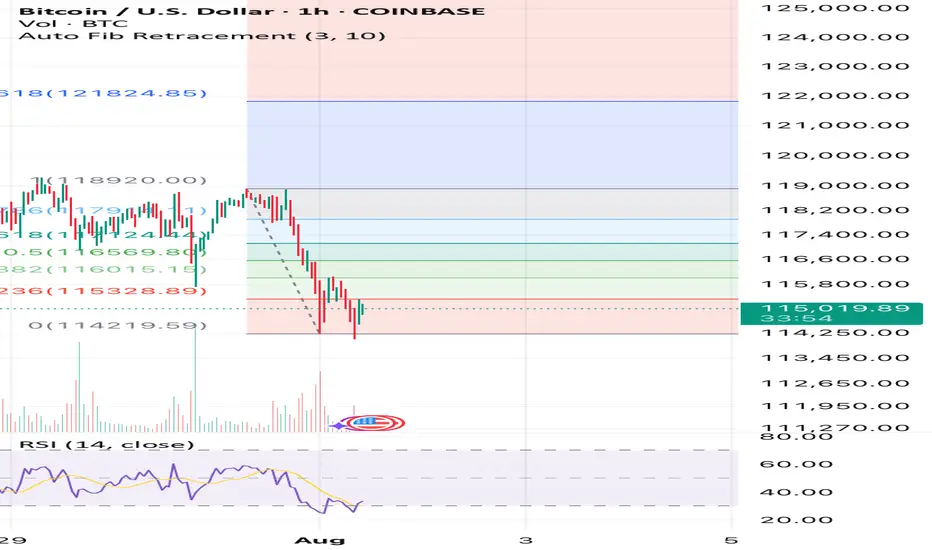
Bitcoin willIt hold if we stay above $115k ?? Fixing up last post I’ve deleted now as image was not good. Anyway simple RSI and Auto Fib Retrace with only general CRYPTOCAP:BTC market understanding backing this. This isn’t finacial advice at all. It’s pure speculation this post and anything related to it. I’m
Not a finacial advisor and I will not be held accountable for anyone’s actions that I didn’t do.

Xrp - The final bullish breakout!💰Xrp ( CRYPTO:XRPUSD ) will create new all time highs:
🔎Analysis summary:
After a consolidation of an incredible seven years, Xrp is finally about to create new all time highs. With this monthly candle of +40%, bulls are totally taking over control, which means that an altcoin season is likely to happen. And the major winner will simply be our lovely coin of Xrp.
📝Levels to watch:
$3.0
🙏🏻#LONGTERMVISION
SwingTraderPhil

BTC CAN HIT 125K AFTER SHORT CORRECTIONHello friends, Bitcoin has made an incredible climb, carefully looking at the chart and also based on Elliott wave theory, it is clear that Bitcoin is completing submicro wave 4 of micro wave 5, wave 4 is usually an extended wave that covers a large time period with up and down fluctuations, I think the end of submicro wave 4 will be in the 110k-112k range in the four-hour timeframe. I think Bitcoin will break the 25k range in the coming days.

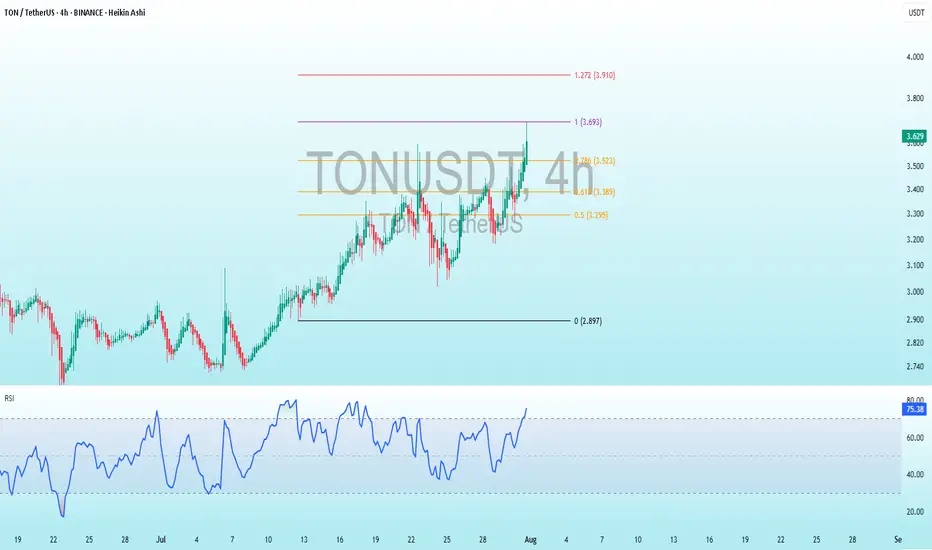
TON Bearish DivergenceBINANCE:TONUSDT
Trade Setup:
Target 1: 3.523 (0.786 Fibonnaci Golden Zone).
Target 2: 3.389 (0.618 Fibonnaci Golden Zone).
Target 3: 3.295 (0.786 Fibonnaci Golden Zone).
Target 4: 2.897 (0 Fibonnaci).
Stop Loss: 3.910 (1.272 Fibonnaci).
RSI Analysis: The RSI is showing a bullish divergence, suggesting potential bullish momentum. The current RSI is around 75.44, approaching overbuy territory, so caution is advised.
BTC Elliot Wave Double Combo CorrectionToday, I observed that Bitcoin may be unfolding within a complex double corrective wave structure—specifically a WXY pattern—potentially culminating in a contracting triangle.
Such corrective formations represent a temporal pullback, wherein the market undergoes a period of consolidation following an impulsive advance, also referred to as a pullback in time. This phase often serves as a mechanism for establishing structural support within a defined range prior to a continuation move.
A key point of uncertainty lies in whether the integrity of the triangle has been compromised by the recent, pronounced liquidity sweep. From the perspective of both the daily and 4-hour charts, this move resembles a classic deviation or "fake-out" rather than a legitimate breakout.
Nonetheless, the market may remain in a state of indecision for a few more sessions, characterized by erratic or range-bound price action, before committing to a more definitive trend.
A sustained break and successful retest above the 120K level would serve as a strong technical confirmation that Bitcoin intends to pursue higher valuations.

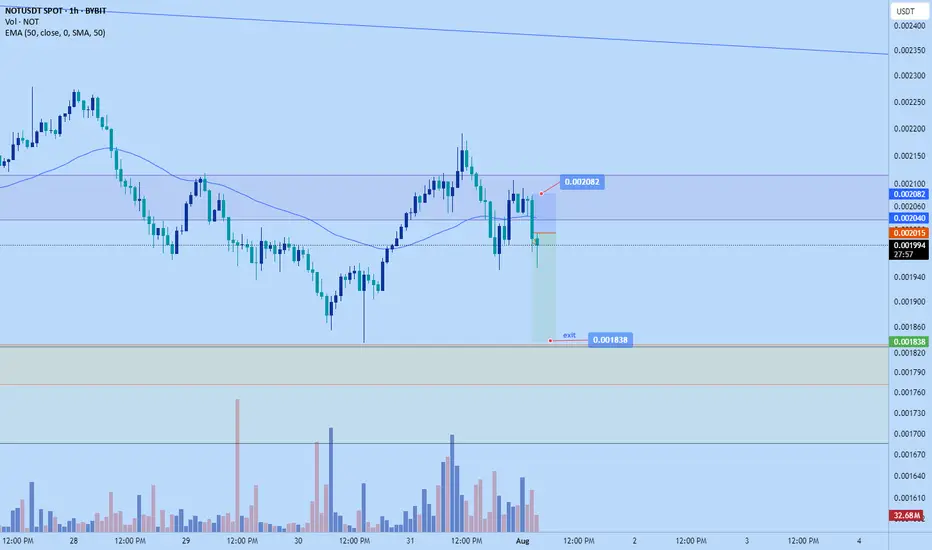
Notcoin short to $0.001838Just now opened up a short position on notcoin. Aiming for $0.001838
roughly 2.64 RR
DTT strategy, learn more on X
Sl: $0.001838
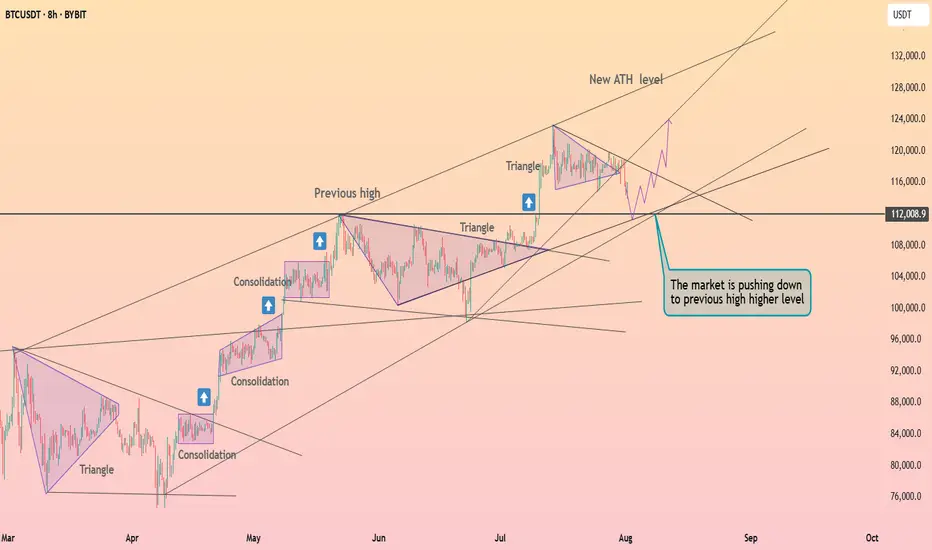
Bitcoin exited from the triangle ┆ HolderStatBINANCE:BTCUSDT is dipping to retest $112,000, the last breakout level. The price remains inside a large ascending triangle and may soon resume its uptrend. If this support holds, targets above $125,000 come back into play.
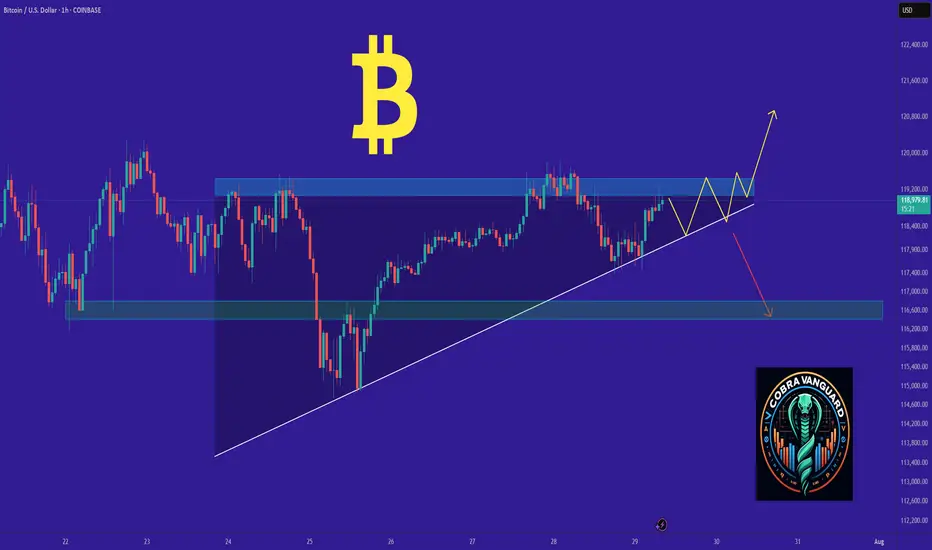
BITCOIN's Situation (1h) !!!The price is within an ascending triangle, which could be encouraging. However, since crypto doesn't always follow patterns, it might break down from below and correct to around $116K!
Best regards CobraVanguard.💚
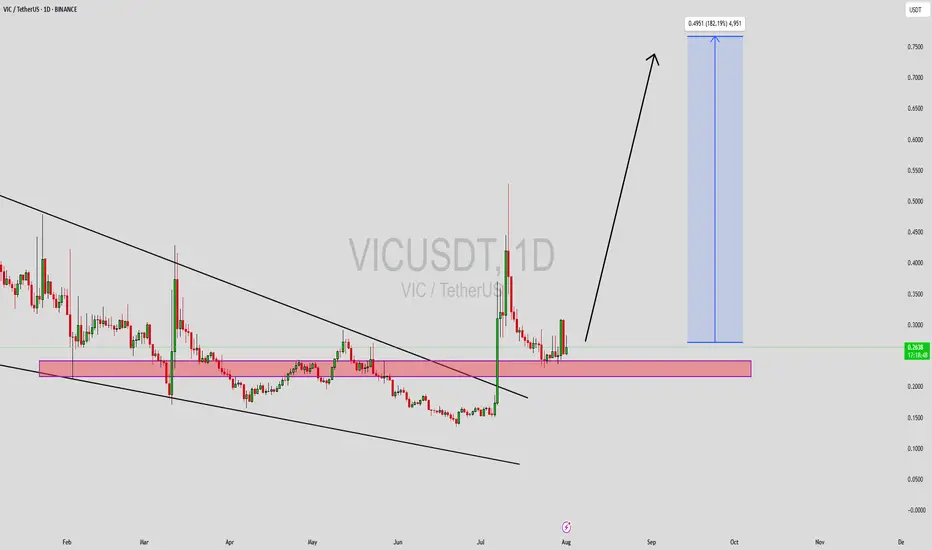
VICUSDT Forming Descending WedgeVICUSDT is currently displaying a classic descending wedge pattern, which is often recognized as a bullish reversal signal in technical analysis. This pattern typically emerges after a prolonged downtrend, and when paired with good volume — as we’re now seeing — it suggests that selling pressure is weakening and a breakout to the upside could be imminent. VIC has respected its wedge boundaries well, and now it's approaching the breakout zone, making this an ideal time for technical traders to watch closely.
Volume has been steadily increasing, which supports the idea of accumulation at the current levels. This convergence of price and volume dynamics signals that smart money may be positioning itself ahead of a potential rally. Based on the measured move from this wedge pattern, a 140% to 150% gain could be on the horizon once confirmation of breakout is secured. The price is also hovering near historical support, which adds another layer of confluence to the bullish outlook.
With investor interest rising and sentiment shifting, VICUSDT has the potential to outperform in the coming sessions. Altcoins that consolidate in well-defined reversal patterns and attract volume are often primed for explosive moves. Traders looking for setups with strong technical structure, breakout confirmation, and momentum alignment may find VICUSDT to be one of the top candidates for mid-term gains.
This is a high-reward opportunity for patient and disciplined traders. Keep an eye on resistance breakout levels and volume surges, as they may trigger the start of a powerful trend reversal.
✅ Show your support by hitting the like button and
✅ Leaving a comment below! (What is You opinion about this Coin)
Your feedback and engagement keep me inspired to share more insightful market analysis with you!

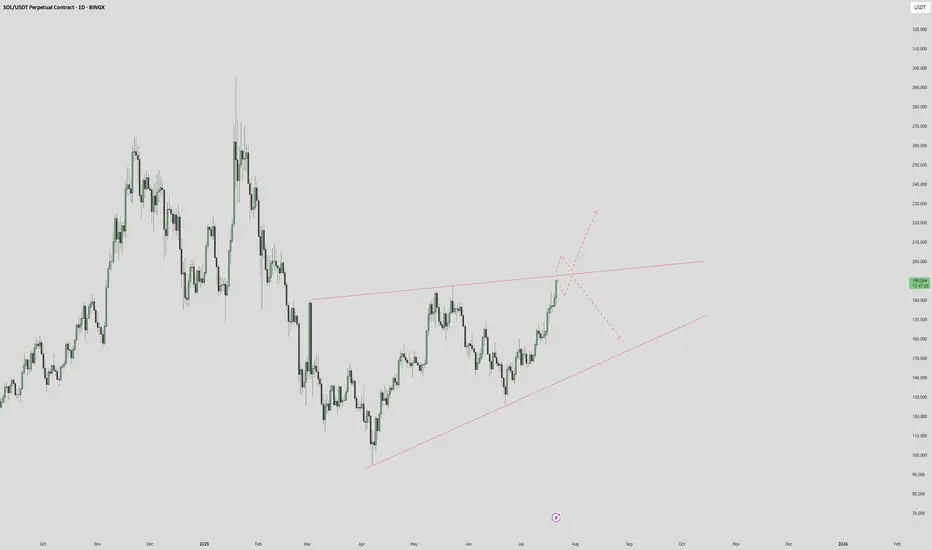
SOLANA $250 INCOMING? or $150 again?We can see a wedge is forming, price is at a major point, break above with a failed break below the resistance - we see high potential for $250.
Failed breakthroughs and a rejection? We see $150 once more.
Thoughts?
#MAGIC/USDT#MAGIC
The price is moving within a descending channel on the 1-hour frame, adhering well to it, and is on its way to breaking strongly upwards and retesting it.
We have support from the lower boundary of the descending channel, at 0.1474.
We have a downtrend on the RSI indicator that is about to break and retest, supporting the upside.
There is a major support area in green at 0.1700, which represents a strong basis for the upside.
Don't forget a simple thing: ease and capital.
When you reach the first target, save some money and then change your stop-loss order to an entry order.
For inquiries, please leave a comment.
We have a trend to hold above the 100 Moving Average.
Entry price: 0.1800.
First target: 0.1837.
Second target: 0.1900.
Third target: 0.1958.
Don't forget a simple thing: ease and capital.
When you reach your first target, save some money and then change your stop-loss order to an entry order.
For inquiries, please leave a comment.
Thank you.

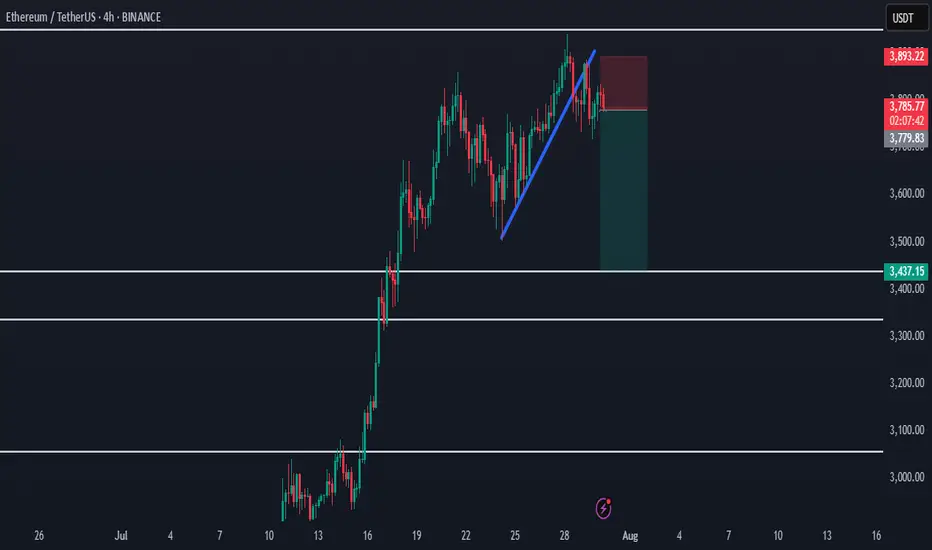
Ethereum Rejected from Supply - Bearish Shift in ProgressHello everybody!
Price has been rejected from a supply area.
The bullish trend has slowed down, and the market structure is slightly shifting bearish.
A polished upward trendline has been broken on the 1H timeframe.
We’re aiming for a target around the first untouched demand zone: 3437.
Manage your risk and trade safe!