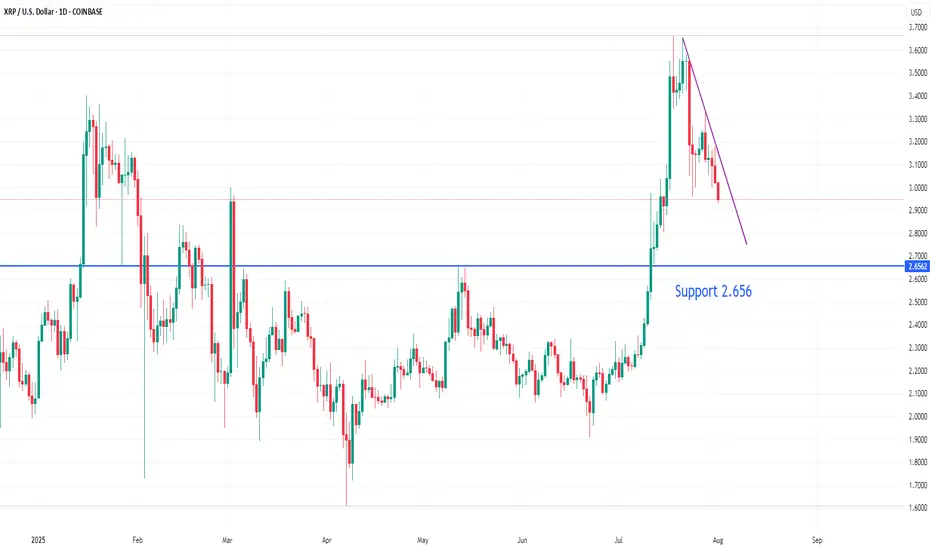
XRPUSD downside target 2.656On the daily chart, XRPUSD has retreated from its highs, with short-term bears dominating. Currently, the price is in a downward trend, so shorting near the downtrend line resistance is recommended, with a target around 2.656.
Crypto market
SEI/USDT at a Critical Level Golden Pocket Reaction Will Define?🔍 Technical Analysis:
1. Market Structure:
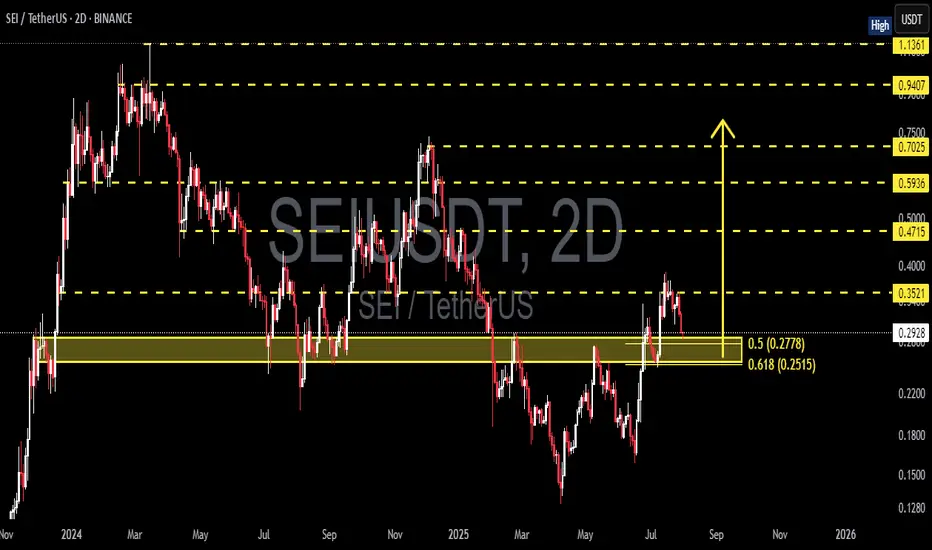
SEI/USDT is in a recovery phase after a significant downtrend.
Price is currently testing a crucial area between the Fibonacci retracement levels of 0.5 (0.2778) and 0.618 (0.2515) — known as the Golden Pocket Zone.
2. Key Support & Resistance Levels:
Strong support lies within the highlighted yellow zone (0.2515 – 0.2778), a historical support-resistance flip level.
Key resistance levels to watch:
🔸 0.3521
🔸 0.4715
🔸 0.5936
🔸 0.7025
🔸 0.9407
🔸 1.1361
---
📈 Bullish Scenario:
If price holds above the golden pocket:
A strong rebound is likely, forming a higher low structure.
Bullish confirmation occurs if price breaks and closes above 0.3521 with strong volume.
Upside targets: 0.4715 → 0.5936 → 0.7025 in sequence.
🔹 Additional Confirmation: Bullish reversal patterns (e.g., bullish engulfing or pinbar) around 0.25–0.28 would strengthen the bullish outlook.
---
📉 Bearish Scenario:
If the price breaks below the 0.2515 level:
It could trigger a deeper move toward 0.22 – 0.18 support area.
Further breakdown may bring price below the psychological level of 0.15.
🔻 Bearish confirmation if the price gets rejected from the 0.30–0.35 region with strong bearish candles.
---
📊 Pattern Insight:
Potential Double Bottom formation near the golden pocket zone.
A break above the 0.3521 neckline would validate this bullish reversal pattern.
---
🔖 Conclusion:
This zone (0.25–0.28) is a make-or-break area for SEI. A strong reaction from this golden pocket will determine whether SEI is ready to rally further or fall to new lows.
#SEI #SEIUSDT #CryptoAnalysis #AltcoinUpdate #TechnicalAnalysis #Fibonacci #SupportResistance #GoldenPocket #CryptoTrading #SEIpriceprediction
Bitcoin Has Bearish DivergenceOverbought bearish divergence.
I pointed this out last week. In my mind, this is the most reliable signal for tops (bullish divergence for bottoms) that exists in technical analysis. We can see that this continues to play out, and know that it usually leads to RSI making the trip to oversold.
It looks like more correction is likely, standard fare in a bull market.

The Curtain Falls on the Script: Why I Believe It's Time to StopHello everyone, this is EC.
From late June through July, we experienced a full-fledged primary uptrend in crypto, driven by a weakening U.S. Dollar. From the script preview to the execution of the plan, every step has been clearly documented.
However, today, I want to share a different, more cautious perspective: I believe this script may be nearing its end.
I. Reviewing the Script and the "Bubble's" Manifestation
After our call on July 4th that the "main bull wave" was starting, the market perfectly delivered on our expectations. What was more interesting was the clear internal divergence we saw, which precisely confirms our thesis about the "bubble phase" from my June 20th article, "The Restlessness Before the Storm."
When the market's sentiment "balloon" is inflated to its limit, capital flows from the leader (BTC) to assets with higher elasticity (ETH).
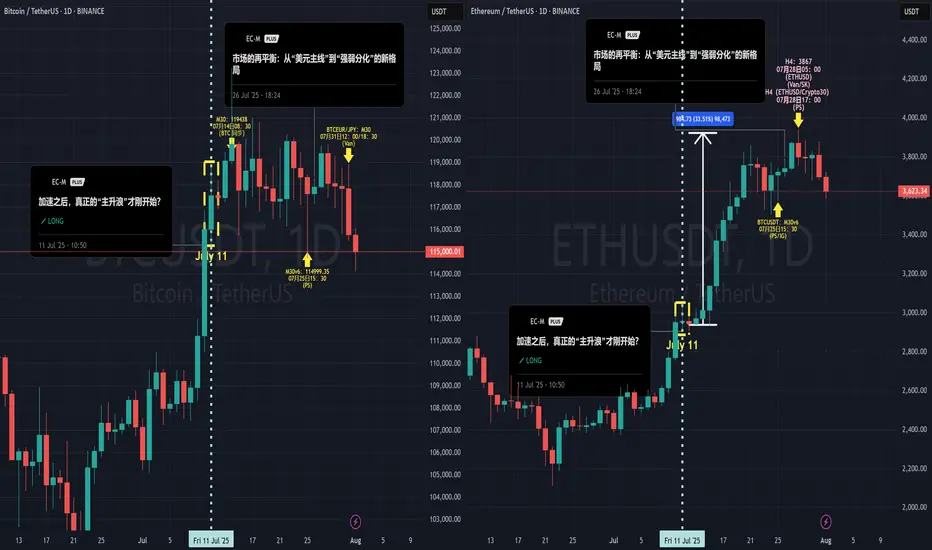
The data shows that from July 11th until now, ETH took the baton and rallied approximately 35%, while BTC gained only around 6% in the same period. When BTC is already showing signs of fatigue while ETH is still in a solo rally, that in itself is a major signal that the bubble is nearing its end.
II. A Shift in the Winds: The Hand Inflating the Balloon is Loosening
I've chosen to end this script at this moment based on signal changes on two levels:
The "External Factor" Shift: The Potential Strengthening of the USD
As I pointed out in my July 28th analysis, "The Market's Rebalancing," the market has entered a phase of "strength-weakness divergence." This trend is now becoming more evident: the U.S. Dollar, cushioned by the extreme weakness of currencies like the Japanese Yen, has begun to show signs of a broad strengthening. Concurrently, U.S. and European stock markets are pulling back in sync, and global risk appetite is cooling.
The external environment that fueled the bubble (a weak USD) is beginning to falter.
The "Internal Factor" Signal: The Needle Point Inside the Balloon
The crypto market itself is also showing warning signs of resistance (see attached ETH daily chart). When the leading asset, ETH, begins to show signs of stagnation and distribution at its highs, it's like the balloon meeting the needle point. The exhaustion of internal momentum is a more direct warning than changes in the external environment.
III. Conclusion: Don't Be Greedy for the Last Dessert
When the core logic driving the rally (a weak USD) begins to waver, and the market simultaneously shows internal signs of exhaustion, my choice is to end this script and take profits off the table.
This doesn't mean I think crypto will crash immediately. But "no longer suitable to hold" implies that, in my view, the risk/reward ratio at the current level is no longer attractive. A grand feast is coming to an end, and being greedy for the last dessert is not a wise move. Shifting from "buying the dip" to "cautious observation" is the rational choice.
Thank you for your attention and for following along this past month.
#Crypto #BTC #ETH #TradingView #MarketAnalysis #RiskManagement
Bitcoin - Up trend go on Bitcoin - Up trend go on
as we mentioned before our long plan from range low is go on
soon that weoul be a time to close it by parts

The Loudmouth Pattern: It Yells, We Trade!
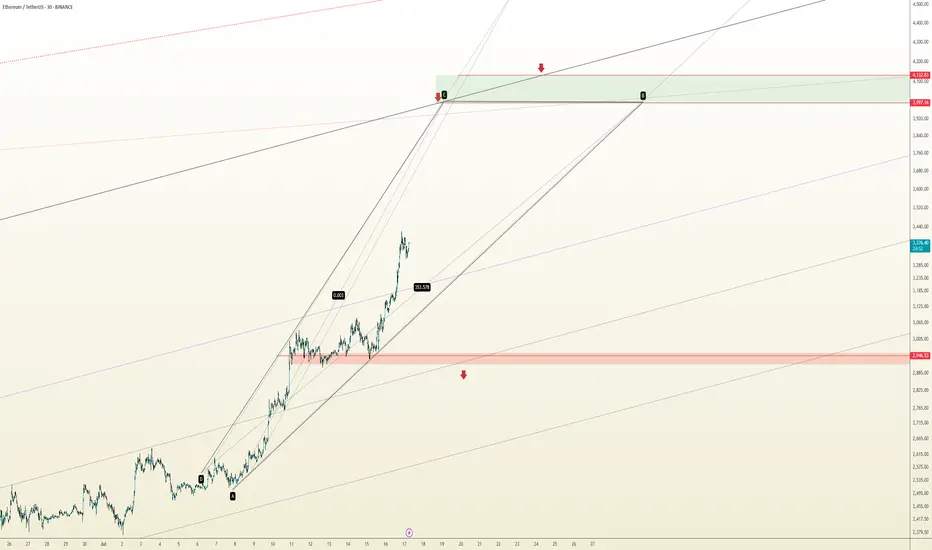
On the 30-minute chart, ETH is forming a classic Broadening Formation – or as some traders like to call it, “The Big Mouth Pattern” 😄. It’s noisy, unpredictable at first glance, but when it speaks, you’d better listen.
Right now, price is moving through the bullish leg of this setup, and if momentum holds, we’re eyeing the $4,000 psychological level, followed by the $4,120 – $4,170 supply zone.
🔹 Bullish Scenario (our expected outlook):
🎯 Target 1: $4,000
🟩 Main Resistance: $4,120 – $4,170
❌ Invalidation: Confirmed close below $2,946
If price breaks and holds below that red support zone, this setup gets thrown out the window.
📊 Risk Management:
Scale in on pullbacks – if structure remains valid
No chasing without confirmation
Keep risk under 1% of total capital
📈 The market’s big mouth is open – and until it closes below $2,946, we’re listening for bullish signals. 🤑
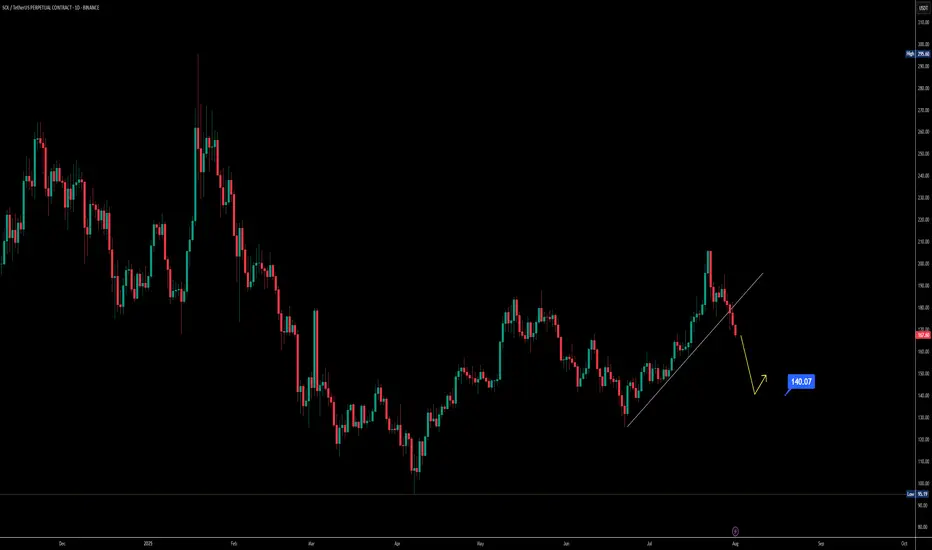
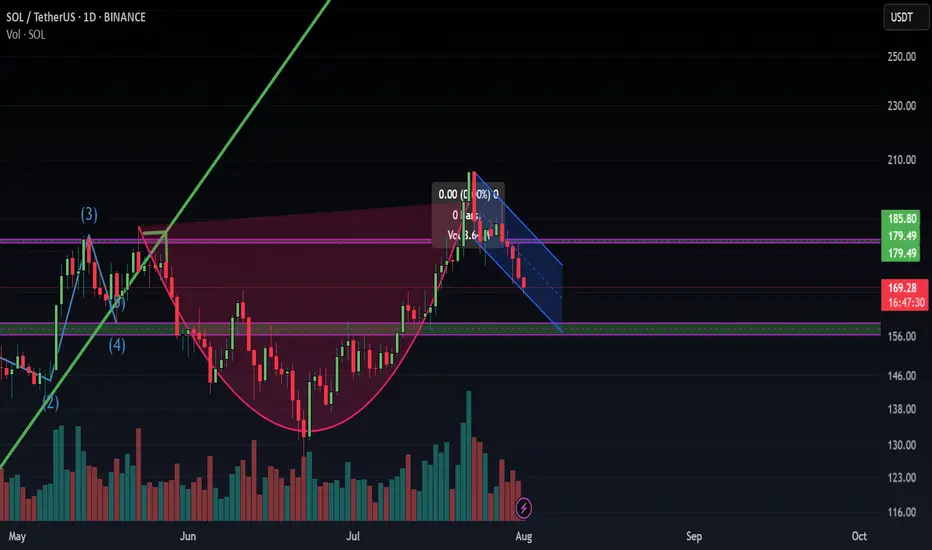
$SOL Loses Key Support | Eyes on $140 & $95 Zones📉 CRYPTOCAP:SOL Loses Key Support | Eyes on $140 & $95 Zones
🕵️♂️ On the daily timeframe, #Solana has officially lost its key support near $140, which previously acted as a strong bounce zone. A failure to reclaim this level could open the gates for a deeper drop toward the $95–$100 support range.
📊 Indicators signal downside:
RSI is trending downward
MACD shows a bearish crossover
Stochastic RSI confirms continued selling pressure
⚠️ Macro pressure adds fuel to the fire: August 1st tariff tensions, with expected news from Trump on charging Paris, are weighing down global risk assets. Historically, August tends to be a bearish month for crypto markets.
🎯 Key Levels to Watch:
Immediate Resistance: $140
Major Support: $95–$100
🧠 Trade wisely and manage risk accordingly.
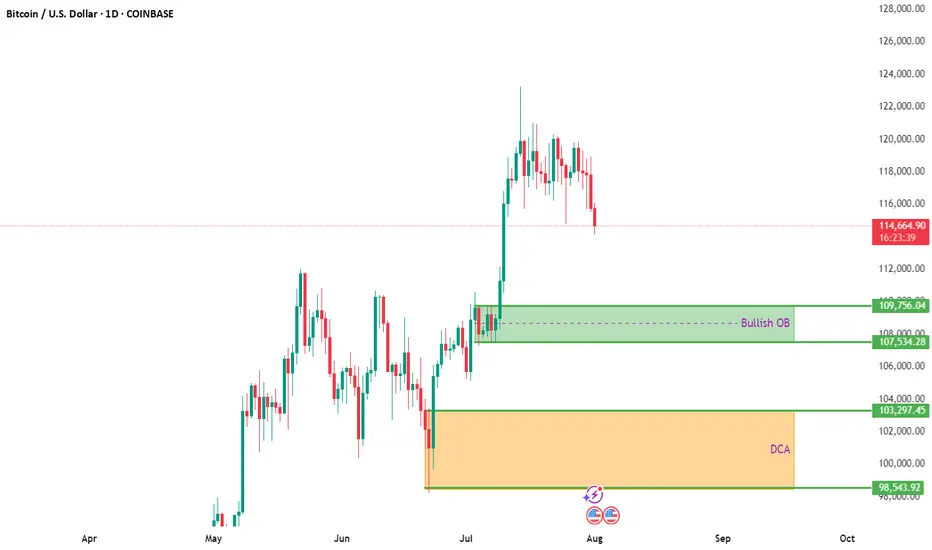
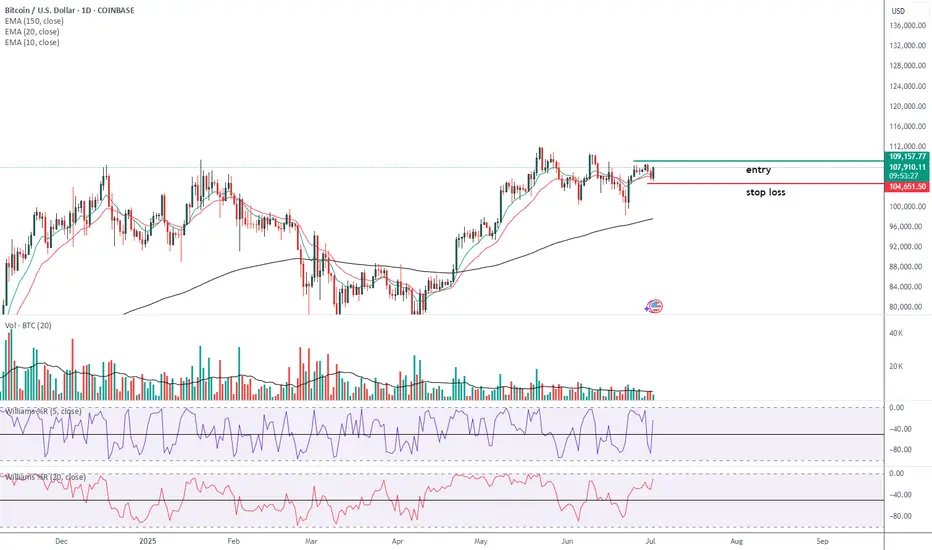
BTCUSD Daily Analysis – Key Entry & DCA ZonesBitcoin is currently pulling back after a strong bullish move, now hovering near $115K. The correction opens a potential window for smart entries based on prior market structure and order block analysis.
🔍 Bullish Order Block (OB):
✅ Zone: $107,534 – $109,756
This area previously served as a breakout zone after consolidation. A retest of this region could act as strong support, making it a prime candidate for short- to mid-term bullish setups.
🟧 DCA Zone (Long-Term Accumulation):
✅ Zone: $98,543 – $103,297
Ideal for long-term investors looking to build exposure gradually. Dollar-cost averaging in this zone allows entry at historically undervalued levels in case of a deeper pullback.
🧠 Trading Insight:
Patience pays. Let price come to your levels rather than chasing. Use alerts and consider scaling into positions with proper risk management.
📌 Chart Context: 1D | COINBASE
📆 August 2025
📈 TA by: @NFX_Solutions
#BTC #Bitcoin #Crypto #BTCUSD #TechnicalAnalysis #OrderBlock #TradingView #CryptoStrategy #DCA #SwingTrade #SupportZone
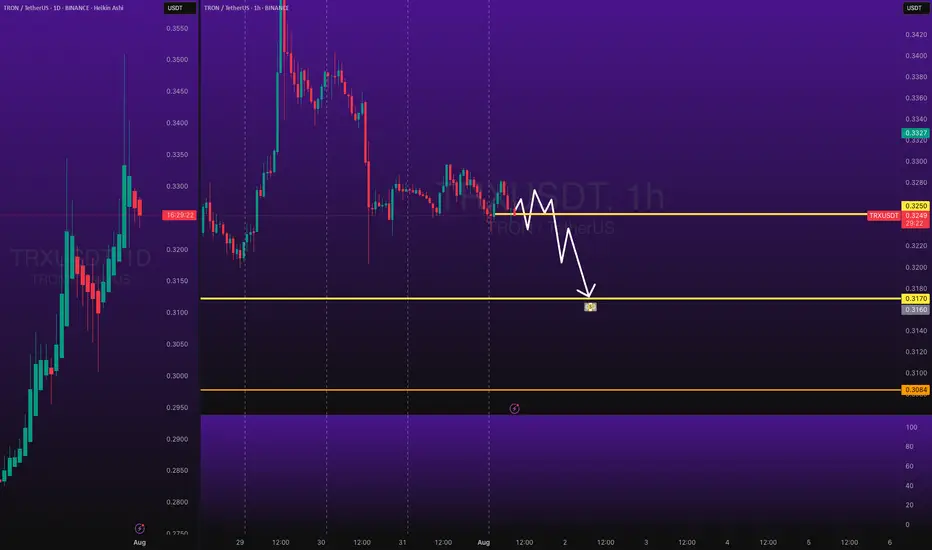
TRXUSDT Short Trade - Price CorrectionsBINANCE:TRXUSDT Short Day Trade - Low Risk, with my back testing of this strategy, it hits multiple possible take profits, manage your position accordingly.
Note: Manage your risk yourself, its risky trade, see how much your can risk yourself on this trade.
Use proper risk management
Looks like good trade.
Lets monitor.
Use proper risk management.
Disclaimer: only idea, not advice
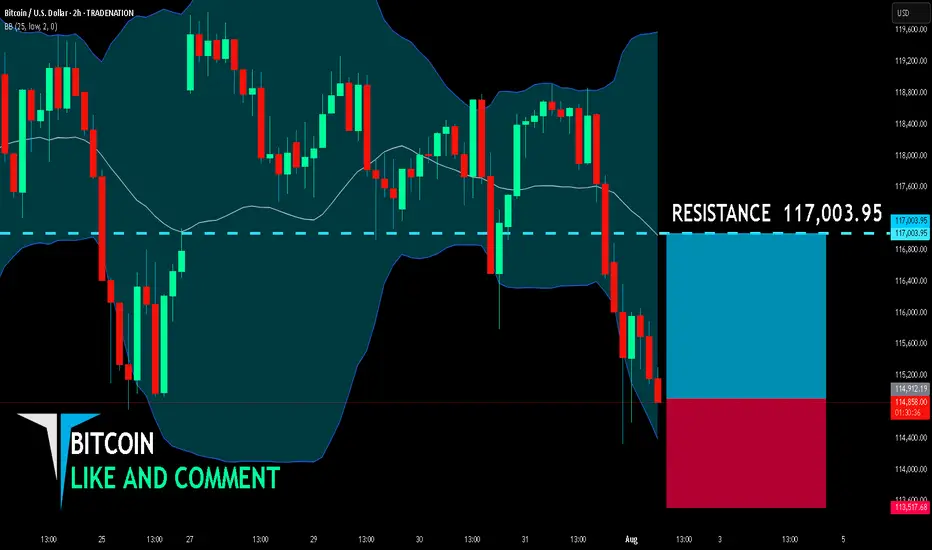
BITCOIN SENDS CLEAR BULLISH SIGNALS|LONG
BITCOIN SIGNAL
Trade Direction: long
Entry Level: 114,912.19
Target Level: 117,003.95
Stop Loss: 113,517.68
RISK PROFILE
Risk level: medium
Suggested risk: 1%
Timeframe: 2h
Disclosure: I am part of Trade Nation's Influencer program and receive a monthly fee for using their TradingView charts in my analysis.
✅LIKE AND COMMENT MY IDEAS✅
this is familier patternis this a cup of tea pattern? i see a cup and handle this is a sign of bullish in next week
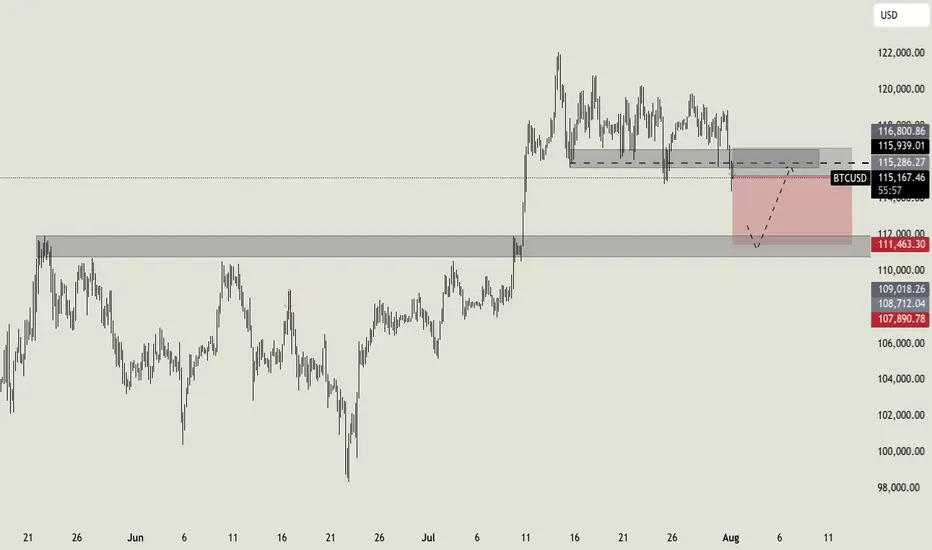
NO FEAR on BITCOIN!I was waiting for a break on this level from some days, and here we go! We catched a nice long setup previous days, and now Bitcoin broke down the key level i highlited last week. This is an important support area that will now act as resistance, so i expect a continuation to the downside till the second support area at $112.000. To invalidate this setup we should expect a clean break above $116.800.
Let me know in the comment what do you expect!
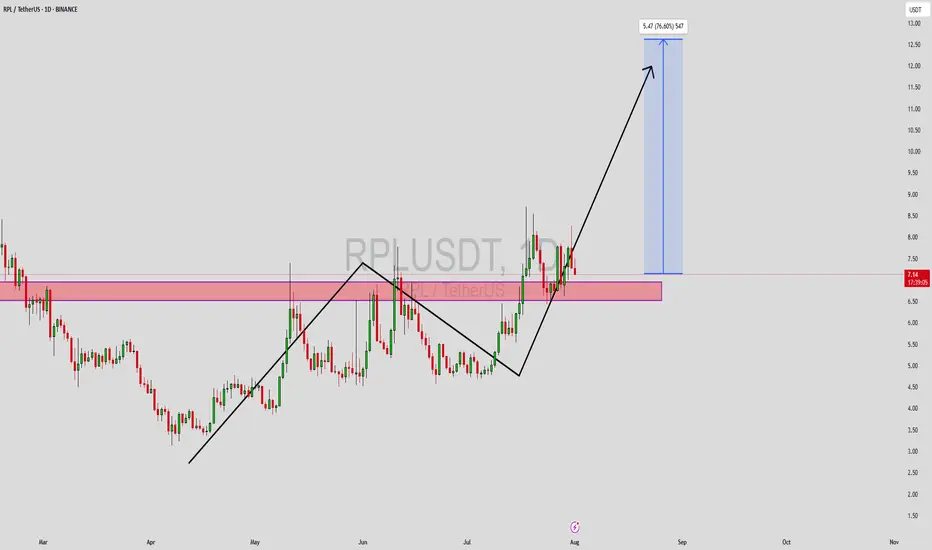
RPLUSDT Forming Strong Bullish StructureRPLUSDT is currently showing a strong bullish structure, with price action reclaiming a key support zone after a temporary retracement. The chart reveals a textbook market cycle with higher highs and higher lows, indicating a possible continuation of the uptrend. The current price level is sitting just above a key demand zone, previously tested and confirmed as strong support. This confluence area may act as a springboard for a potential move toward the 60% to 70% target gain zone, aligning with broader bullish sentiment seen across mid-cap altcoins.
Volume indicators are supportive of this move, suggesting that accumulation is underway. Increased investor interest in RPL is likely tied to its integral role in Ethereum’s liquid staking ecosystem, as Rocket Pool continues to gain adoption. With ETH staking steadily growing, projects like RPL tend to benefit from fundamental tailwinds. This kind of sector strength combined with favorable technicals gives the current setup more credibility and potential for follow-through.
The technical projection suggests that if momentum holds and buyers maintain control above the support range around $6.70–$7.00, then the next leg could push RPLUSDT beyond $12.00. That represents a 70%+ move from current levels, which aligns with the Fibonacci extension and measured move projections derived from previous breakout zones. Traders should keep a close eye on volume confirmation and potential breakout candles above minor resistance near $7.50.
This setup offers a well-defined risk-to-reward ratio for swing traders and position holders alike. With the current crypto market regaining traction, RPL is positioned as a high-potential candidate for strong upside if broader conditions remain favorable.
✅ Show your support by hitting the like button and
✅ Leaving a comment below! (What is You opinion about this Coin)
Your feedback and engagement keep me inspired to share more insightful market analysis with you!
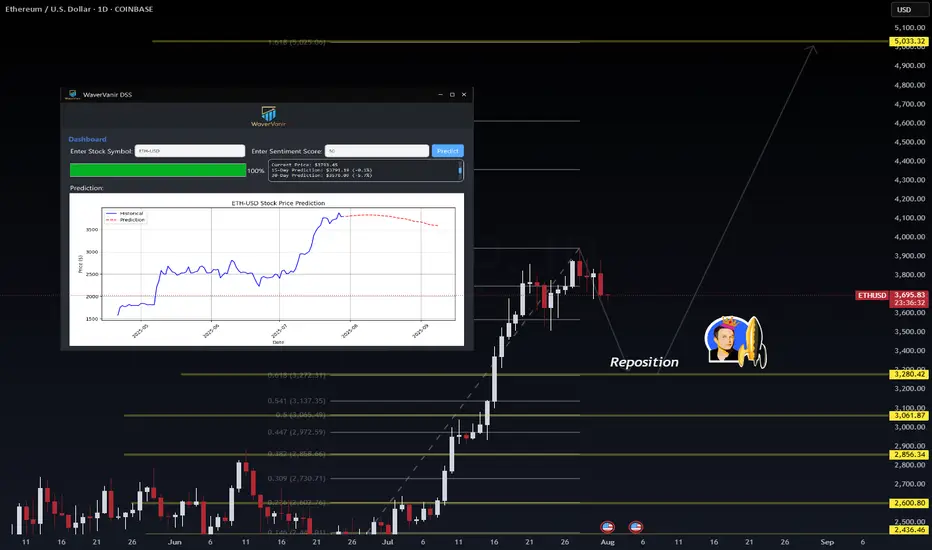
ETH Reposition Play – VolanX DSS Sentiment Filter Active📉 ETH Reposition Play – VolanX DSS Sentiment Filter Active
🧠 VolanX DSS Triggered a Long Watchlist Signal
The ETH/USDT daily chart shows price stalling near the 0.786 Fib zone after a strong rally. Our proprietary DSS (Decision Support System) now monitors sentiment misalignment to prepare for the next institutional push.
🔍 Key DSS Observations:
Retail Sentiment: Fearful — retail bias flipped to short.
News Headlines: Negative — VADER sentiment ≈ –0.45.
Funding Rates: Flipped to negative across major exchanges.
Fear & Greed Index: 28 (deep fear zone).
📊 All 4 signals confirm contrarian long opportunity in “Reposition Zone” (≈ 3566–3280). Smart Money often absorbs panic exits before triggering the next leg.
🎯 DSS Strategy:
✅ Wait for confirmation at 3,280 or wick flush to 3,061.
📈 Potential upside target = 5,033 (1.618 Fib extension)
🛡️ DSS Sentiment Filter = ✔ Passed (4/4 bearish crowd indicators)
“When the crowd panics, liquidity positions. VolanX knows this.” – WaverVanir Protocol
📡 Signal monitored via VolanX Alpha Engine
🔒 Institutional tracking | AI-guided logic | DSS Probability Matrix
#ETH #Ethereum #Crypto #WaverVanir #VolanX #SmartMoney #SentimentTrading #AlphaProtocol #DSS #Reposition
2 Scenarios for BTCNow that the cup and handle formation has been reached and the correction finished, I think we have 1 more leg up.
It's also possible that we fall from here, but I think another fakeout upwards is likely as bearish divergence forms on the month, but isn't quite there yet (RSI needs 1 more higher high to confirm bearish divergence)
Either way, my short targets are the 0.618 fibs. I am expecting the typical -70-75% crash by 2027 before the next cycle begins

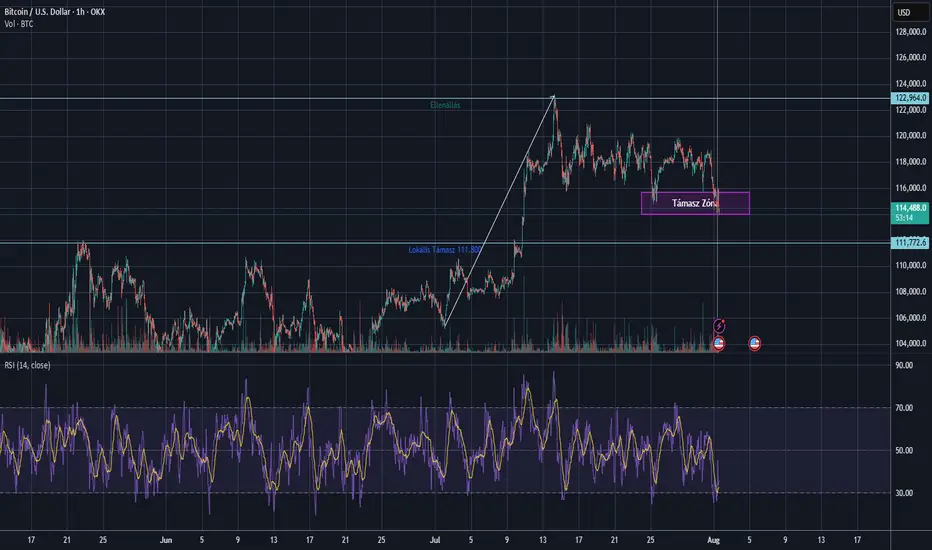
BTC Breaks Support – What's Next for Bitcoin?🧠 Bitcoin Technical Analysis – August 1st, 2025
📉 BTC/USD is under pressure, currently trading near $114,200, after dropping from the recent range highs. The chart shows a clear breakdown from a key consolidation zone between $114,000–\$115,500, marked as a crucial support zone.
🔍 Key Observations:
Major resistance remains at $123,000, where BTC topped mid-July.
A bullish trendline from early July has been broken — confirming momentum shift.
Local support sits at $111,800, a potential next landing zone if this breakdown continues.
The RSI (14) is now in oversold territory, below 30, signaling potential bounce or short-term relief — however, no bullish divergence is visible yet
---
🔎 Volume Spike & Momentum:
A noticeable volume spike has appeared alongside the breakdown, confirming strong selling pressure .
Short-term moving averages (e.g., 10 EMA) are now above price, adding to the b earish short-term bias.
🧭 Conclusion :
This region is critical for bulls — if BTC can reclaim the purple support box, it could invalidate the breakdown and trap aggressive shorts. Otherwise, \ $111,800 is the next area to watch for a reaction.
Let me know your thoughts below — Will this support hold or is \$110k next?
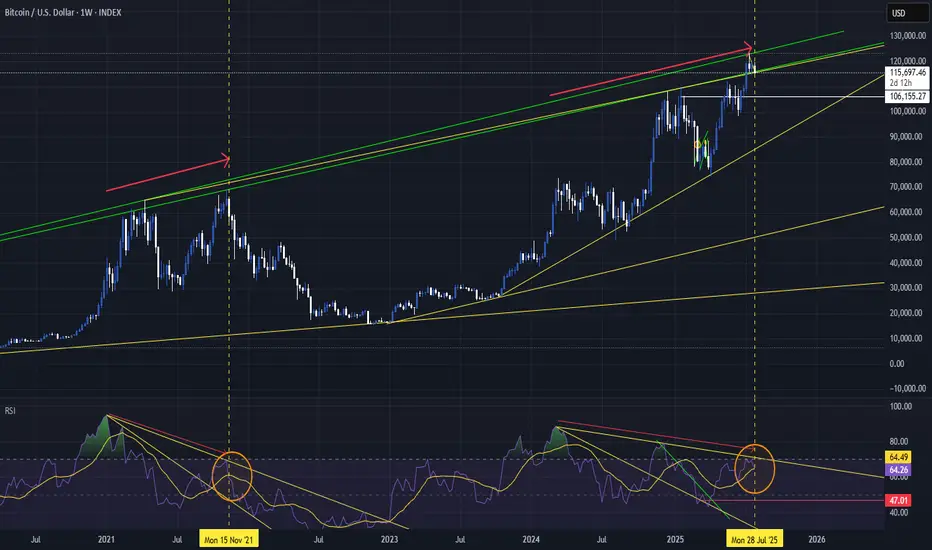
Could this be the end of the bull market? Caution requiredSo the green lines are the tops of the last 2 cycles.
We have wicked up to the top of the line, and got denied.
We have spent a week above the bottom GREEN line, suggesting that we want to hold it.
Weekly closes above the bottom line are an acceptance that the price is right and has movement potential to continue higher.
We can retest 106, hold above - and then see continuation higher. It is possible... but
IF you look at the RSI and compare to 2021, there is BEARISH DIVERGENCE that is clearly defined. This is a leading indicator, and often works out more than not.
We 100% need to get above the top yellow trend line to invalidate the bearish divergence.
Right now, RSI is testing the yellow moving average - this is the point last cycle where everything ended.
If price recovers, then i think we go higher (new ath again).
If Price does not, and RSI falls below the moving average, then i think its likely the bull cycle for btc is over..
BUT, its not all doom and gloom.
The RSI moving average has made a higher low, suggesting that the market is not finished its upwards momentum.
On a more fundamental understanding:
BTC has gone almost straight up from 16k to 121k. Its not healthy.
To get to higher highs, we need real adoption of btc.
I dont think BTC breaks and holds above 130k without some more kind of mainstream adoption.
We have institutional adoption - ETFS allow a constant buying pressure, pension funds have access to BTC now too! (I have a new btc exposed retirement annuity if anyone is keen... just dont think the % allowed is that reasonable at the moment).
Banks are starting to allow custody of BTC, meaning the average joe will be able to buy through their bank...
But i cant pay for my beers with btc, i cant use btc to settle debts with most merchants.
There is still more mainstream adoption to happen...
Countries are not piling into btc to make it a reserve asset in teh way i believe they will in teh future
The market will always move to hurt the most people.
Once everyone who wants to buy btc at the highs is done, then the price 100% will correct...
As btc matures, its volatility will drop. This means that the 80% retraces of the past are unlikely in my opinion.
There are big players wanting to buy for long term, this will make buy orders happen sooner than they have in the past.
As an indicator for the alt market - btc losing major psychological levels will create a risk off environment - aka more alt pain.
I had a look at the BTC.D, and on a quick inspection it looks like it could rise to even as high as 75%...
Which, as btc has a global use case as a store of value makes sense vs alt coins changing the world in the same time span.
If the price of BTC drops, alts will drop harder as they are riskier assets. Making BTC.D increase.
Alts are still close the lows, and they need a risk on environment to gain value.
The whole crypto market has changed compared to the old cycles.
Previously, the BTC believers would make huge money - and then at these peaks sell their btc to either tether and alt tokens.
This insane amount of money we received into the total market cap came from big institutions - blackrock etf etc, governments buying.
These players that made the money cant swop their btc to alt coins. They are locked into an etf where at most they can diversify into other traditional investments.
This is a real risk to total2+ receiving a real return...
But its not over, BTC will survive. We learn what we can to make sound financial decisions in the long term.
Stick with your long term plans. Dont but trash. Manage your risk. Manage your mental, dont be over exposed to risk when at the highs.
going lon after the close of 07:00 AM the price took the lequidite of a significant Low , and back to the range never close below
this low in 1H TF and 4H TF after we get HL or Swing high I enter buy

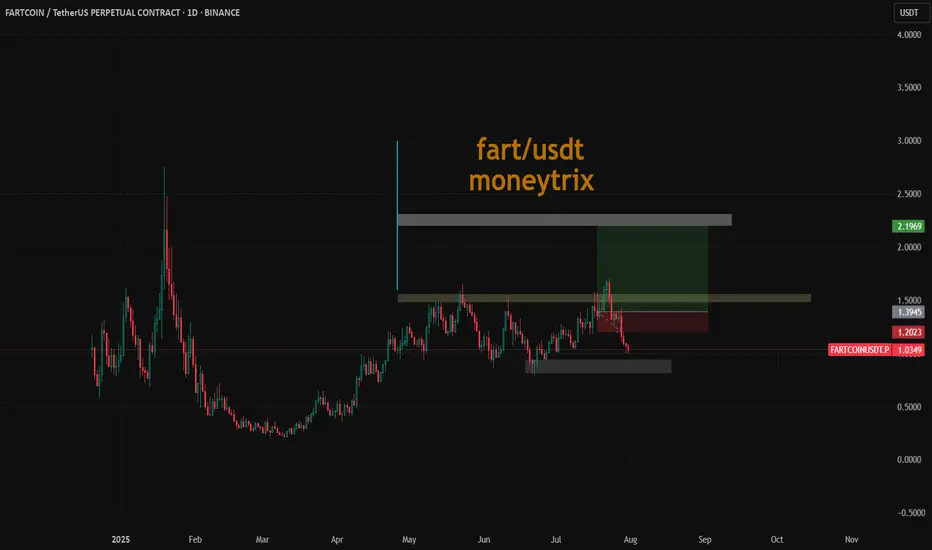
fart long entry soon as per analysisits not afinancial advice #dyor
evry thiong is mentioned on chart as u can see clearly
and this is strongly bullish until turn this below order block to breaker blok with heavy volume
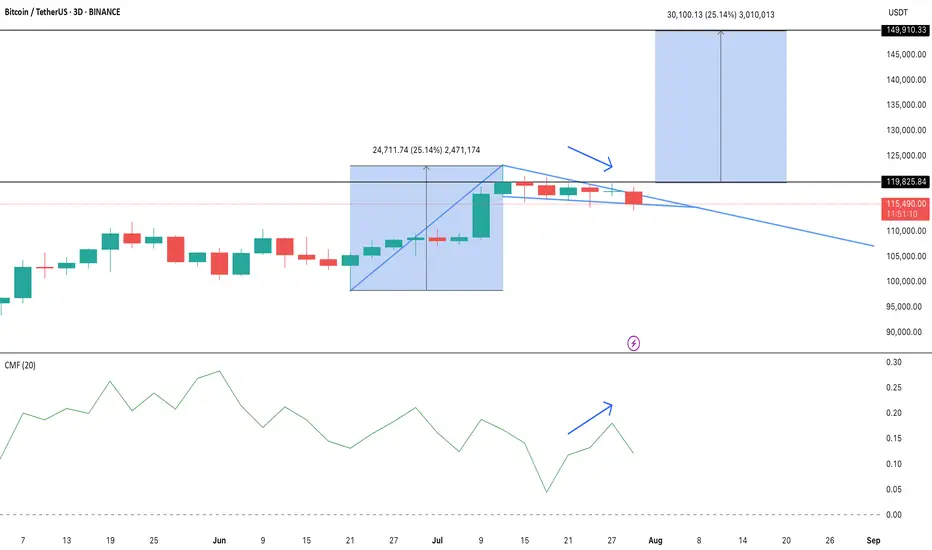
BTC/USDT Analysis – Bullish Pennant Holds Key to $150,000 TargetBINANCE:BTCUSDT is holding just above $115,000, recovering from a 2.4% dip in the last 24 hours, with one technical setup dominating the conversation: a bullish pennant on the 3-day chart.
The pattern formed after a sharp 25% rally earlier this month, creating a classic pole-and-pennant structure. Multiple breakout attempts have failed so far, with long wicks signaling heavy volatility, but the pattern remains valid as long as the BINANCE:BTCUSDT price stays above the $114,000 support zone.
A confirmed 3-day candle close above $119,700—the top of recent failed breakouts—would likely trigger the next leg higher. A measured move from the pole projects an upside target near $150,000, aligning with long-term bullish expectations.
Supporting this setup, the Fund Flow Ratio has been making lower highs, suggesting fewer coins are heading to exchanges and potential sell pressure is easing. At the same time, Chaikin Money Flow (CMF) on the 3-day chart is forming higher highs, signaling quiet accumulation despite recent price dips.
Until either level breaks, BINANCE:BTCUSDT trades in a pivotal range. Bulls want a clean breakout above $119,700, while a drop below $114,000 would invalidate the pattern and open the door to further downside.
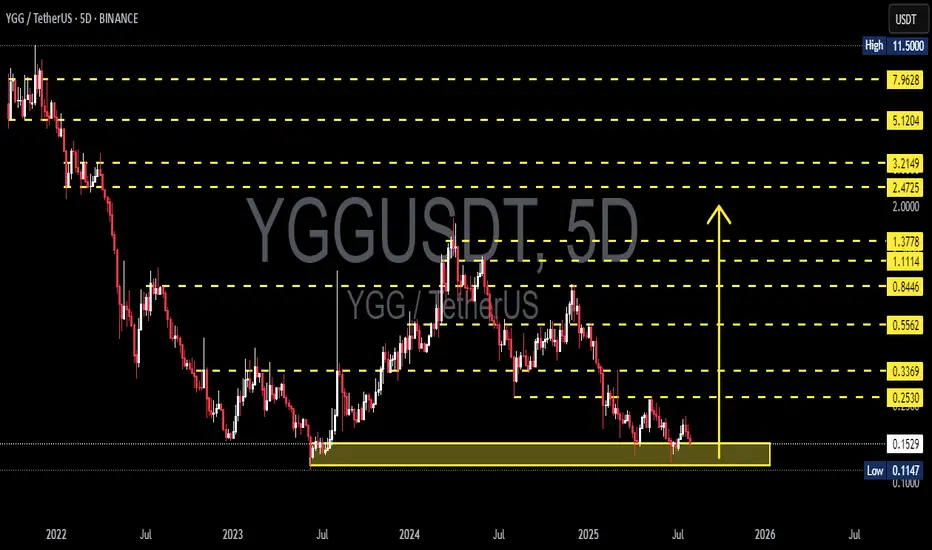
YGGUSDT Retesting Historical Support Zone! Bounce or Breakdown?YGG/USDT is currently at a critical crossroad. After a long-term downtrend from the peak at $11.50, the price has once again returned to the historical demand zone between $0.1147 and $0.1535 — an area that previously served as a strong base for reversals in the past.
Will this level act as a launchpad for a strong rebound, or are we about to witness a fresh breakdown?
---
🔍 Comprehensive Technical Analysis:
📌 Mid-Term Market Structure:
Price remains in a macro downtrend, but is now entering a potential accumulation phase.
This support zone has been tested multiple times throughout 2023–2025, confirming it as a key psychological level.
The current structure resembles a bottoming range, setting the stage for a possible trend reversal.
📊 Key Support & Resistance Levels:
🟩 Major Demand Zone: $0.1147 – $0.1535 (highlighted green box on the chart)
📈 Bullish Upside Targets:
$0.2530 (initial resistance & breakout trigger)
$0.3369 (early trend strength confirmation)
$0.5562 – $0.8446 (realistic mid-term targets)
Up to $1.11 and $1.37 (longer-term resistance)
---
🐂 Bullish Scenario (Reversal Potential):
If price holds this support and forms a clear reversal pattern:
A strong rebound toward $0.2530 – $0.3369 is highly likely.
A breakout above $0.3369 would confirm a double bottom or falling wedge breakout.
Additional catalyst: positive sentiment in the broader crypto market could accelerate the move.
🔔 Confirmation needed: a strong bullish candle + rising volume = reversal validation.
---
🐻 Bearish Scenario (Breakdown Risk):
If support at $0.1147 fails:
Price could slide lower toward $0.10 or even create a new all-time low.
This would extend the current bearish structure and invalidate short-term recovery hopes.
---
🧠 Pattern Insight:
The current setup resembles a sideways accumulation range.
Possible bullish formations:
Double Bottom
Rounding Bottom
Falling Wedge Breakout (typically bullish)
---
🎯 Strategy & Trader Perspective:
Aggressive Traders: May consider entering near support with tight stop-loss below $0.1147 and targets around $0.2530 – $0.3369.
Conservative Traders: Wait for a confirmed breakout above $0.2530.
Long-Term Investors: This area could present a gradual accumulation opportunity if you believe in YGG’s long-term fundamentals.
---
📝 Conclusion:
This isn't just a technical support level — it's a battle zone between bullish hope and bearish pressure. The next few candles will be crucial to determine whether the bulls will regain control or the bears will break through.
#YGG #YGGUSDT #CryptoSupport #CryptoRebound #AltcoinAnalysis #BullishReversal #CryptoBearish #CryptoTrading #TechnicalAnalysis
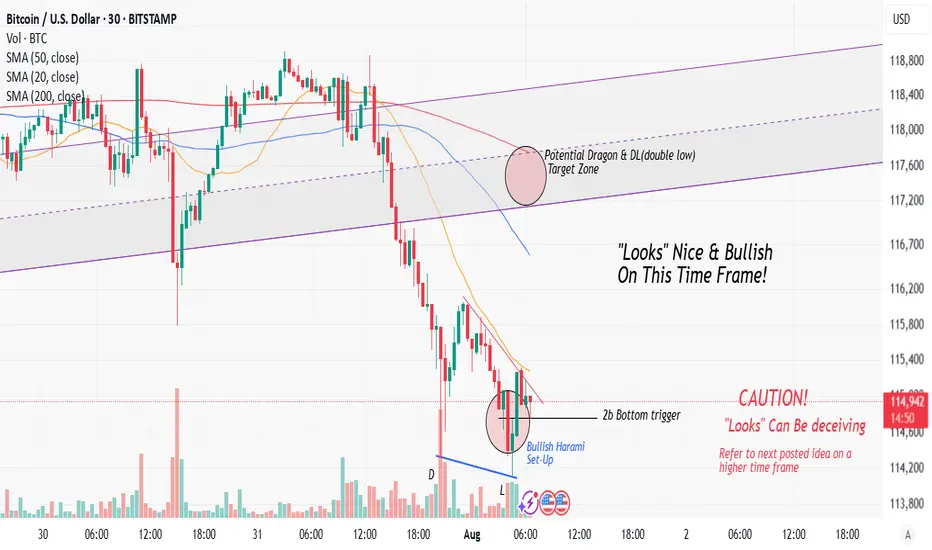
Nice Bitcoin Bullish Set Up On The Hourly I noticed something that may look interesting on the hourly time frame. So here's a little heads up!