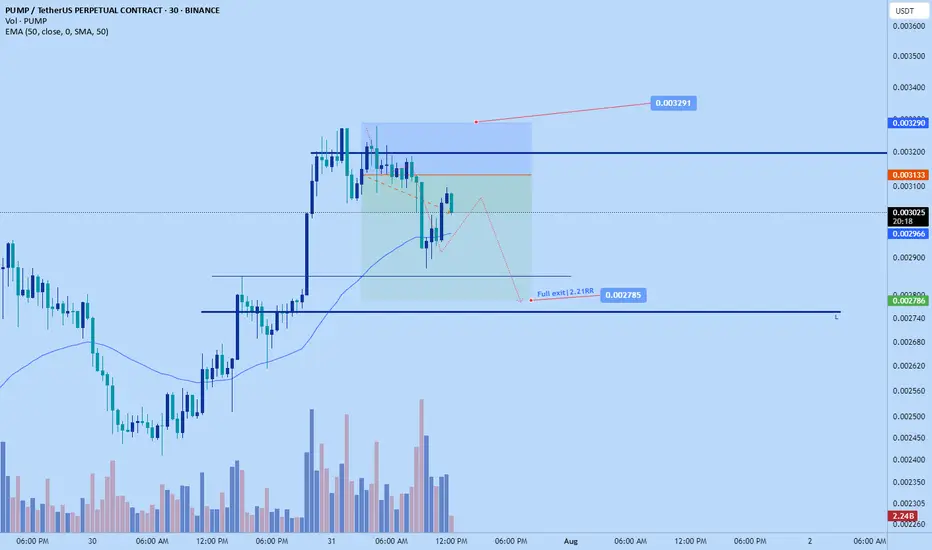
Pumpdotfun short to $0.002785Thought I shared this earlier. Shorted pumpdotfun . Aiming for $0.002785
It pumped up a bit...no pun intended but structrally its relatively high and likely to correct down again before continuation up.
DTT strategy applied, learn more about it on my x profile.
Sl: $0.003291....if want to hop on now can use 0.032 sl, a bit tigher to give roughly 1-2 RR and still provide good invalidation.
Crypto market
i confuse !!!i see bearish engulfing candle stick in weekly time frame what is going on a big retracement await of just trick us???!!

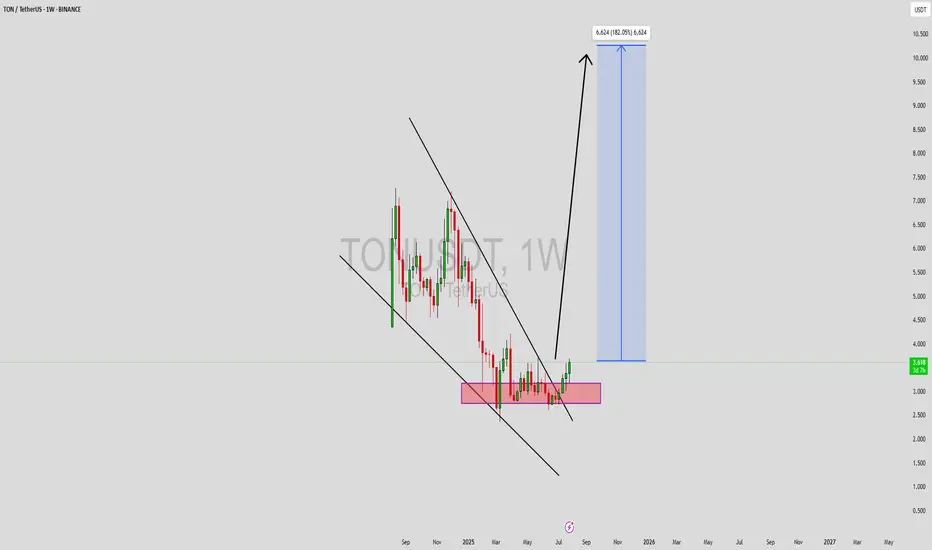
TONUSDT Forming Falling WedgeTONUSDT is forming a classic falling wedge pattern, which is widely recognized in technical analysis as a bullish reversal signal. After a period of consistent downward price compression, the narrowing structure on the chart signals that selling pressure may be weakening. This setup often precedes a significant bullish breakout, especially when accompanied by growing interest and steady volume—as is currently being seen in TON’s market behavior.
The fundamentals behind TON (The Open Network) are also strengthening, with increasing adoption across the Web3 ecosystem and a growing number of partnerships tied to Telegram's user base. The synergy between Telegram and the TON blockchain has created an environment where real-world utility is beginning to align with on-chain momentum. This alignment often catalyzes strong upward price moves, making TONUSDT one of the more promising altcoin setups in the current market landscape.
The expected gain of 140% to 150% from current levels is not just speculative—it aligns well with the technical breakout projection based on the wedge’s height and the last key swing high. If TON can maintain support above the lower boundary of the wedge while volume continues to increase, the likelihood of a breakout followed by a strong upward rally becomes much higher. Historical breakout moves from similar wedge patterns often show explosive growth in relatively short timeframes.
TONUSDT is a high-potential chart right now and should be closely monitored by traders and investors looking for large-cap altcoin opportunities with bullish technical setups. This could be the start of a major trend shift for TON, especially as broader crypto sentiment begins to tilt bullish again.
✅ Show your support by hitting the like button and
✅ Leaving a comment below! (What is You opinion about this Coin)
Your feedback and engagement keep me inspired to share more insightful market analysis with you!
ens sell midterm"🌟 Welcome to Golden Candle! 🌟
We're a team of 📈 passionate traders 📉 who love sharing our 🔍 technical analysis insights 🔎 with the TradingView community. 🌎
Our goal is to provide 💡 valuable perspectives 💡 on market trends and patterns, but 🚫 please note that our analyses are not intended as buy or sell recommendations. 🚫
Instead, they reflect our own 💭 personal attitudes and thoughts. 💭
Follow along and 📚 learn 📚 from our analyses! 📊💡"

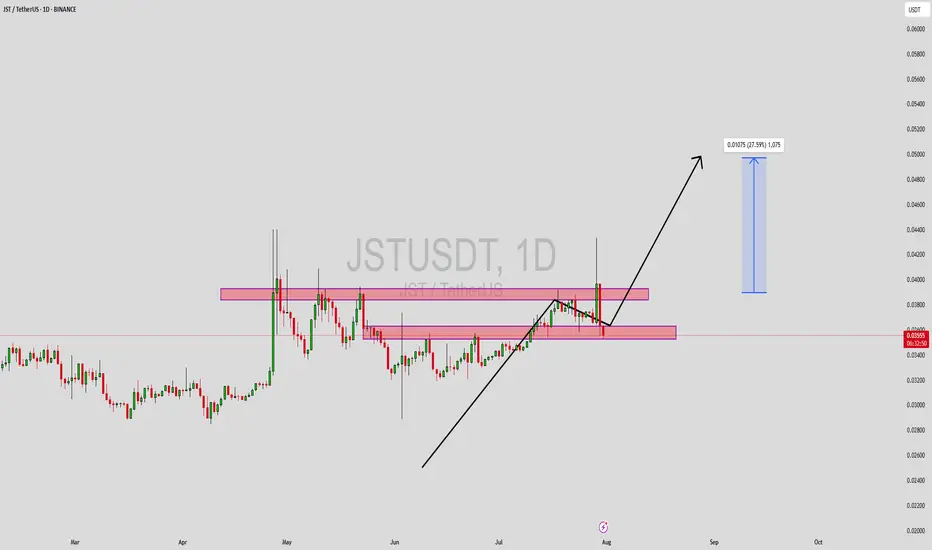
JSTUSDT Forming Bullish MomentumJSTUSDT has recently gained attention among traders as it moves closer to a key breakout level. The chart shows a series of higher lows, indicating underlying bullish momentum despite short-term rejections near resistance zones. The price action reflects a coiling structure with tightening price ranges, hinting at an imminent breakout. Volume has remained consistent, which is often an early sign of accumulation and growing investor interest.
As JSTUSDT continues to test its resistance zone, a successful breakout could lead to a sharp upside move. The projected gain of 20% to 25%+ aligns with the measured move from recent consolidation zones. This movement is supported by market interest in JST, which is a core part of the TRON ecosystem, providing decentralized finance capabilities like stablecoin lending and borrowing. The project’s integration and use within the TRON network continue to attract both retail and institutional investors.
Technically, the price is respecting key support and resistance levels, with clear zones marked out on the chart. The support zone has held strong on multiple tests, making it a potential launchpad for the next leg up. With volume backing the setup, and favorable sentiment across broader market conditions, JST is well-positioned for a breakout rally.
Short-term traders and mid-term investors should keep JSTUSDT on their watchlist, especially as momentum builds near the upper resistance area. If the breakout confirms with a daily close above resistance backed by volume, it may trigger rapid price movement.
✅ Show your support by hitting the like button and
✅ Leaving a comment below! (What is You opinion about this Coin)
Your feedback and engagement keep me inspired to share more insightful market analysis with you!
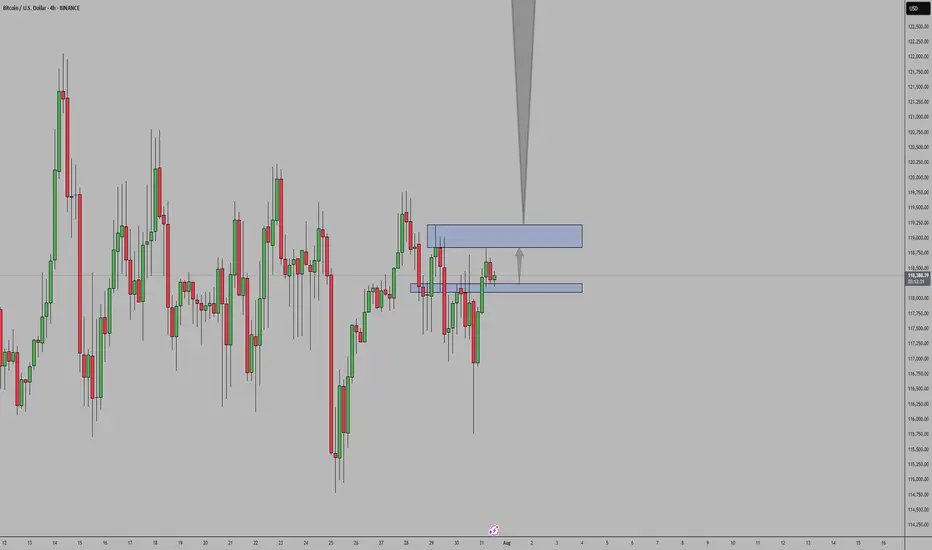
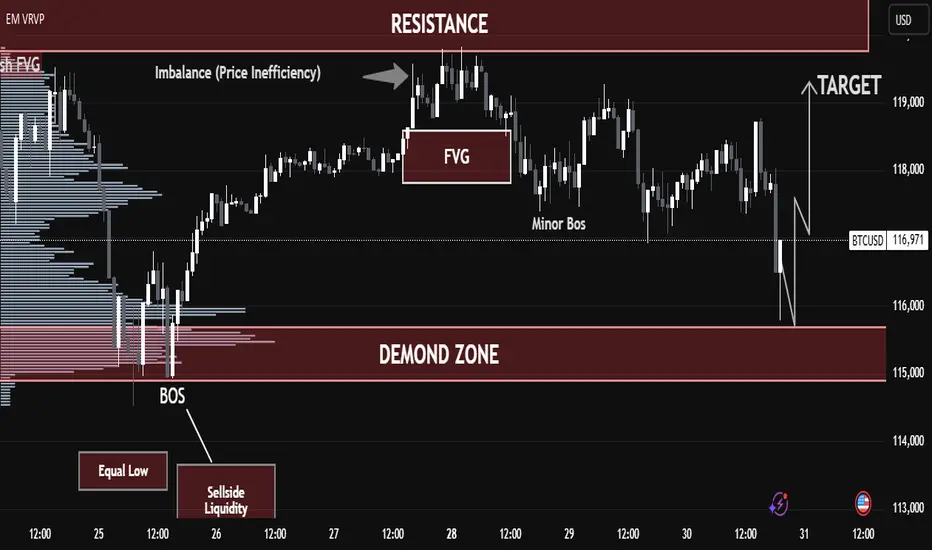
BTC/USD – Strong Buy Opportunity from Demand Zone BTC/USD – Strong Buy Opportunity from Demand Zone
🟢 Technical Outlook:
Bitcoin (BTC/USD) has tapped into a well-defined Demand Zone near 115,000–116,000, showing early signs of a potential bullish reversal. This level aligns with key liquidity zones, smart money concepts, and price inefficiencies — offering high-probability long setups.
🧠 Key Technical Highlights:
🔻 Equal Lows + Sell-Side Liquidity:
Market swept equal lows, grabbing liquidity below support — a common institutional setup before a bullish push.
✅ Break of Structure (BOS):
A prior BOS indicates a shift from bearish to bullish structure after liquidity collection.
📉 Fair Value Gap (FVG):
Price created and respected an FVG after the BOS, validating bullish intent.
📊 Imbalance Filled:
A prior price inefficiency has now been filled, completing a clean move from imbalance back into structure.
📈 Target Zone: 119,000 USD
Marked as the logical next stop — sitting near prior resistance and a liquidity zone.
🎓 Educational Insight:
This is a textbook Smart Money Concept scenario:
Sell-side liquidity sweep
Demand zone tap
Imbalance rebalancing
Shift in market structure
It shows how institutions often engineer liquidity grabs before a large directional move.
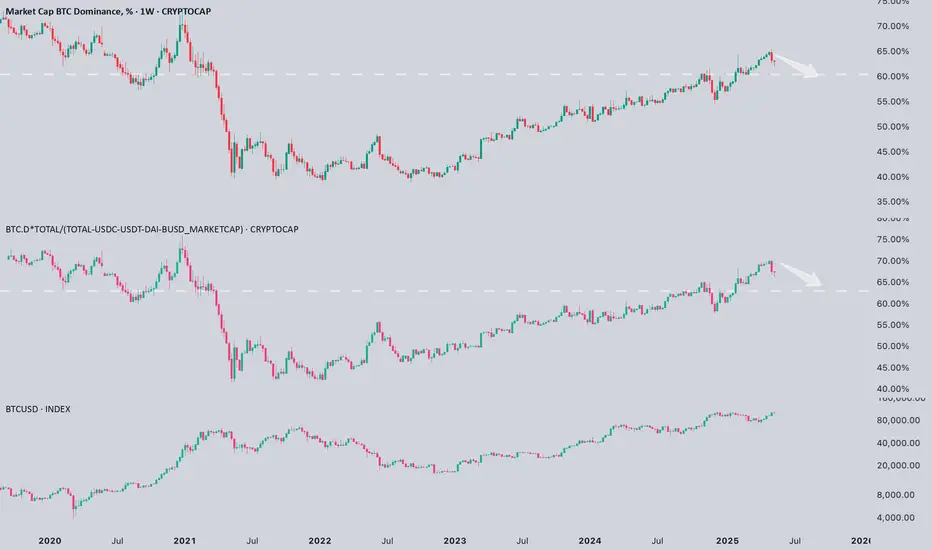
Is Bitcoin dominance finally starting to crack?Is #Bitcoin dominance finally starting to crack?
I think we’re getting the first real signal.
📉 After a strong run, BTC CRYPTOCAP:BTC dominance has rejected from major resistance and started to pull back. Even when adjusted for stablecoins, we’re seeing the same early signs of weakness.
📝 Historically, this kind of shift has been a precursor to capital rotation into altcoins. We might still be far from full-blown altcoin euphoria, but this could be the beginning of a transition from a BTC-led market to a broader risk-on phase, especially when the market starts pricing in a rate cut.
💡 Keep in mind: the biggest alt runs tend to come when BTC consolidates near highs while dominance fades. If this move confirms, it might be time to prepare.
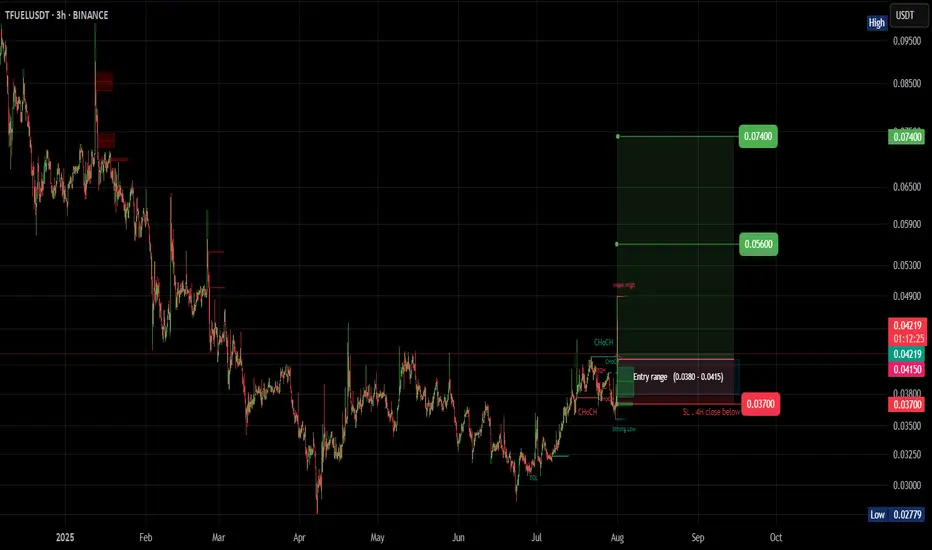
#TFUEL (SPOT)BINANCE:TFUELUSDT
#TFUEL/ USDT
Entry (0.0380 - 0.0415)
SL 4H close below 0.037
T1 0.056
T2 0.075
_______________________________________________________
Golden Advices.
********************
* collect the coin slowly in the entry range.
* Please calculate your losses before the entry.
* Do not enter any trade you find it not suitable for you.
* No FOMO - No Rush , it is a long journey.
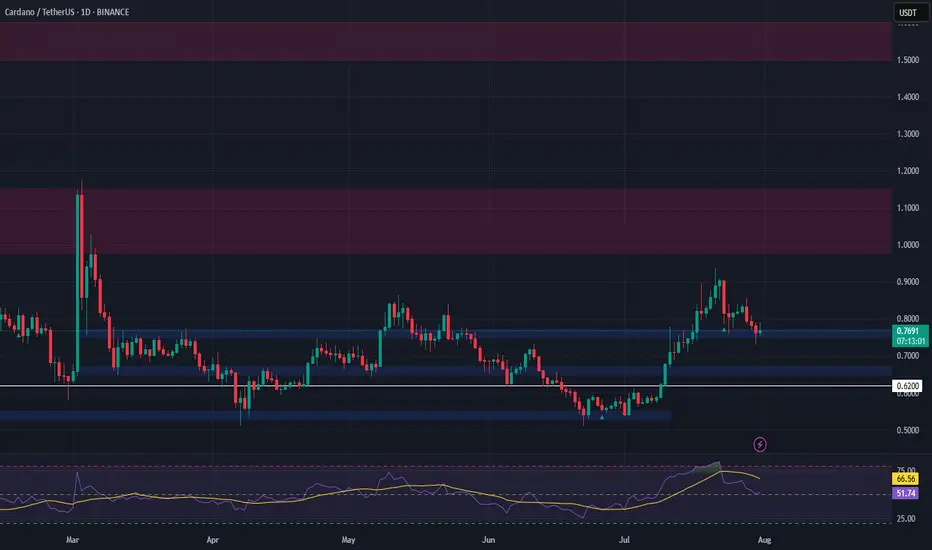
ADA Setup – Eyeing Entry After 70%+ RallyCardano (ADA) has surged over 70% in recent weeks. A healthy pullback is underway, and we’re watching the key support zone for a potential long entry targeting the next leg higher.
📌 Trade Setup:
• Entry Zone: $0.65 – $0.67
• Take Profit Targets:
o 🥇 $0.98 – $1.15
o 🥈 $1.50 – $1.60
• Stop Loss: Just below $0.62
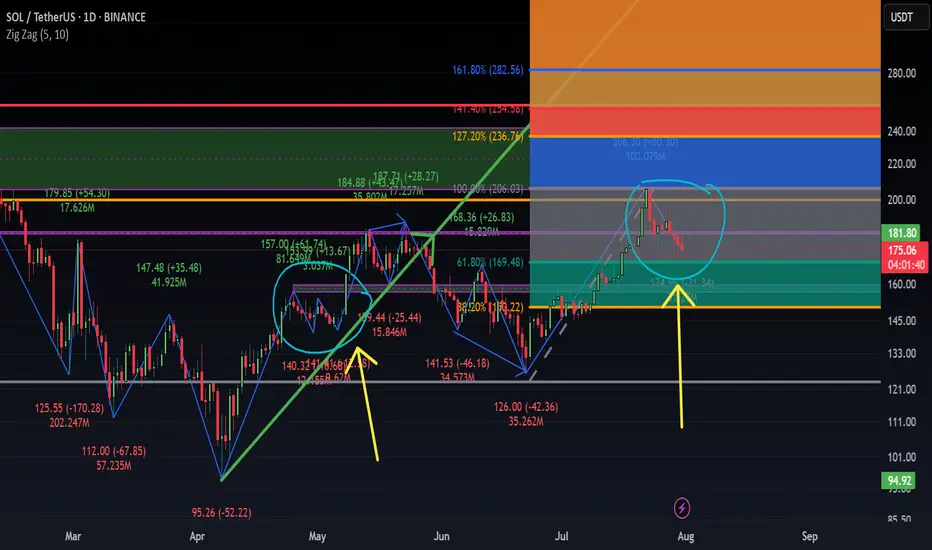
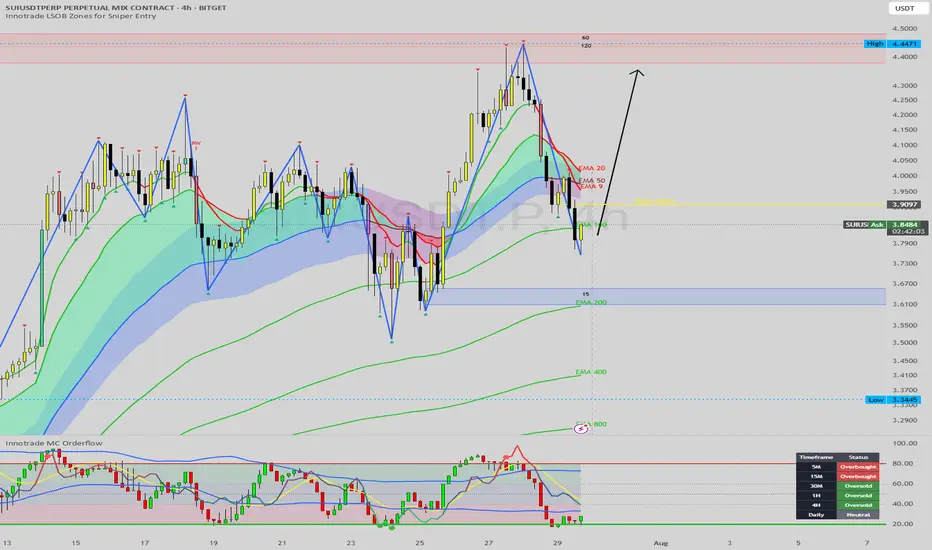
SUI Approaching Major Buy Zone: A High-Confluence Long SetupHello, traders. Today, we're putting SUI under the microscope as it undergoes a sharp but healthy correction following an impressive rally. The price has recently broken below its short-term moving averages, and is now heading directly towards a powerful cluster of technical support. This is a classic "buy the dip" scenario unfolding.
This analysis will provide a step-by-step breakdown of why the $3.60 - $3.70 zone represents a high-probability area for this corrective move to end, and for the primary bullish trend to resume.
The Analysis: A Convergence of Powerful Signals
The strongest trade ideas are not based on one signal, but on multiple, independent factors aligning. Here is the powerful confluence we are observing on the SUI 4H chart:
1. The Primary Bullish Structure:
First, let's establish the market context. The Zig-Zag indicator confirms that the primary market structure is firmly bullish, with a clear series of higher highs and higher lows. The current move is a textbook corrective pullback within this uptrend. Our goal is not to fight the trend but to identify the most logical point for it to continue.
2. The Key Support Cluster (Order Block + EMA 200):
The price is approaching a major floor of support. This floor is composed of two critical elements:
Demand Zone / Order Block: There is a significant demand zone (the blue-shaded box) sitting between $3.60 and $3.70. This is an area where strong buying pressure previously entered the market, and it's likely to act as a solid support level.
The EMA 200: Flowing directly through this demand zone is the EMA 200. This long-term moving average is one of the most significant dynamic support levels in an uptrend. The confluence of a static order block with the powerful EMA 200 creates an incredibly strong support cluster.
3. Multi-Timeframe Momentum Exhaustion (The Key Timing Signal):
This is the crucial timing component. While the price is dropping, our momentum dashboard reveals that sellers are becoming exhausted.
MC Orderflow: The oscillator in the sub-chart is plunging towards the green "Oversold" area, signaling that the downward momentum is getting stretched.
The Dashboard: This gives us a panoramic view of momentum. The 30M, 1H, and 4H timeframes are all simultaneously flashing "Oversold". This is a critical piece of information. It tells us that selling pressure is exhausted across multiple key timeframes, precisely as the price is about to hit a major support cluster. This is a classic recipe for a sharp reversal.
The Potential Trade Plan
Based on this powerful alignment of signals, here is a potential trade plan:
Entry Zone: The support cluster between $3.60 and $3.70 is the ideal zone to look for entries.
Stop Loss: A logical stop loss could be placed just below the demand zone and the EMA 200, around $3.55. A break below this level would invalidate the bullish structure.
Potential Targets:
Target 1: A reclaim of the Daily Open at $3.91.
Target 2: The intermediate resistance and recent swing high in the $4.15 - $4.25 area.
Target 3: A full retest of the major high at $4.45.
Conclusion
We are witnessing a textbook technical setup on SUI. The price is correcting within a confirmed uptrend and is now approaching a massive confluence of support (Order Block + EMA 200), all while multi-timeframe momentum indicators are signaling widespread seller exhaustion. This presents a compelling, high-probability case for a long position.
Disclaimer:
This analysis is for educational purposes only and is not financial advice. Trading cryptocurrencies involves a high level of risk. Always conduct your own research and consult with a licensed financial advisor before making any trading decisions.
BTC Forecast For August & September. The Only Roadmap You Need !This is one is so obvious, its a no brainer , and would likely be very easy to trade as long as you follow this road map i have provided.
The Value Area High at 110k price range is most important upcoming battle line between bull vs bear. If bulls fail to get a strong bounce from 110k and we close at least 2 daily candles below it. Then it would mean bears have full control and the implication of that is that since we would at that point be closing back inside an established Value Area range, formed between Nov 20th to Jul 25th, then it would mean the probability of price selling all the way down to re-test the VAL (value area low) at $91.6k would instantly become very very high.
After re-testing $91.6k we'll watch and see what happens.
It'll either hold after grabbing some liquidity below and stay in the Value Area Range until further notice Or we lose it and the sell off continues. Bear market will be in full swing if that happens and you can bet a ton of weak hands will start to exit due to max pain & cascading long liquidations. Fear index will be back in the red at that point as capitulation starts to set in. Alot of new alts and meme coins will be completely obliterated.
Bullish Continuation Scenario
If bulls get a strong bounce from 110k and don't close back inside the Value Area Range below, then we could continue up to a make a new ATH for a classic trend pullback continuation trade. Once we get back above 115.4k, the dream of a new ATH will become much more realistic. There is an UFA(Unfinished Auction) at 120.8k which is only visible to traders using the market profile or footprint chart. This make poor high and needs to be taking out at some point.
For the Price target to the upside, we would be using the peak formation line of the ExoFade indicator.

"BTC Sweeps Liquidity – Eyeing 115K Reclaim?""BTC Sweeps Liquidity – Eyeing 115K Reclaim?"
🔍 Technical Analysis – BTC/USD
On the 1H chart, Bitcoin (BTC) is currently displaying a textbook smart money structure, with price action following key institutional footprints.
🔑 Key Observations:
Liquidity Grab at Weak Low
Price dipped below the local support (~112,500), sweeping sell-side liquidity and tapping into a possible reversal zone.
Rejection from Demand Zone (Support Area)
A strong reaction occurred right at the support level, suggesting buyer interest is still present.
Order Block & Fair Value Gap
A visible Fair Value Gap (FVG) sits above current price action, aligning with an Order Block near the 115,000 level — this is a key magnet for price to rebalance.
Target Zone
Immediate upside target is 115,000, where an order block lies. If price reaches that level, expect potential short-term resistance or reversal.
Break of Structure (BOS) Confirmations
Multiple BOS and CHoCHs indicate bearish-to-bullish attempts, but the current structure still needs confirmation above 113,500+ for bullish continuation.
🧠 Conclusion & Expectation:
BTC has swept liquidity to the downside and may now seek to fill the FVG and revisit the 115K order block. However, confirmation is required — watch for bullish engulfing candles, volume spikes, or a CHoCH above 113,500.
“Smart money doesn’t chase — it waits for liquidity, then repositions. BTC may be following the same script.”

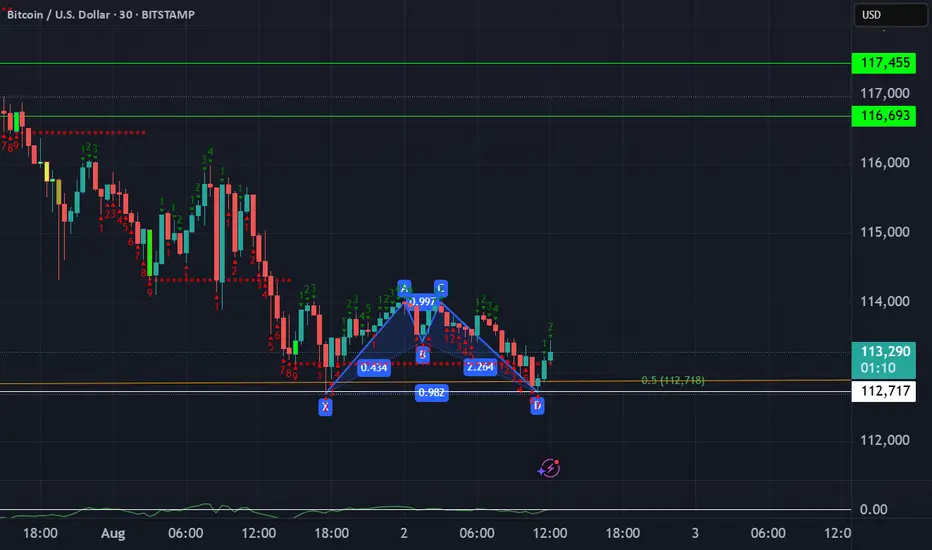
BTC Double BottomFibonacci sequence is a mathematical concept; it appears in various aspects of everyday life and nature. It's not directly used in a calculated way, but its principles are reflected in the patterns we see around us. Its key for traders to pinpoint these reversal areas to keep a positive risk/reward ratio. Bulls will target 116k if this low can be sustained.
ETHUSDT BUYING SETUP !Ethereum (ETHUSDT) is showing a bullish setup as price holds above key support. The market is indicating buyer interest, and a push upward could be expected if momentum continues.
Look for confirmation like bullish candlesticks or a breakout from consolidation before entering. This setup offers a good risk-to-reward opportunity for buyers.
Stay focused, trade with confirmation, and manage your risk properly! 📈🔥

LTC- LitCoin - This is how a Fake Break on Fib looks like This is how a Fake Break on Fib looks like using Weis Wave with Speed Index
Reading the Daily Cha rt
1. Fib Location - Sellers could enter here
2. Largest Up volume wave after a while - also sellers could be hidden in there.
3. Increasing PVR (progressing volume rate) = as we approve the top more volume comes in (sellers)
4. This up wave has the highest Speed Index 10.0S of all the up waves in the trend, that's a HTMU (hard to move up = sellers)
5. The highest PVR bar =sellers
6. Another Abnormal Speed Index 25.5 S - that's another HTMU = more sellers on the up move, price cannot progress upward anymore.
7. and finally down we go with a PRS signal.
All the ingredients for the Short were there. Reading Weis Wave with Speed Index is like reading a book, page after page, until you reach to the last page that the writer has kept the surprise, the only difference is that this is never ending chart book with many stories. This was the story of LTC for now. I think this story has not ended yet and continue to drop to another Fib, the details on the 1HR!.
I hope you enjoy this chart reading lesson using Weis Wave with Speed Index.

$XRP ENJOYERRRs see ya at $1.04-$1.20If we look at the chart of XRP, you can see that since the move in fall of 2024, we've had a massive lack of balance on the chart.
We ran up quickly without testing any levels as support.
That makes me think we're going to see the lack of balance get corrected and the same move is now going to happen in the opposite direction.
The $1.04-1.20 region looks like a good area of support to me.

ETH 4H | Eyes on Support |ETH on the 4H
Bears are having their moment — and that’s fine.
Price is heading lower, with the 200MA around $3200 as the next support. If that breaks, the 0.382 Fib near $3000 is the last line before things get ugly.
My plan? Watch RSI for signs of bullish divergence.
Until then, hold tight.
Always take profits and manage risk.
Interaction is welcome.

SOL/USD Last Level before $143Using a simple fib retracement from June Low to July High, mid 150s is a good buy after we lost $165, but it all depends on BTC. If BTC loses 112k-110, we are going to $140s and potentially the June low. God Speed

BTC- On a Crucial Testing PointBTC Seems to be testing a strong support point, if it bounce back , it's good opportunity to buy, otherwise sell.

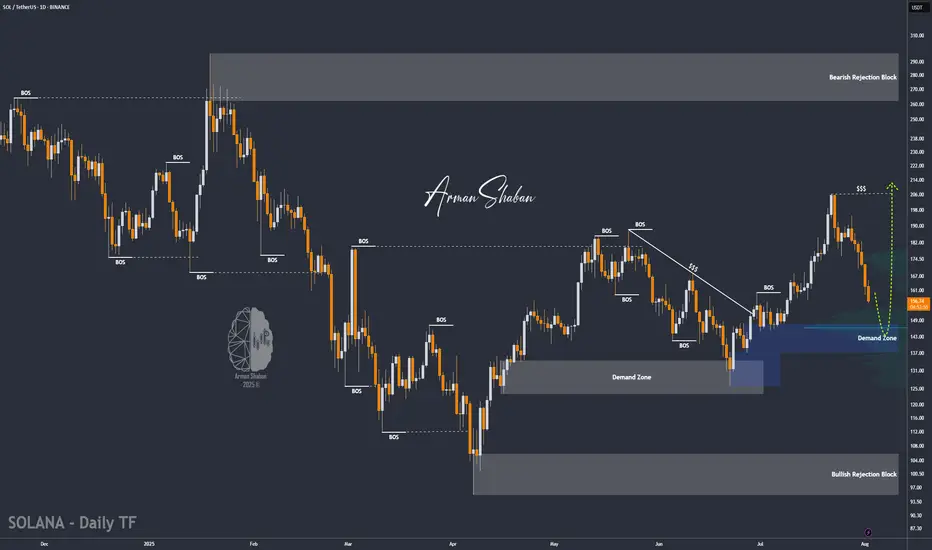
SOL/USDT | SOL Drops 25% – Approaching Key Buy Zone at $136–$148By analyzing the Solana chart on the daily timeframe, we can see that, like the rest of the market, it's undergoing a correction — dropping over 25% from the $206 area so far. Solana is now approaching a highly attractive buy zone between $136–$148, so be sure to closely monitor the price reaction in this range. Bullish targets will be announced soon — stay tuned!
Please support me with your likes and comments to motivate me to share more analysis with you and share your opinion about the possible trend of this chart with me !
Best Regards , Arman Shaban