GOLD & BTC analysisWe did a detailed analysis on Gold and BTC to have our directional bias and we kick off the month of August with a profitable setup.
Crypto market

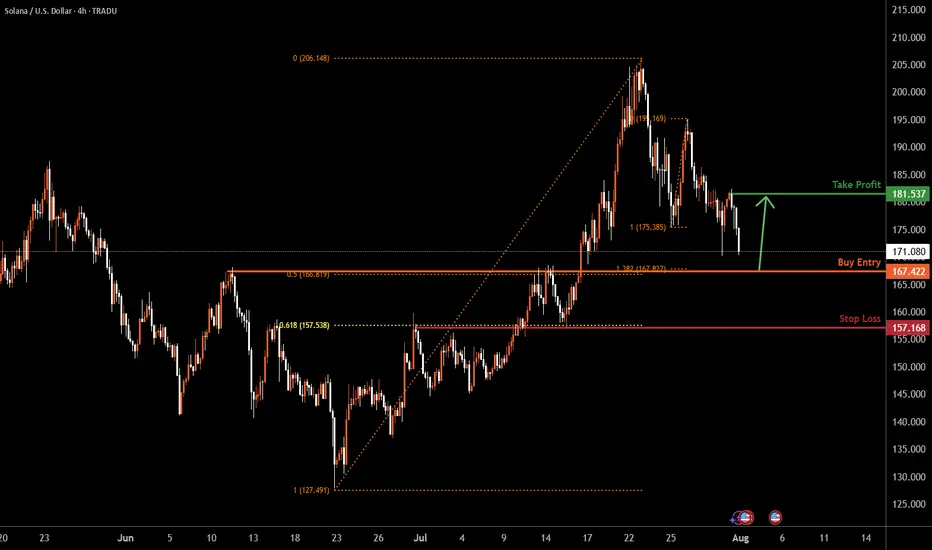
SOLUSD H4 | Bullish bounceBased on the H4 chart analysis, the price could fall to the buy entry, which acts as a pullback support that aligns with the 50% Fibonacci retracement and the 138.2% Fibonacci extension and could bounce to the upside.
Buy entry is at 167.42, which is a pullback support that aligns with the 50% Fibonacci retracement and the 138.2% Fibonacci extension.
Stop loss is at 157.16, which is an overlap support that aligns with the 61.8% Fibonacci retracement.
Take profit is at 181.53, which is a pullback resistance.
High Risk Investment Warning
Trading Forex/CFDs on margin carries a high level of risk and may not be suitable for all investors. Leverage can work against you.
Stratos Markets Limited (tradu.com ):
CFDs are complex instruments and come with a high risk of losing money rapidly due to leverage. 65% of retail investor accounts lose money when trading CFDs with this provider. You should consider whether you understand how CFDs work and whether you can afford to take the high risk of losing your money.
Stratos Europe Ltd (tradu.com ):
CFDs are complex instruments and come with a high risk of losing money rapidly due to leverage. 66% of retail investor accounts lose money when trading CFDs with this provider. You should consider whether you understand how CFDs work and whether you can afford to take the high risk of losing your money.
Stratos Global LLC (tradu.com ):
Losses can exceed deposits.
Please be advised that the information presented on TradingView is provided to Tradu (‘Company’, ‘we’) by a third-party provider (‘TFA Global Pte Ltd’). Please be reminded that you are solely responsible for the trading decisions on your account. There is a very high degree of risk involved in trading. Any information and/or content is intended entirely for research, educational and informational purposes only and does not constitute investment or consultation advice or investment strategy. The information is not tailored to the investment needs of any specific person and therefore does not involve a consideration of any of the investment objectives, financial situation or needs of any viewer that may receive it. Kindly also note that past performance is not a reliable indicator of future results. Actual results may differ materially from those anticipated in forward-looking or past performance statements. We assume no liability as to the accuracy or completeness of any of the information and/or content provided herein and the Company cannot be held responsible for any omission, mistake nor for any loss or damage including without limitation to any loss of profit which may arise from reliance on any information supplied by TFA Global Pte Ltd.
The speaker(s) is neither an employee, agent nor representative of Tradu and is therefore acting independently. The opinions given are their own, constitute general market commentary, and do not constitute the opinion or advice of Tradu or any form of personal or investment advice. Tradu neither endorses nor guarantees offerings of third-party speakers, nor is Tradu responsible for the content, veracity or opinions of third-party speakers, presenters or participants.
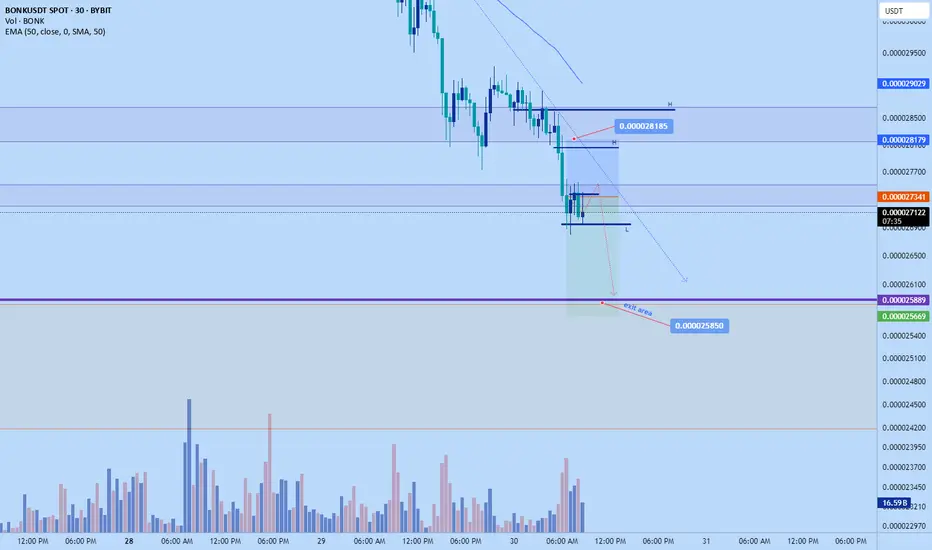
Bonk short to $0.02585Opened a short position on bonk just now. Aiming for 0.02585
Sl: $0.028185 or higher
Roughly 2RR
DTT strategy used - Learn more on X
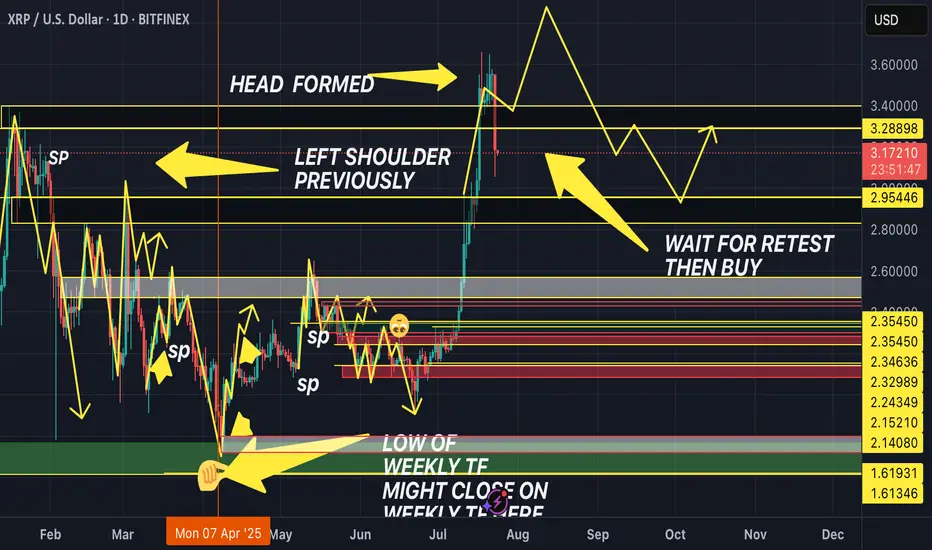
HEAD & SHOULDER DAILY TIME FRAME! (DOUBLE WHAMMY!!!!)The market has previously created a left shoulder. Now, it has broken out of the top of the Resistance and broken back into the support and resistance, about to form the right shoulder.
Wait for retest of the resistance then sell to the support, AND THEN BUY IT BACK TTHE RESISTANCE!! DOUBLE WHAMMMY!!
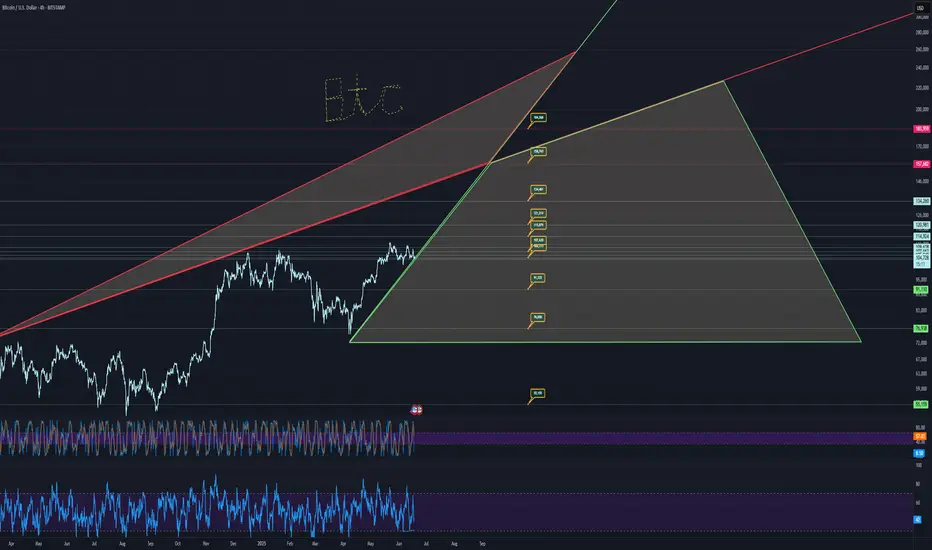
BTC USD 180K BIG HOW?Trends and price targets is how, but realistically, it looks like 134k in the short term.
Drop is wicked if it were to occur, takes price to literally 12k, which you want to go all in if that occurs.
55k is another drop zone.
Otherwise, it looks fairly bullish.
buy zone marked in green,
sell in red.
watch the trends
and price targets are pretty accurate usually.
good luck!!
Custom charts by request.
might be going insanebasically ive been thinking way too much and i am trying to be in set and forget mode because i think this is what happens

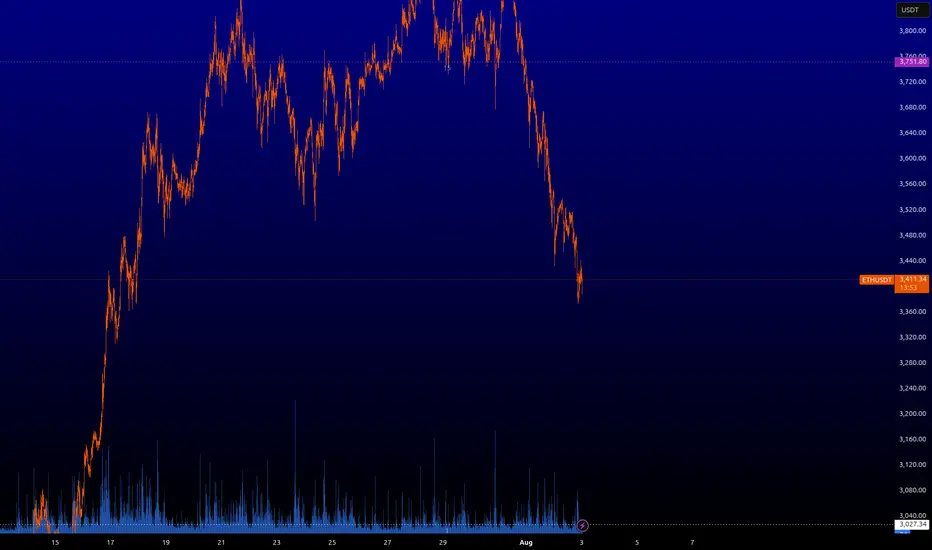
ETH Market Analysis: Where Are We Heading?Current Situation
Ethereum has been on quite a journey in 2025. After climbing steadily since January and reaching nearly $4,000 in July, we're now seeing a pullback with prices around $3,400. This isn't unusual - even in strong uptrends, prices don't move in straight lines.
What The Data Tells Us
Looking at the price patterns and technical indicators:
The big picture remains positive: Despite recent dips, Ethereum is still in an uptrend when looking at the longer timeframe. We're significantly higher than where we started the year.
We're at a decision point: The price is currently sitting at an important level where buyers and sellers have previously shown strong interest.
Support and resistance zones are clear: There have been consistent price levels where Ethereum tends to bounce (support) or struggle to break through (resistance).
Three Possible Paths Forward
Path 1: Resuming the Climb (45% likelihood)
If buyers regain control, we could see Ethereum push back above $3,500, then challenge the recent highs near $3,900. Breaking that level could open the door to the psychologically important $4,000 mark and potentially beyond.
Path 2: Further Pullback (40% likelihood)
If selling pressure continues, Ethereum might drop toward $3,200 first, with stronger support around $3,000. In a deeper correction scenario, we could test the $2,800 area where many buyers stepped in during previous dips.
Path 3: Sideways Movement (15% likelihood)
Sometimes markets need time to digest gains. Ethereum could spend several weeks trading sideways between roughly $3,300 and $3,600 before making its next significant move.
What To Watch For
Breakout signals: A strong move above $3,550 with increasing trading volume would suggest the uptrend is resuming.
Breakdown signals: Falling below $3,350 with conviction could indicate more downside ahead.
Volume patterns: Higher volume on up-days versus down-days would suggest stronger buyer interest.
This analysis is based purely on price patterns and technical indicators, looking at what the market has actually done rather than predictions based on news or sentiment.

Chainklink further dump to $15.12Just now opened a short position on chainlink.
Aiming for $15.12 area
2-2.61RR
DTT strategy applied.
Time sensitive

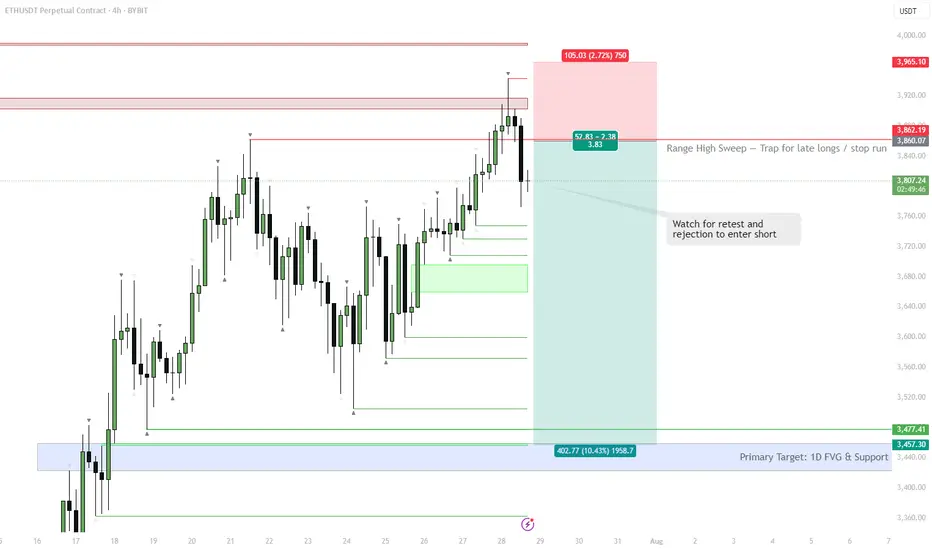
ETH | #4h #short — Range High Sweep & Short SetupScenario:
ETH swept the range high at $3,860, trapping late buyers and triggering stops. Watching for a retest of this level — if it holds as resistance and we see rejection, that’s a short trigger.
Target:
Main target is the 1D FVG at $3,457–$3,477. Possible extension: sweep of range low if selling accelerates.
Why:
Failed breakout setups are classic mean reversion triggers, especially when supported by a visible liquidity pool (FVG) below.
Plan:
Wait for a retest and rejection to confirm short. Partial TP at the FVG zone, manage risk above the sweep high.
Ai16Z on a falling wedgeai16z has been in a bullish falling wedge for the past roughly 200 days. Right now as bitcoin and other cryptos are having a pull back, ai16z is forming a double bottom formation. The pattern is not complete as of yet please wait for a potential break out above the wedge resistance level to enter trade. However if anyone wish to catch the double bottom trade to maximise return you could enter at 10c but like always high risk high return the double bottom could fall further and void this idea. Happy Trading

TOTAL - Gonna Hold My Coins, Wait & See...This is my own experiment, gonna buy the most underrated top 30 coin, the most hated one. Put $5k on it right now and wait until this happens. Maybe this wont work but we will see!

Aerodrome Finance (AERO)Aerodrome (AERO) is showing strong signs of accumulation.
We've been trading within this parallel channel for nearly three months, and it's repeatedly respected both the upper and lower bounds. As we approach the bottom of this range again, it looks like an ideal accumulation zone for long-term holders.
I'm very bullish on this project. Aerodrome is the leading DEX on Base — Coinbase’s Layer 2 network — and with no native Base token currently, AERO is in a prime position to claim that top spot. There's a vacant throne on Base, and AERO is well-positioned to sit on it.

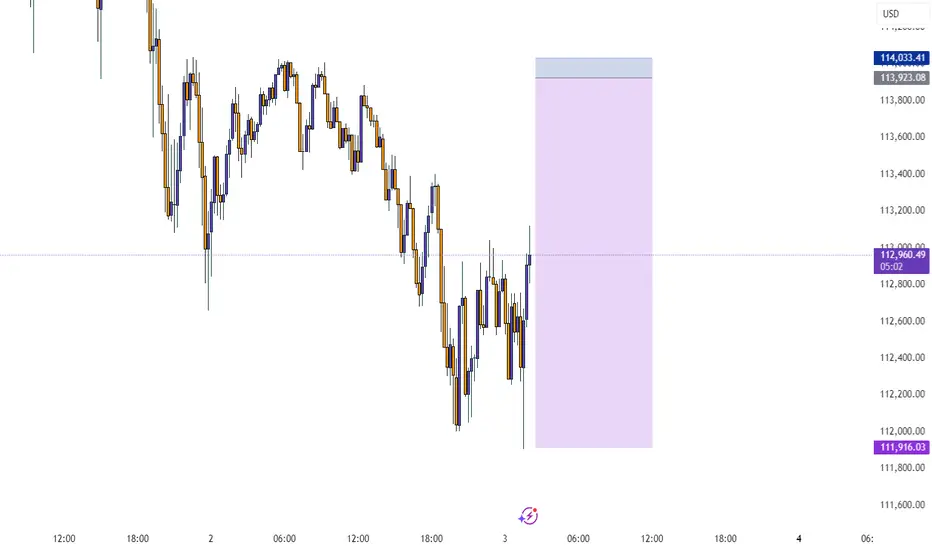
Inflection Zone, Do or Die levelI've drawn up a couple of major pivot points that I expect BITSTAMP:BTCUSD to consolidate at before continuing either up or down.
The market is in my opinion currently feeling a little bit confused and not quite fearful yet but a little bit doubtful anyway. The melt up has been real, and for some painful, as directional movement is at most only half of what matters. So this injection of volatility is welcomed at least by me, and I've been fairly exposed to growth stocks in my port lately.
Based on fibonacci phi channels and other confluences of support locations, it looks like we've turned a corner and are on the way down, but I'd be surprised if we breached 107k and as shown, if that did happen, there is a LOT of underlying supply.
I don't know where we go from here but I wanted to point out this level highlighted in light blue, as its historically been a major line in the sand for BTC.

DOGE dumping will end soon.DOGE has been moving within the ascending channel. After hitting the upper resistant level of the channel, it has been dumping since then. Currently heading down to the bottom of the channel. Price Target $0.16-0.165

Shib pump incomingIt can go a bit lower but the option to start building a position is looking great!!!
Could take some time for an 40x
NOT FIANNCIAL ADVICE!!


The cloud with the help of the Tenkan we will rise!!Shit is about to get real.
I was telling folk to look at BTC @ $19....
This could be the time.
NOT FINANCIAL ADVICE

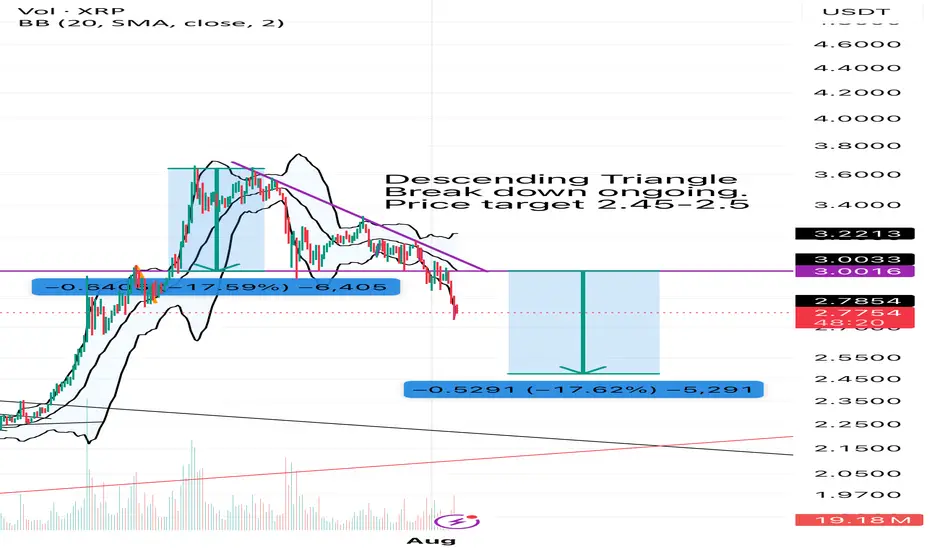
XRP dumping continuesXRP has formed a bearish descending triangle and currently broken down the neck line and continues to dump. This dump will end near $2.45-$2.5 range. Good Luck!
BTC next bull run after taking restAs is clear, BTC has made a new high, and we should wait for the next bullish entry after a retracement.

BTC/USD has formed a symmetrical triangle pattern on the 1-hour Price has broken downwards from the consolidation zone, signaling potential bearish momentum. If selling pressure continues, the projected target aligns with the measured move from the pattern’s height, indicating a possible decline toward the next major support zone. Traders should monitor volume for confirmation and manage risk accordingly.

ETHUSD : Key levelsHere is a list of key levels. All of them will be interesting to the market, but when exactly from them will be a bounce I will inform in the next posts. It is foolish to just wait for a bounce from them. Stay tuned for the next posts.