BNB Binance Coin: Lesson 15 methodology did the job again
Lesson 15 methodology (annotations in sync with the chart):
1. Largest up volume wave after a while - sellers might be in there.
2. Placed AVWAP and waited for price to cross downwards and pullback again on AVWAP
3. HTMU (hard to move up) - Abnormal Speed Index 4.6S at the top
4. Entry short signal PRS with abnormal SI 4.8.2 (price has a hard time to move up - absorption)
Simple as that. Enjoy!
Crypto market

FISUSDT.P 15m – Bearish Rejection at Fib Zone | Short SetupPrice faced strong rejection at the 0.13280 high, forming a double top and now pulling back. Current move aligns with Fibonacci retracement zones, with price reacting near the 50–61.8% zone. MACD histogram is weakening, signaling bearish momentum.

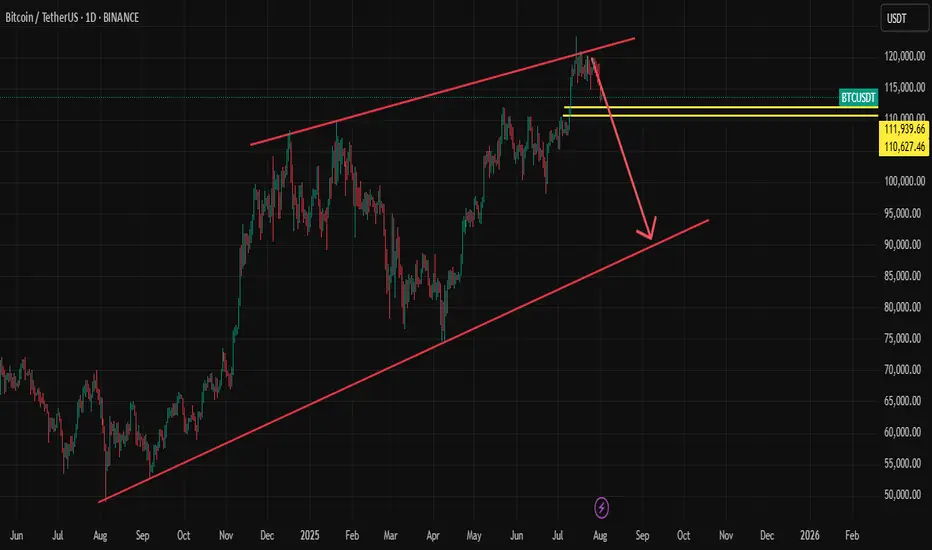
BITCOIN - Price can turn around and start to move upHi guys, this is my overview for BTCUSD, feel free to check it and write your feedback in comments👊
The price reversed its prior downtrend with a decisive breakout from a falling channel.
This breakout triggered a strong upward impulse, which then began to consolidate into a large symmetrical pennant.
However, the price recently failed to hold the lower support trendline of this pennant and broke to the downside.
The asset is currently trading just below this broken trendline, in what appears to be a liquidity grab.
To continue upwards, buyers must now overcome the immediate resistance located at the $116300 level.
I expect that this breakdown was a fakeout, and the price will soon reverse, break through the $116300 resistance, and continue its rally toward the $121000 target.

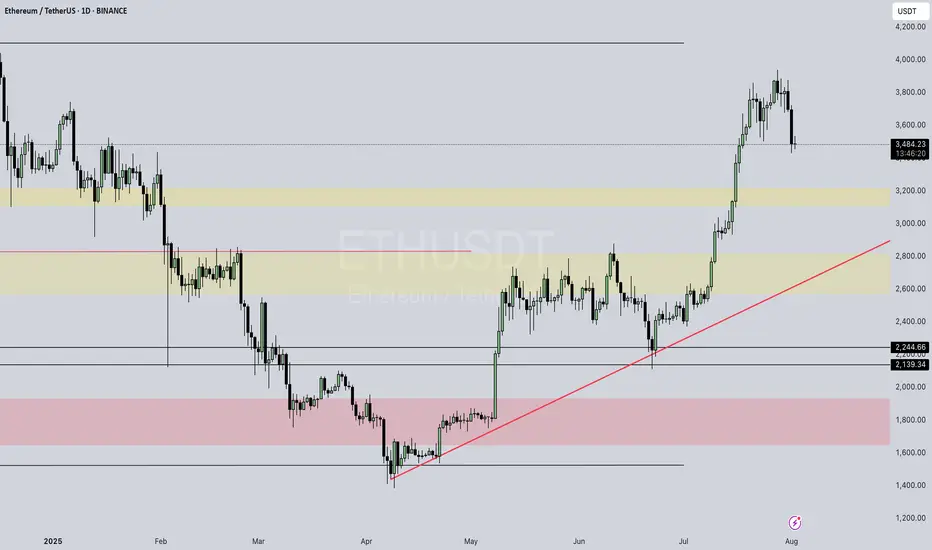
Eth / UsdtBINANCE:ETHUSDT
### 📈 **Ethereum (ETH/USDT) Update – Technical Snapshot**
💵 **Current Price:** \~\$3,490
🔺 **Intraday High:** \$3,670 | 🔻 Low: \$3,453
---
### 🧱 **Support Zones**
✅ **\$3,500–\$3,600** → Key short-term demand zone
✅ **\$3,000–\$3,200** → Strong mid-term cushion
✅ **\$2,000–\$2,500** → Long-term on-chain investor base
⚠️ **\$2,120** → If broken, risk accelerates toward \$2,000
---
### 📉 **Resistance Zones**
🚫 **\$3,860–\$3,900** → Breakout zone = Bullish confirmation
🚫 **\$4,100–\$4,500** → Major zone with historic pressure
🚀 **\$5,000–\$5,300+** → ATH targets if macro + ETF narrative holds
---
### 📊 **Strategy Overview:**
| 🧭 Scenario | 📌 Strategy |
| ------------------------ | --------------------------------------------------------------- |
| ✅ **Bullish Bias** | Hold above \$3,600 → eyes on \$3,900–\$4,000 next |
| 💥 **Breakout Play** | Clean break above \$4,500 = open skies toward \$5,000–\$5,300+ |
| 🧯 **Bearish Risk** | Below \$3,500 could revisit \$3,000 or \$2,500 support bands |
| ⛔ **Critical Breakdown** | Breach under \$2,120 = watch for strong downside toward \$2,000 |
---
### 🧠 **Final Thoughts**
ETH is in **consolidation near highs**.
• Volume & ETF inflows are key catalysts
• Indicators like **RSI, MACD, Fib zones** can help confirm setups
---
⚠️ **Disclaimer:** Not financial advice. Always **DYOR** and manage your risk wisely. 🧠📉
Aimonica / UsdtGATEIO:AIMONICAUSDT
### **Aimonica Brands / TetherUS (1h) - Gate.io**
- **Price**: 0.001769 (+0.17%, +0.000003)
- **High/Low**: 0.001781 / 0.001752
- **Buy/Sell**: 0.001769 (BUY/SELL at same price)
- **Key Levels**:
- **Resistance**: 0.001972, 0.002000
- **Support**: 0.001700 (D), 0.001608
- **Market Sentiment**: Neutral/minor bullish (no strong momentum).
**Summary**: Slight uptick, low volatility. Watch for breakout above 0.001972 or dip below 0.001700.
---
### **⚠️ Disclaimer**
This analysis is for informational purposes only and does not constitute financial advice. Cryptocurrency trading involves high risk, and past performance is not indicative of future results. Always conduct your own research (DYOR) and consult a financial advisor before making investment decisions.

ALCH / Usdt BINANCE:ALCHUSDT.P
### ALCH / TetherUS Perpetual Contract (1h) - Binance
- **Price**: 0.16361 (-0.44%, -0.00073)
- **High/Low**: 0.16458 / 0.16310
- **Buy/Sell**: 0.16356 (BUY) / 0.16353 (SELL)
- **Levels**: Support at 0.16029, Resistance at 0.17000
- **CVD (1D)**: Mixed volume (1.17M to 1.53M)
- **OI (Open Interest)**: ~407M (stable)
- **Volume (ALCH)**: 1.2M
- **Sentiment (Trendmaster)**: Neutral (51.79M)
**Summary**: Slight bearish movement, low volatility, neutral sentiment. Watch key levels (0.16029 support, 0.17000 resistance).
Disclaimer : Not Financial Advice

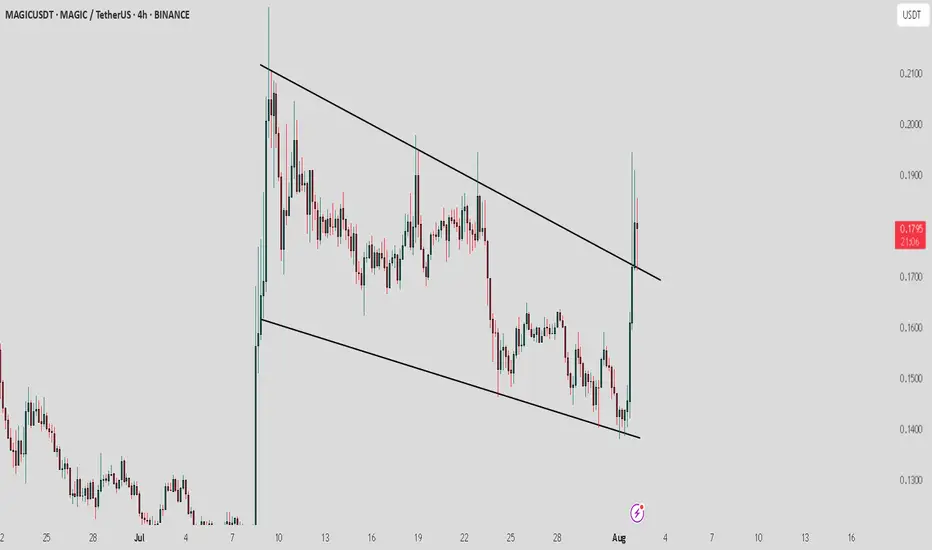
MAGIC/ USDT: Retest is in progress, keep a watch on confirmationMAGIC / USDT has broken out from the Trendline resistance and retest is still in progress . However, the market conditions are not ideal right now.
Bullish scenario : If the price holds above the breakout level and the retest is confirmed, the next target could be 0.19–0.21.
Bearish scenario : A failure to maintain above the breakout level may lead to a drop back to 0.15 or 0.13.
Pro Tip: Use tight stop-losses below the breakout point. Wait for confirmation before committing larger positions. Keep an eye on BTC dominance
XRPUSDT - range projection Measures the possible price projection for XRP x0 . The large whale of over 1 billion in volume makes a good case that someone with smarts knows that this asset has a bright future. the platform where the exchange was made couldn't fill quick enough. Generally a whale or even a mini whale will be expecting to double their investment to take money off the table and that usually happens at the last resistance, so if the last solid resistance was a $ 3:00 you can expect a buy price of around $ 1:50...... anything lower than that is a bonus to stay on top of any possible draw down.

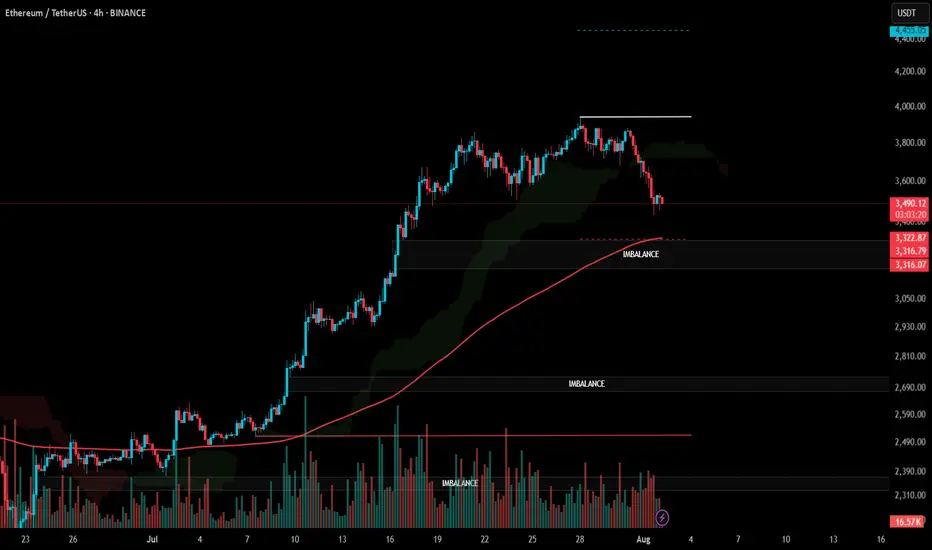
#ETH Update #6 – Aug 02, 2025#ETH Update #6 – Aug 02, 2025
Although Ethereum may seem like it has dropped significantly, it still hasn’t completed the correction of its last impulsive move. If we are to say a proper correction is happening, Ethereum must pull back to the $3,300 zone. If it continues upward without reaching this level, the risk of a deeper retracement increases. That’s why it would be much healthier for Ethereum to extend this pullback and complete the correction around $3,300.
If this correction is completed, the next target will be around $4,450. There is also an imbalance zone around $3,300, and since the price is already close, it might aim to fill that as well — possibly even reaching down to the $3,200 level. Contrary to much of the current market sentiment, Ethereum is heading toward a correction in a very healthy manner, and I believe completing this move would be the best scenario.
Downtrend not over yet !First upside attact till $171.
Then continue about to $150.
Up for 2 days, down for 2-4 days last time before the next mid term uptrend.

Bitcoin buy setupHi everyone.
I think this area has a good potential to set an order and take at least 1% profit out of it..
Let's see how it reacts to this level...
Please consider the risk management.
Goodluck

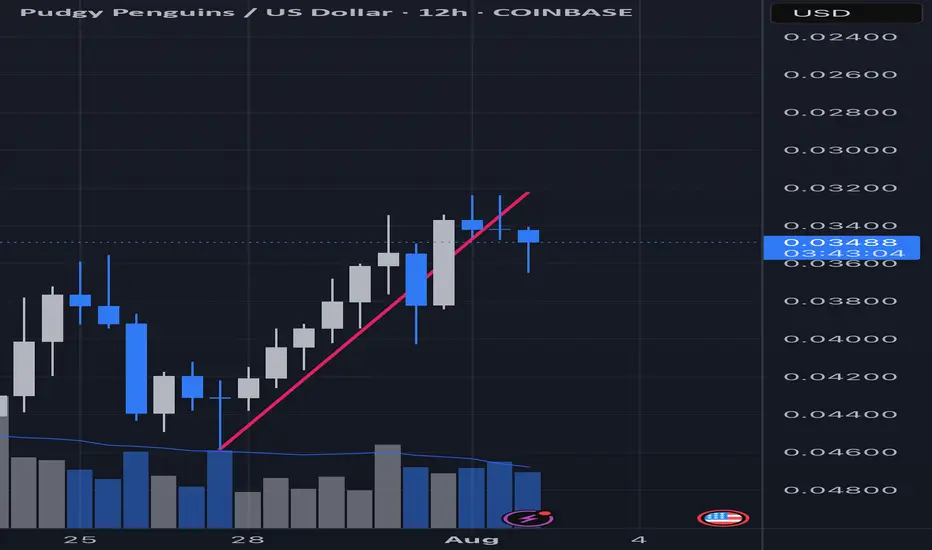
Pengu inverse 12 hourOn the inverse chart I believe what we are seeing is a trend line break followed by a failed reclaim. This then lead to two swing high fails and is now starting its way into continuation (UP). On the hourly I believe it is currently on the cusp of its last “gasp” as it’s creating the peak of its rounded bounce. Still a few hours for this candle to confirm but at this moment I am anticipating acceleration towards ATH.
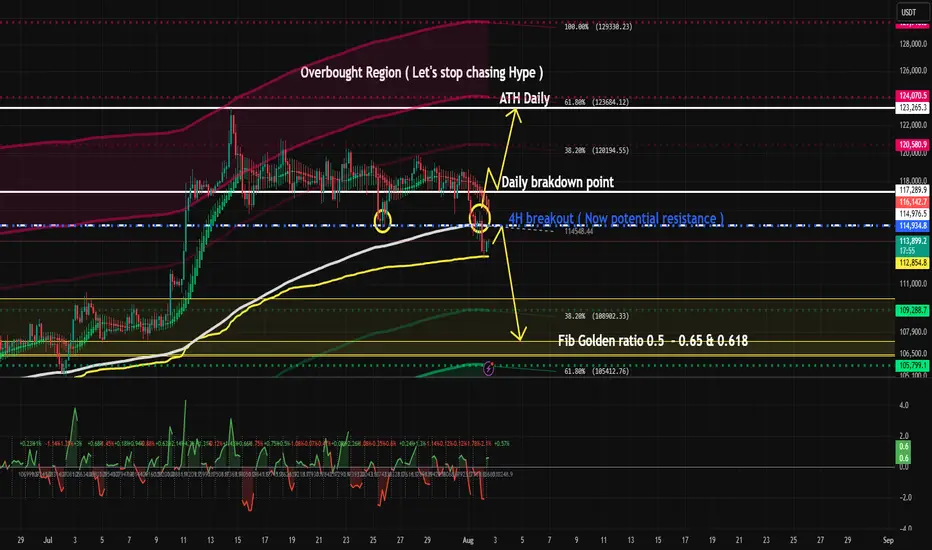
Overhyed Punishment This is what happens when everyone starts to fomo.
Lucky things, I sold some of my Altcoin with profit when BTC went into overbought band as in my chat.
BTC is bearish as long as below 117.6 to 118k :) . Good luck
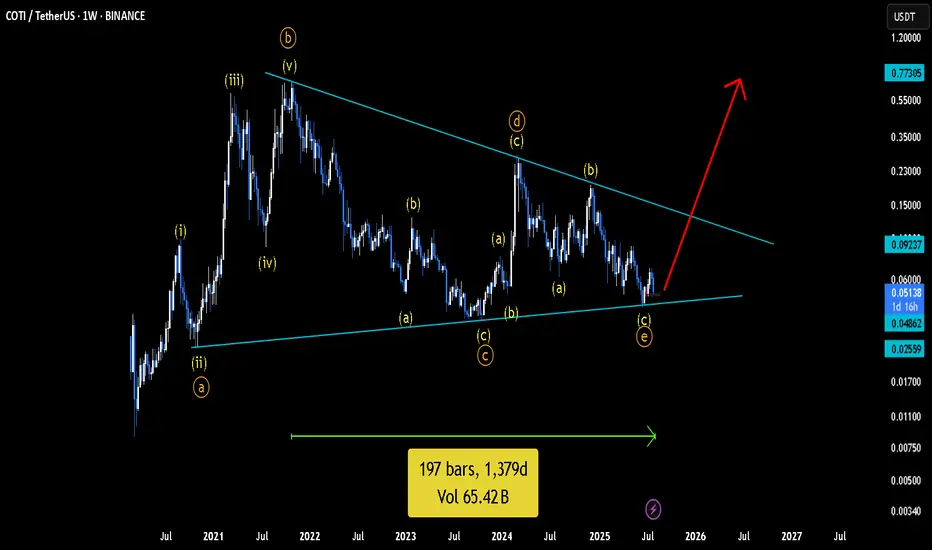
Long-Term Technical Outlook: Critical Decision Point Approaching
The chart illustrates a long-term technical structure where the price has been following an ascending channel after a prolonged bearish trend. However, recent price action indicates a breakdown below the green ascending trendline, raising concerns about a potential shift in market sentiment.
Currently, the $117 level is acting as a pivotal support zone. A sustained breakdown below this level — and more critically, below the red lower trendline — would validate the bearish scenario. This could trigger a deeper correction phase, with downside targets aligned along the red projection path. Such a move may lead to significantly lower price levels in the medium to long term.
🔽 Bearish Scenario:
If the price fails to hold above $117 and breaks below the red trendline, this would confirm the start of a bearish leg. Based on historical structure and projected trajectories, this could result in a descent toward the $93 level initially, with the possibility of extending further downward depending on market conditions.
🔼 Bullish Scenario:
On the other hand, if the price manages to reclaim the green trendline and more importantly, stabilize above the $204 resistance zone, it would signal renewed bullish strength. Such a move would open the path toward higher highs, potentially re-entering the previous upward channel and continuing the macro uptrend.
🧭 The price structure is now approaching a decisive zone, where either a confirmation of bearish continuation or a bullish recovery will likely unfold. Both scenarios have been visually outlined — green lines indicating bullish continuation, and red lines representing bearish momentum.
📌 Note: This analysis is for educational purposes only and should not be interpreted as financial advice.
One of these lines will be right..I expect a pump in the next 2 days otherwise we will fall and continue on the next support line. Odds are 70/30

BTC VS AI ?Hi
I had asked AI the probabilities and projection from previous moves.
So here goes; as you know accuracy is vague and shall not be absorb as 100%
Just analysis and probabilities.
Need clearer confirmation when taking a trade .
Given that the current price is 113,000, let's analyze whether the price has extended beyond previous retracement projections and then develop the next projection accordingly.
Recap from previous data:
Second move: price moved from 99,000 to 122,000
Projected retracement price (29.41%) was approximately 115,236
Current price at 113,000 is below 115,236 (projected retracement), meaning it has retraced more than expected before potentially continuing upward.
Interpretation:
Since 113,000 < 115,236, the price has actually retraced deeper than initially projected from the previous move.
This could suggest a stronger correction or weakness in the upward movement before continuation.
If the price started at 122,000 high and retraced below the anticipated retracement level, it may find support around current or slightly lower levels before attempting to move higher again.
Next projection based on current price of 113,000:
New retracement % on second move:
Move up: 122,000 - 99,000 = 23,000
Actual retracement: 122,000 - 113,000 = 9,000
Actual retracement % = (9,000 / 23,000) × 100 ≈ 39.13%
Updated retracement level is closer to a Fibonacci 38.2% retracement level, which is a common retracement level in markets.
Project next upward move:
Use the previous average upward move for projection: 28,500 (from prior analysis).
Starting point for next move projection: 113,000 (current price after retracement)
Next projected high = 113,000 + 28,500 = 141,500
Probabilities:
Retracement around 38.2% usually has a probability around 20-25%, slightly less frequent than 29-30%, but still common.
Uptrend continuation probability after retracement remains >60% if the trend is strong .
Summary Table with updated data:
Feature Value
Current Price 113,000
Previous High 122,000
Move Up Range 23,000
Actual Retracement Amount 9,000
Actual Retracement % 39.13%
Projection for Next High 141,500
Probability of 39% Retracement 20-25%
Probability of Uptrend Continuation >60%
Conclusion:
The price has retraced more than initially projected from previous data but still within reasonable common retracement levels (around 38%).
Assuming the uptrend holds, the next price move could push toward approximately 141,500.
It’s advisable to watch key support levels near 113,000 for signs of reversal or further retracement.
All the best
Lets see in we can trust it
Not a guru

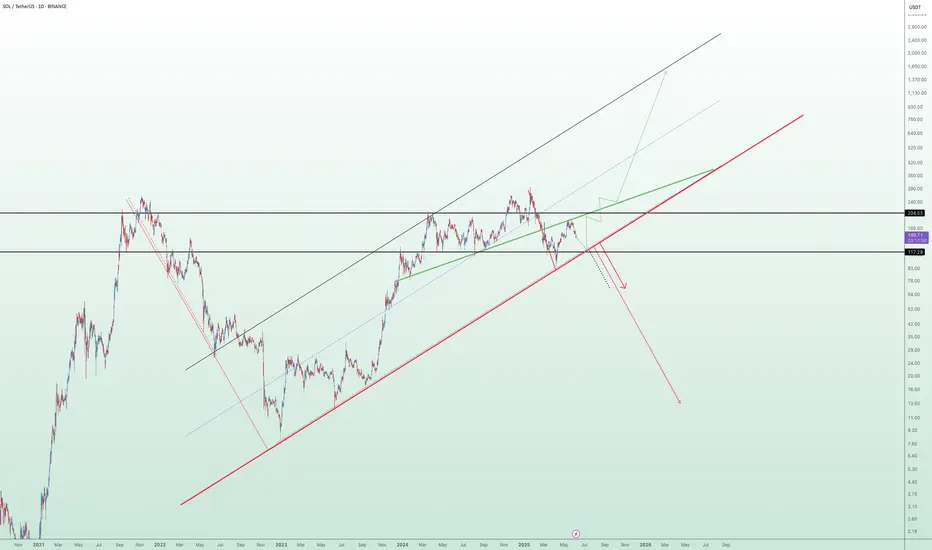
SOL BEARISH CONTINUATIONAs the market continues to create new lows, something caught my eye.
3 areas of unwicked impulsive moves (FVG's) lying around 165.18 - 166.80, 167.65 - 169.69 and 170.32 - 172
With this, I identified two order blocks
.
I'm traditionally wired to prefer the latter because there's more confluence factors;
A liquidity pool 169.70 - 170.3 established by price struggling to close above that level followed immediately by a FVG into an OB.
Price would have an instant reaction downwards if it traded to those levels.
However, the buying pressure might not be sufficient to push price to those levels before the crash.
Hence the other order block.
I'd be paying close attention to observe how it plays out.

BTC 108K - 112K ZONE Why 108k to 112k zone is important?
Bitcoin recently made a new all-time high and is now undergoing a healthy correction — nothing to worry about.
The $108,000 to $112,000 zone is a key support area due to three major factors:
1. Strong previous support level
2. A daily trendline aligning with this zone
3. 50% Fibonacci retracement of the recent impulse move
If this support holds, there's a strong possibility Bitcoin will form a new ATH around $130,000 to $140,000.
DON'T PANIC wait for confirmation and see the magic 🚀 🚀

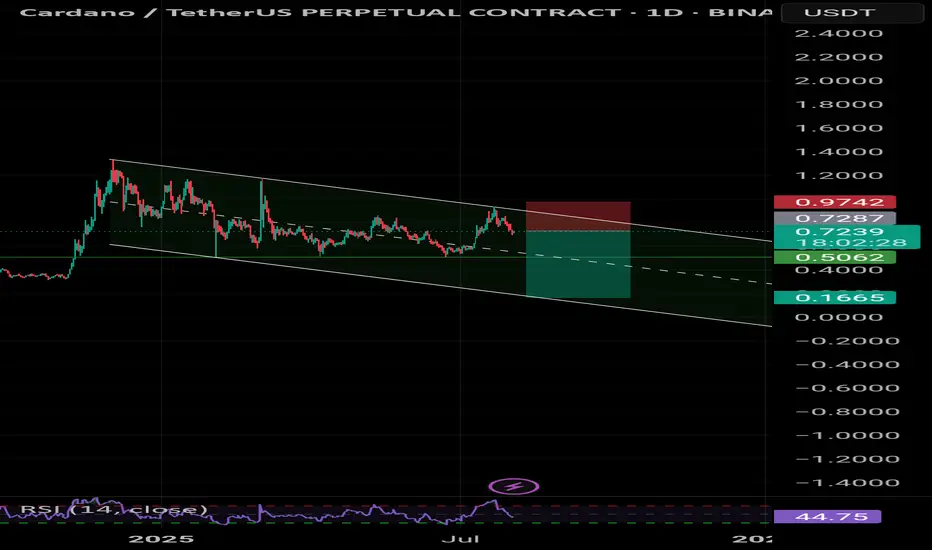
Cardano sellll shorts All markets have TB in August.
Cardano sellll short
Tp1:0.50
Tp2:0.44
Tp3:0.29
Tp4:0.16😄😄😄😄😄
Sui chance for +60% on this zoneSui continue to grap liquidation but on the monthly and weekly timeframe we are still bullish.
I just saw good zone for trade. At 3.15 we have daily EMA + fibonacci 0.64 + Daily FVG.
I will suggest to add some leverage because invalidation is close to 2.9.
In this mid term bull market of altcoins we can see that SUI has good performance.
Ivan

BTCUSD Swing outlookSwing Outlook on BTCUSD!
8H Timeframe Analysis
Trend Bullish
Looking for buys on discounted levels
