XRPUSDT - range projection Measures the possible price projection for XRP x0 . The large whale of over 1 billion in volume makes a good case that someone with smarts knows that this asset has a bright future. the platform where the exchange was made couldn't fill quick enough. Generally a whale or even a mini whale will be expecting to double their investment to take money off the table and that usually happens at the last resistance, so if the last solid resistance was a $ 3:00 you can expect a buy price of around $ 1:50...... anything lower than that is a bonus to stay on top of any possible draw down.
Crypto market

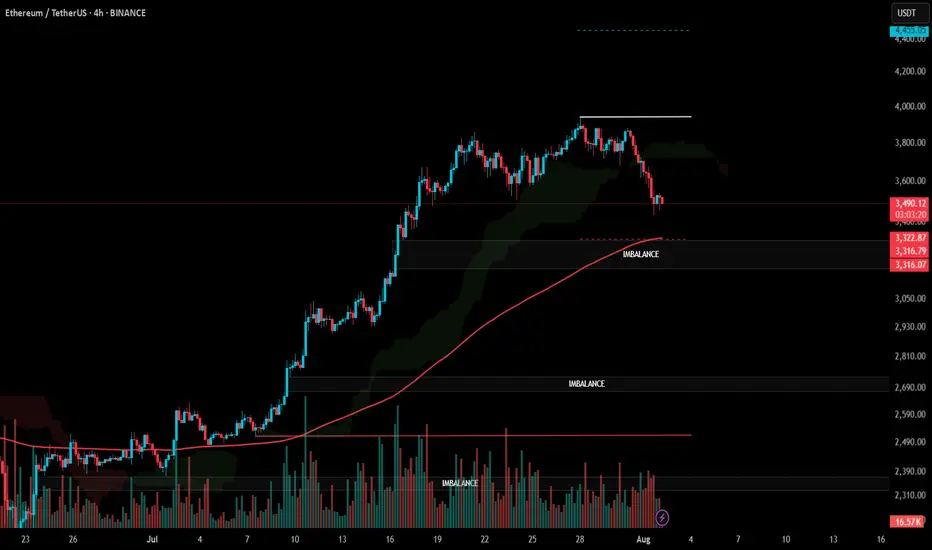
#ETH Update #6 – Aug 02, 2025#ETH Update #6 – Aug 02, 2025
Although Ethereum may seem like it has dropped significantly, it still hasn’t completed the correction of its last impulsive move. If we are to say a proper correction is happening, Ethereum must pull back to the $3,300 zone. If it continues upward without reaching this level, the risk of a deeper retracement increases. That’s why it would be much healthier for Ethereum to extend this pullback and complete the correction around $3,300.
If this correction is completed, the next target will be around $4,450. There is also an imbalance zone around $3,300, and since the price is already close, it might aim to fill that as well — possibly even reaching down to the $3,200 level. Contrary to much of the current market sentiment, Ethereum is heading toward a correction in a very healthy manner, and I believe completing this move would be the best scenario.
Downtrend not over yet !First upside attact till $171.
Then continue about to $150.
Up for 2 days, down for 2-4 days last time before the next mid term uptrend.

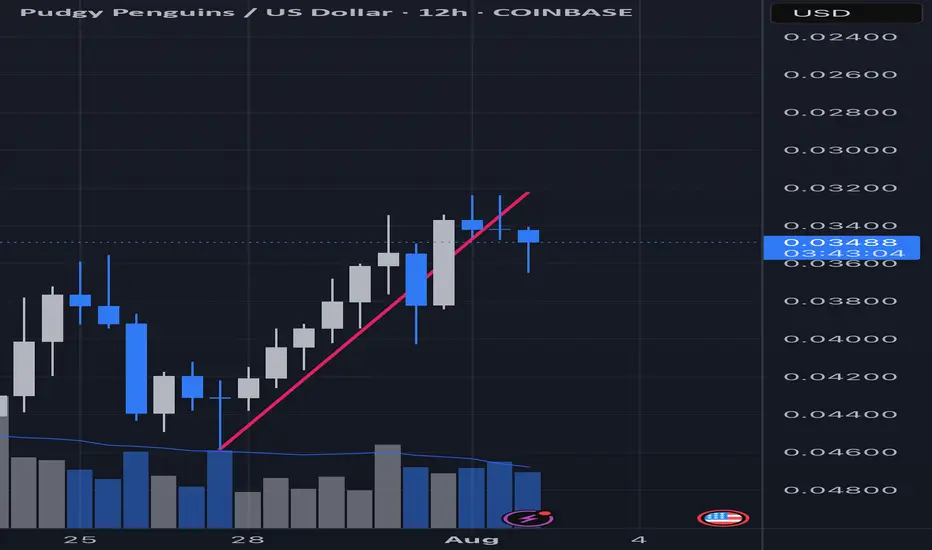
Pengu inverse 12 hourOn the inverse chart I believe what we are seeing is a trend line break followed by a failed reclaim. This then lead to two swing high fails and is now starting its way into continuation (UP). On the hourly I believe it is currently on the cusp of its last “gasp” as it’s creating the peak of its rounded bounce. Still a few hours for this candle to confirm but at this moment I am anticipating acceleration towards ATH.
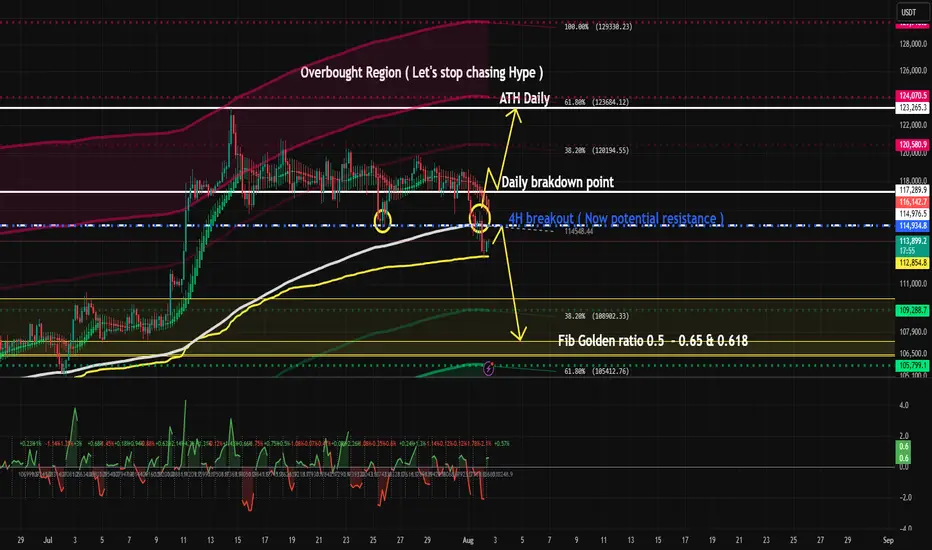
Overhyed Punishment This is what happens when everyone starts to fomo.
Lucky things, I sold some of my Altcoin with profit when BTC went into overbought band as in my chat.
BTC is bearish as long as below 117.6 to 118k :) . Good luck
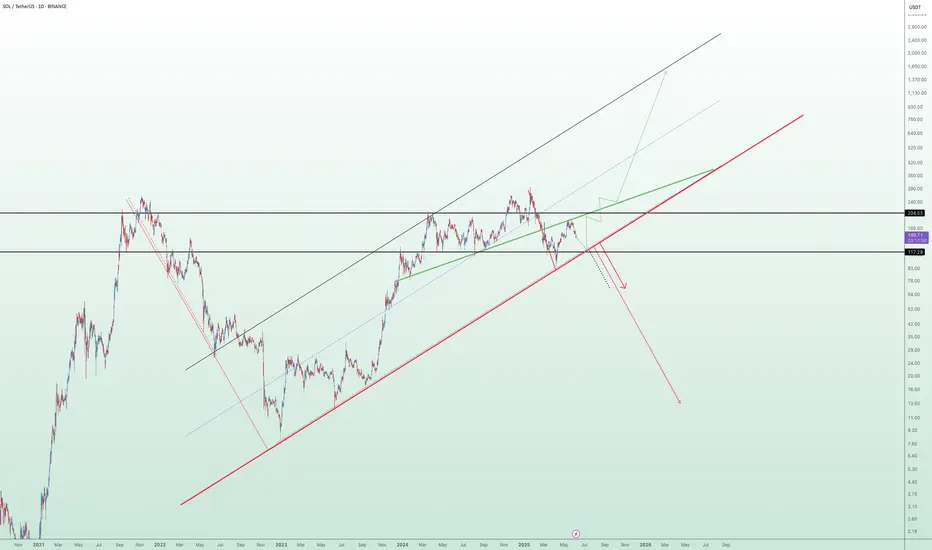
Long-Term Technical Outlook: Critical Decision Point Approaching
The chart illustrates a long-term technical structure where the price has been following an ascending channel after a prolonged bearish trend. However, recent price action indicates a breakdown below the green ascending trendline, raising concerns about a potential shift in market sentiment.
Currently, the $117 level is acting as a pivotal support zone. A sustained breakdown below this level — and more critically, below the red lower trendline — would validate the bearish scenario. This could trigger a deeper correction phase, with downside targets aligned along the red projection path. Such a move may lead to significantly lower price levels in the medium to long term.
🔽 Bearish Scenario:
If the price fails to hold above $117 and breaks below the red trendline, this would confirm the start of a bearish leg. Based on historical structure and projected trajectories, this could result in a descent toward the $93 level initially, with the possibility of extending further downward depending on market conditions.
🔼 Bullish Scenario:
On the other hand, if the price manages to reclaim the green trendline and more importantly, stabilize above the $204 resistance zone, it would signal renewed bullish strength. Such a move would open the path toward higher highs, potentially re-entering the previous upward channel and continuing the macro uptrend.
🧭 The price structure is now approaching a decisive zone, where either a confirmation of bearish continuation or a bullish recovery will likely unfold. Both scenarios have been visually outlined — green lines indicating bullish continuation, and red lines representing bearish momentum.
📌 Note: This analysis is for educational purposes only and should not be interpreted as financial advice.
One of these lines will be right..I expect a pump in the next 2 days otherwise we will fall and continue on the next support line. Odds are 70/30

BTC VS AI ?Hi
I had asked AI the probabilities and projection from previous moves.
So here goes; as you know accuracy is vague and shall not be absorb as 100%
Just analysis and probabilities.
Need clearer confirmation when taking a trade .
Given that the current price is 113,000, let's analyze whether the price has extended beyond previous retracement projections and then develop the next projection accordingly.
Recap from previous data:
Second move: price moved from 99,000 to 122,000
Projected retracement price (29.41%) was approximately 115,236
Current price at 113,000 is below 115,236 (projected retracement), meaning it has retraced more than expected before potentially continuing upward.
Interpretation:
Since 113,000 < 115,236, the price has actually retraced deeper than initially projected from the previous move.
This could suggest a stronger correction or weakness in the upward movement before continuation.
If the price started at 122,000 high and retraced below the anticipated retracement level, it may find support around current or slightly lower levels before attempting to move higher again.
Next projection based on current price of 113,000:
New retracement % on second move:
Move up: 122,000 - 99,000 = 23,000
Actual retracement: 122,000 - 113,000 = 9,000
Actual retracement % = (9,000 / 23,000) × 100 ≈ 39.13%
Updated retracement level is closer to a Fibonacci 38.2% retracement level, which is a common retracement level in markets.
Project next upward move:
Use the previous average upward move for projection: 28,500 (from prior analysis).
Starting point for next move projection: 113,000 (current price after retracement)
Next projected high = 113,000 + 28,500 = 141,500
Probabilities:
Retracement around 38.2% usually has a probability around 20-25%, slightly less frequent than 29-30%, but still common.
Uptrend continuation probability after retracement remains >60% if the trend is strong .
Summary Table with updated data:
Feature Value
Current Price 113,000
Previous High 122,000
Move Up Range 23,000
Actual Retracement Amount 9,000
Actual Retracement % 39.13%
Projection for Next High 141,500
Probability of 39% Retracement 20-25%
Probability of Uptrend Continuation >60%
Conclusion:
The price has retraced more than initially projected from previous data but still within reasonable common retracement levels (around 38%).
Assuming the uptrend holds, the next price move could push toward approximately 141,500.
It’s advisable to watch key support levels near 113,000 for signs of reversal or further retracement.
All the best
Lets see in we can trust it
Not a guru

SOL BEARISH CONTINUATIONAs the market continues to create new lows, something caught my eye.
3 areas of unwicked impulsive moves (FVG's) lying around 165.18 - 166.80, 167.65 - 169.69 and 170.32 - 172
With this, I identified two order blocks
.
I'm traditionally wired to prefer the latter because there's more confluence factors;
A liquidity pool 169.70 - 170.3 established by price struggling to close above that level followed immediately by a FVG into an OB.
Price would have an instant reaction downwards if it traded to those levels.
However, the buying pressure might not be sufficient to push price to those levels before the crash.
Hence the other order block.
I'd be paying close attention to observe how it plays out.

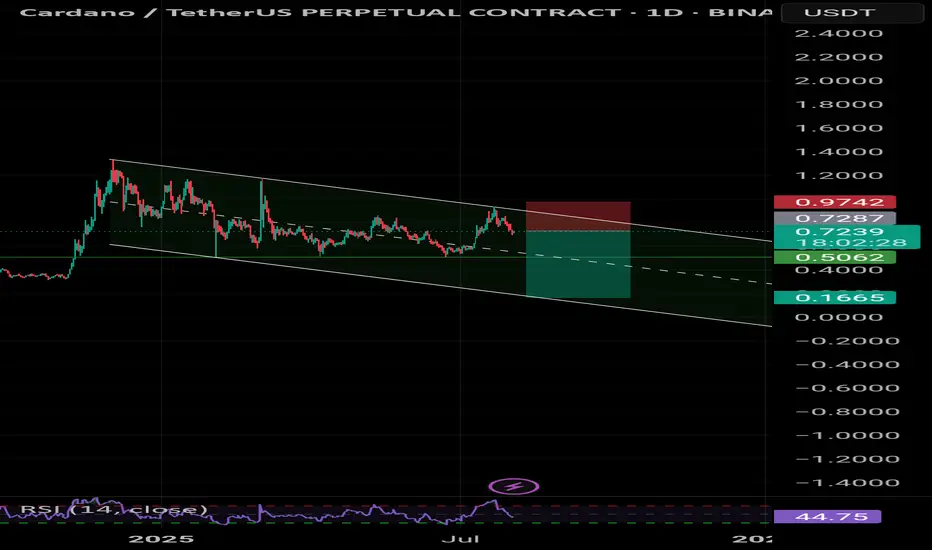
Cardano sellll shorts All markets have TB in August.
Cardano sellll short
Tp1:0.50
Tp2:0.44
Tp3:0.29
Tp4:0.16😄😄😄😄😄
Sui chance for +60% on this zoneSui continue to grap liquidation but on the monthly and weekly timeframe we are still bullish.
I just saw good zone for trade. At 3.15 we have daily EMA + fibonacci 0.64 + Daily FVG.
I will suggest to add some leverage because invalidation is close to 2.9.
In this mid term bull market of altcoins we can see that SUI has good performance.
Ivan

BTCUSD Swing outlookSwing Outlook on BTCUSD!
8H Timeframe Analysis
Trend Bullish
Looking for buys on discounted levels

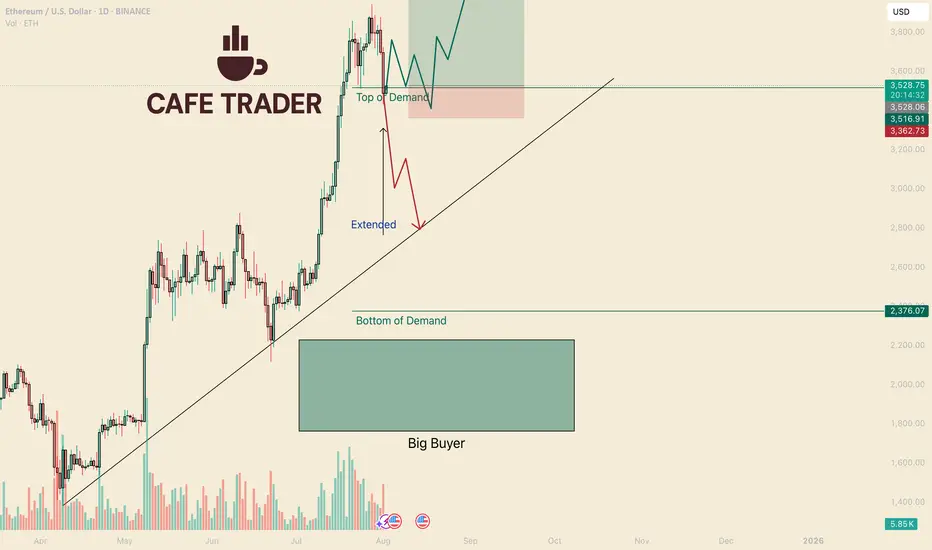
ETH Critical Next Few Days.Hello I am the Cafe Trader.
Today we are taking a close look at Ethereum.
After the Tariff news and the Jobs report, The market as a whole seems very bearish suddenly to many. Even though we do have aggressive sellers in the short term, The market is still bullish in the mid to long term. Let's take a look.
Sentiment has changed
A major catalyst (like the Tariffs news) can cause a change of terrain. Buyers may become more bashful, taking their foot off the gas (where the put it before). Reactions to kry levels (like "top of demand") will give us clues into how strong are they still.
Short Term
ETH had a huge rally, Whats does a healthy rally need for a continuation?
Consolidation
This brings us to the charts
Top of demand gives us evidence of how convicted these current buyers still are in a market. A hot reaction = Aggressive Demand. Cold Reaction = Hesitant or lack of Demand.
Todays close was a touch cold, but considering the recent bearish news and data, not terrible. Buyers are still active in this area, but since the terrain might have changed, I have given you two scenarios.
Green Scenario
For this to play out, we need to see buyers step in immediately. The longer ETH stays in this demand, the heavier they will become (and it's a long way down)
Wait for a second test minimum. Best to get a hot reaction. If it presses into the demand zone, Cut it early. (always good to wait for a close)
Entry 3,518
Stop 3,360
TP 1 3,990
TP 2 Breakout? Trailing stop?
Red Scenario
If we can't close above top of demand (Like tomorrow...) This is the likely scenario. I would be hard pressed to try and catch a knife this overextended. So until we identify where the new sellers are sitting, I can't give you any trades on this scenario. If you are short biased this could run all the way down to the bottom of demand.
I'll keep a close eye this over the weekend and keep updates.
Long Term
These prices should be according to your personal sentiment on ETH.
Aggressive = 3,500
Good price = on the trend roughly 2,900 - 3k
STEAL = 2,200 - 2,400
That's all for ETH! Enjoy your weekend, and Happy Trading!
@thecafetrader
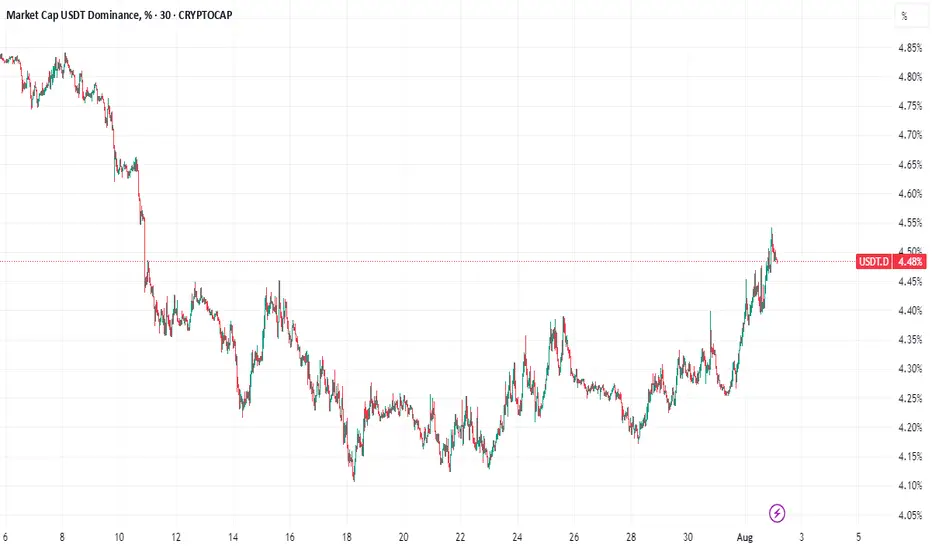
Tether Rakes in $4.9B Q2 Profit, Cementing Its Reign as Crypto’sTether Q2 Net Profit Hits $4.9 Billion, Pushing Total Earnings to $5.7 Billion: What It Means for the Crypto Industry
Tether Holdings Ltd., the issuer of the world’s largest stablecoin USDT, has once again made headlines with its Q2 2025 earnings report, revealing a staggering net profit of $4.96 billion. This brings the company’s total profits for the first half of the year to $5.7 billion—a record-breaking milestone for both the company and the broader stablecoin ecosystem.
This article explores the implications of Tether’s Q2 performance, the sources of its revenue, its impact on the crypto markets, and the growing significance of stablecoins in the evolving financial landscape.
________________________________________
A Record-Setting Quarter for Tether
Tether’s Q2 2025 results have astonished even seasoned analysts. The company’s reported $4.96 billion in net profit in a single quarter represents one of the most profitable periods in the history of any fintech or crypto-native company. What’s even more remarkable is that this profit was not driven by speculative trading or token sales, but by conservative, yield-generating strategies rooted in traditional finance.
The company’s Q1 earnings were already impressive at $0.76 billion, but Q2’s results eclipse those numbers entirely. Tether’s cumulative profit year-to-date now stands at $5.72 billion, putting it on track to potentially exceed $10 billion in earnings for the full year if current trends continue.
________________________________________
What’s Driving Tether’s Massive Profit?
Tether’s incredible profitability is primarily fueled by one key factor: the interest earned on its reserves. As the issuer of USDT, Tether is responsible for maintaining a 1:1 backing of every token in circulation. These reserves are primarily held in short-term U.S. Treasury Bills (T-Bills), reverse repos, and cash equivalents.
Here’s a breakdown of the main profit drivers:
1. High Interest Rates on U.S. Treasuries
With the U.S. Federal Reserve maintaining elevated interest rates to combat inflation, short-term T-Bills have become highly lucrative. Tether holds tens of billions of dollars in these instruments, generating billions in annual interest income.
For example, the yield on a 3-month Treasury bill in Q2 2025 averaged around 5.2%, and Tether’s reserve base has hovered near $90 billion to $100 billion. Even a conservative allocation can earn several billion dollars in annual yield.
2. Reverse Repurchase Agreements (Reverse Repos)
Tether has also expanded its use of reverse repos, which allow it to lend cash to counterparties in exchange for securities, earning a premium on the transaction. This has contributed significantly to its earnings, especially in a high-yield environment.
3. Gold Holdings and Bitcoin Exposure
Tether has acknowledged that a small portion of its reserves includes gold and Bitcoin holdings. These assets appreciated in Q2, contributing to the overall profit. While not the primary revenue source, their performance added notable value during the quarter.
4. Equity Investments
The company has begun investing in infrastructure and technology firms related to blockchain and AI. While these investments are not liquid, mark-to-market gains may have also contributed to the net profit figure.
________________________________________
A Closer Look at Tether’s Reserve Report
Tether’s Q2 attestation report, published alongside its earnings update, provides transparency into how its assets are allocated. Here are some highlights:
• Over 85% of reserves are held in U.S. Treasury instruments
• $5.4 billion in excess reserves—a buffer above the value of circulating USDT
• $3.3 billion in gold and Bitcoin holdings
• Minimal exposure to unsecured commercial paper or riskier debt instruments
Tether has continuously emphasized its commitment to transparency and risk management. Unlike in its early years, when it faced criticism over opaque reserve practices, the company now releases quarterly attestations audited by third-party firms such as BDO Italia.
________________________________________
USDT’s Growing Dominance
Tether’s profits are closely tied to the growth of its flagship product: USDT, the world’s largest stablecoin by market cap. As of August 2025, USDT has a circulating supply exceeding $110 billion, giving it a dominant share of the stablecoin market.
This growth can be attributed to several factors:
1. Increased Adoption in Emerging Markets
USDT is widely used in countries with unstable fiat currencies, such as Argentina, Nigeria, and Turkey. For many users, USDT represents a dollar-denominated safe haven in environments plagued by inflation and capital controls.
2. DeFi and Cross-border Payments
USDT continues to be a core asset in decentralized finance (DeFi) protocols, serving as a stable medium of exchange and collateral. It's also a preferred tool for cross-border remittances, given its speed and low transaction costs compared to traditional banking systems.
3. Institutional Integration
Major crypto exchanges, custodians, and payment processors have incorporated USDT into their platforms, driving further liquidity and utility. In many cases, USDT is preferred over fiat due to its 24/7 availability and blockchain-native nature.
________________________________________
What Does This Mean for the Crypto Industry?
Tether’s Q2 performance is more than just a corporate milestone—it’s a bellwether moment for the crypto industry. It signifies the maturation and institutionalization of digital assets and stablecoins. Here’s what it means for the broader ecosystem:
1. Stablecoins as Profitable Financial Products
Tether’s profitability proves that stablecoins are no longer just “crypto plumbing.” They are now financial products generating billions in yield, much like money market funds. This is reshaping how investors and regulators think about stablecoins—not as speculative tools, but as interest-bearing assets backed by real-world securities.
2. Regulatory Scrutiny Will Intensify
With Tether generating profits that rival traditional banks, expect regulators to increase oversight. Stablecoins have long been in the crosshairs of the U.S. Treasury, SEC, and global central banks, and Tether’s dominant market share will likely place it under further examination.
However, Tether’s transparency efforts, including quarterly attestations and reserve disclosures, may help it navigate these regulatory waters more effectively than in the past.
3. Competition Will Escalate
Tether’s extraordinary profits will likely attract new entrants and existing competitors to the stablecoin arena. Circle’s USDC, PayPal’s PYUSD, and even central bank digital currencies (CBDCs) are all vying for market share.
Tether’s early-mover advantage, global reach, and deep liquidity make it hard to displace, but increased competition could pressure margins in the long term.
4. Decentralized Alternatives Will Seek Market Share
Decentralized stablecoins like DAI, FRAX, and USDD aim to offer alternatives to centralized issuers like Tether. While they remain relatively small, the ethos of decentralization might gain appeal, especially in regulatory-heavy environments.
Still, decentralized stablecoins have struggled to maintain pegs during market stress, giving Tether an edge in terms of trust and resilience.
________________________________________
The Road Ahead for Tether
As Tether moves into the second half of 2025, several strategic themes will define its trajectory:
Continued Profitability
If interest rates remain elevated and USDT circulation continues to grow, Tether’s annual profit could reach or exceed $10 billion—putting it in league with the most profitable fintech firms globally. This surplus could be reinvested in:
• Infrastructure expansion
• Strategic acquisitions
• Reserve diversification
• R&D for stablecoin innovation
Expansion into Emerging Markets
Tether has hinted at expanding its presence in Latin America, Africa, and Southeast Asia, where demand for dollar-denominated assets is high and banking infrastructure is limited. Expect to see more localized partnerships and on-ramp/off-ramp solutions.
Embracing Blockchain Innovation
Tether is already deployed on multiple blockchains—Ethereum, Tron, Solana, and more. The company is likely to support new Layer 1s and Layer 2s to enhance speed, reduce costs, and maintain competitiveness in the DeFi space.
There are also rumors that Tether may be exploring tokenized asset offerings and programmable money features, allowing USDT to integrate more deeply with smart contracts and enterprise use cases.
________________________________________
Criticisms and Controversies: Still Lingering?
Despite its success, Tether continues to face criticism from parts of the crypto community and regulatory world. Concerns include:
• Lack of full audits (attestations are not the same as full financial audits)
• Opaque ownership structure
• Past legal issues, including settlements with the New York Attorney General and the U.S. CFTC
However, it’s worth noting that Tether has addressed many of these concerns over the past two years. Its transparency has improved, and its operations have become more conservative and professional.
Still, its scale and impact on the crypto market mean that any misstep could have systemic consequences. Investors and regulators alike will continue to scrutinize its activities.
________________________________________
Final Thoughts: Tether’s Moment of Ascendance
Tether’s Q2 2025 net profit of $4.96 billion doesn’t just reflect a successful quarter—it marks a paradigm shift in crypto finance. What began as a controversial stablecoin project has evolved into a global financial powerhouse, rivaling traditional banks and asset managers in profitability.
More than just a win for Tether, this moment signals the growing legitimacy of stablecoins in the global financial system. It shows that crypto-native firms can not only survive but thrive in traditional financial environments, leveraging yield, transparency, and blockchain infrastructure to create sustainable business models.
As the world watches, Tether’s next chapters will likely be shaped by innovation, regulation, and global expansion. But for now, with $5.7 billion in profits in just six months, one thing is clear:
Tether is no longer just a stablecoin issuer—it’s one of the most powerful financial entities
in the digital age.
________________________________________
Disclaimer: This article is for informational purposes only. It does not constitute financial advice. Always conduct your own research before making investment decisions.
_Bitcoin Update
Bitcoin broke below on our local PBr2 support at 115.7k range keylevel panda fam this is a sign of first mini bearish breakout, But bitcoin price is now sitting at H4 PBr1 support keylevel 113.4k range.
Two case scenario possible for bitcoin:
1.) White broken lines — a bounce back with new swing high confirmation for reclaim back on structure for possible next major trend resistance breakout | BULLISH BIAS 🐂
2. ) Red broken lines — retest at PBr2 as local resistance and possible drop until white box support at 111.2k range area | BEARISH 🐻
In this case while bitcoin is ondecision panda fam we need to consider both case scenario with a short term possibilities but the best thing here is we already know where are the importance keylevel S / R to observe not just a random keylevel. 💯
ℹ️ : @pandanambawan

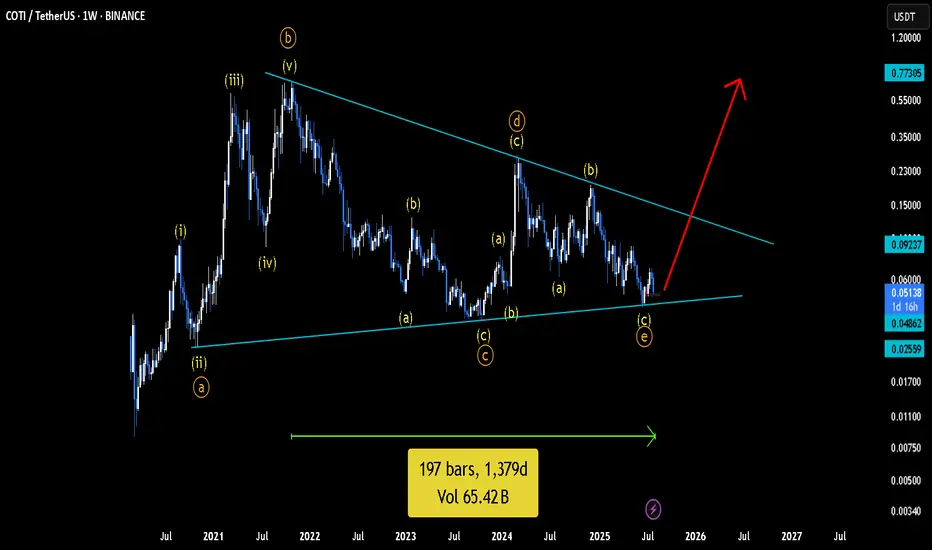
COTIUSDT Weekly Analysis Potential Reversal?📍 Current Price Position – On Top of Historical Support!
The COTI/USDT pair is currently testing a crucial support zone between $0.0400 – $0.0517, which has been a key demand zone since early 2021. This isn't just any support — it's a macro psychological area that has repeatedly triggered strong reversals in the past.
We are at a make-or-break level, where the next move could define the mid-term trend.
---
🧩 Price Structure and Pattern
📐 The chart shows a descending triangle pattern with:
Consistently lower highs (marked by the downward yellow trendline),
Flat horizontal base around the major support zone.
This pattern can result in:
A powerful breakout if the trendline is broken, or
A sharp breakdown if the horizontal support fails.
---
📈 Bullish Scenario: Reversal Momentum Building?
If price:
Breaks above the descending trendline (~$0.0719), and
Closes a weekly candle above that resistance zone,
➡️ We could see a breakout move with targets at:
Resistance Level Target
Initial Target $0.1116
Mid-Term Target $0.1863
Strong Zone $0.2446 – $0.2861
Long-Term Bullish $0.35 – $0.4169
📌 A confirmed higher high and higher low structure above $0.11 would strengthen the bullish case.
---
📉 Bearish Scenario: Breakdown from Support
If:
Price fails to hold the $0.0517 – $0.0400 support area,
and prints a weekly close below this zone,
➡️ The next bearish targets could be:
Support Level Target
First Support $0.0260
Psychological Level $0.0200
Extreme Panic Zone $0.0150 – $0.0100
⚠️ This would indicate a capitulation phase, likely to trigger panic selling and deeper lows.
---
🧠 Strategy Notes for Traders
✅ For Position Traders:
The $0.040 – $0.0517 area is a prime watch zone for reversal setups with tight stop-loss below $0.040.
Excellent Risk:Reward potential if reversal confirms.
✅ For Swing Traders:
Breakout above the trendline offers a solid entry signal.
Targets up to $0.1863 look achievable with strong volume.
✅ For Conservative Traders:
Wait for breakout + retest confirmation before entering.
Avoid FOMO — let the weekly candle close guide your decision.
---
⚡️ Final Takeaway
> COTI/USDT is at a tipping point!
This long-standing support is the last line of defense for the bulls. A breakout can trigger a macro trend reversal, while a breakdown will extend the downtrend and invite heavier selling pressure.
Watch for the weekly close, trendline reaction, and volume behavior — the next major move is likely just around the corner.
#COTI #COTIUSDT #CryptoAnalysis #AltcoinWatch #DescendingTriangle #BreakoutTrading #SupportAndResistance #PriceAction #ChartPattern #WeeklyAnalysis
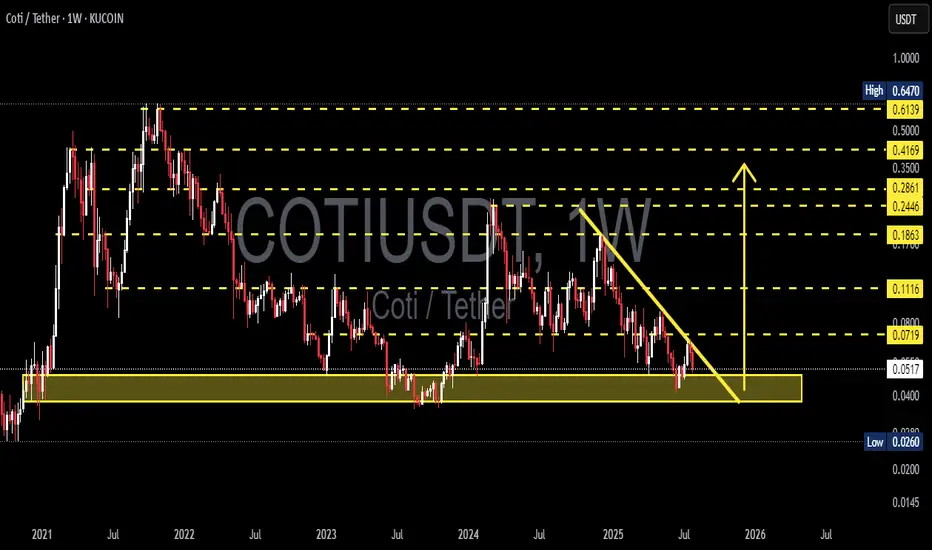
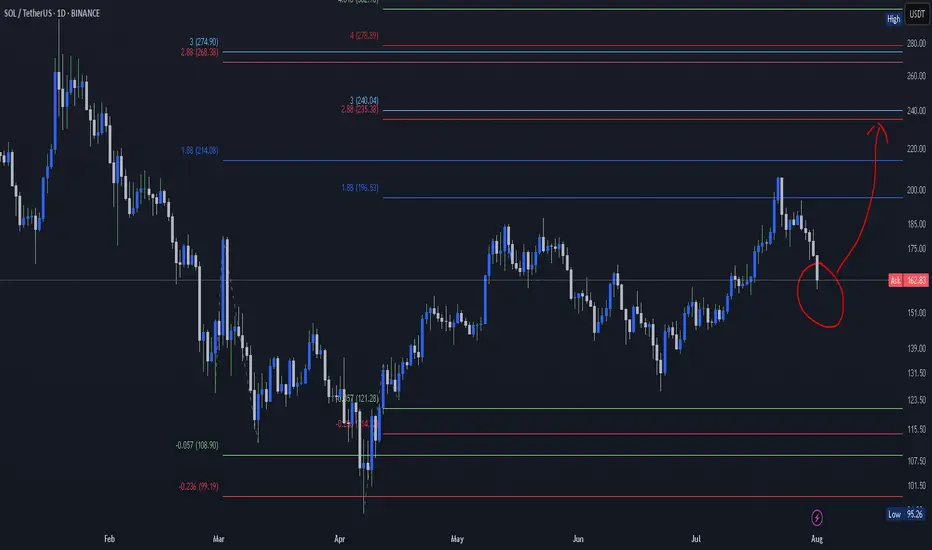
Chart Overview (SOL/USDT – 1D, Binance)Key Insights:
Support Zone: Around $160–165, aligning with Ichimoku support lines.
Fibonacci Levels: Price broke above the 1.618 level (~$175) and is now retesting.
Indicators Below: Showing a strong bullish crossover, supporting upward momentum.
Target Path: Drawn to reach $223, then $240–260 if bullish trend continues.
📈 Bullish Scenario:
Bounce from $160–165 zone
-Short-term target: $195–200
-Mid-term target: $223
-Long-term: $240–260
📉 Bearish Scenario:
If $160 support breaks:
Next support levels: $145, then $122
Worst-case retest: $95
✅ Conclusion:
Crucial zone now: Either a strong bounce or a bearish breakdown.
Current indicators and structure favor a bullish continuation if support holds.
Reversal from Channel Bottom or a Real Breakdown? Identifying th
🎯 BTCUSDT - Analysis
🔹 Analysis Date: 1 August 2025
📉BTCUSDT:
Price is currently moving inside an ascending channel and has touched the bottom of the channel again, offering a potential buy opportunity.
However, for those seeking a low-risk entry, the zone around 118,000 could be ideal—if price returns to the channel and confirms support.
Although it seems the channel’s lower boundary might break, this could be a fake break to mislead traders before a rebound.
The support at 110,000 is a crucial short-term level; if it fails, a deeper correction toward 98,090 or even 94,000 is likely.
Our targets remain at the upper boundary of the channel.
⚠️ Risk Management Tip: Wait for confirmation near 118,000 if unsure, and always size positions based on overall volatility.

MARKET UPDATE— August 1st, 2025“Handle before lift-off? Or is the bull year cooling off?”
Let’s address the question everyone is silently asking:
Are we nearing the end of the bull year… or is this just the calm before the next storm?
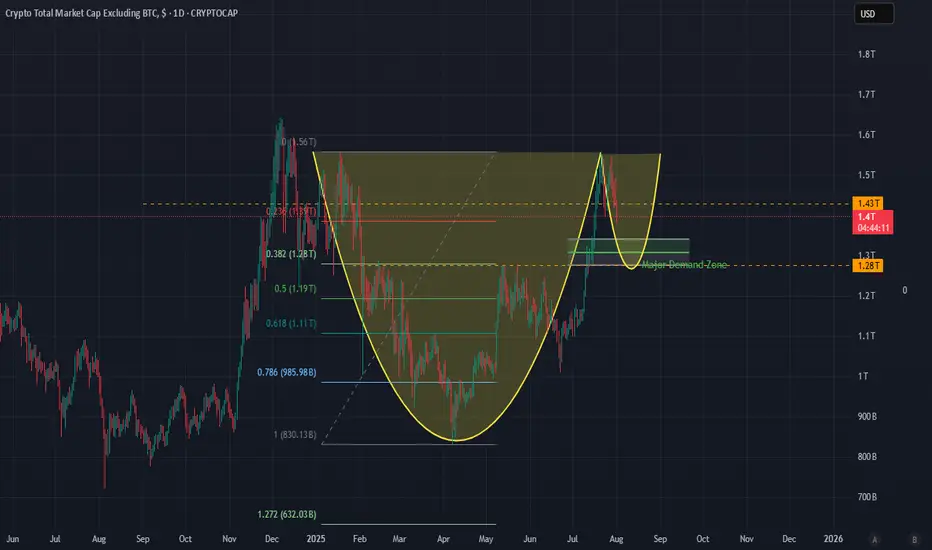
1. Total Market Cap (ALTS): Cup & Handle in Motion
We’ve observed something beautiful forming on the chart a clean cup and handle structure.
But here’s the twist: this isn’t just any setup it’s forming just below the infamous $1.43T ceiling, which has now rejected monthly closes in November, December, January, February, and July.
- High of January : $1.56T
- Low of April (Handle Base) : $0.83T
- High of July : $1.56T
These levels outline a powerful structure… but we haven’t launched yet. Why? Because the handle isn’t done cooking.
Based on Fibonacci retracement levels from the handle’s top to bottom:
- 0.236 sits at $1.32T
- 0.382 sits at $1.24T
- 0.5 sits at $1.195T
We’ve yet to hit those deeper levels, and considering ALT dominance , macro uncertainty (e.g., Trump tariffs ), and repeated monthly rejection below $1.43T , a retrace into $1.28T or deeper is not only possible.....it’s healthy .
This isn't the breakdown. It's the build-up.
2. Bitcoin: The Key That Turns the Lock
Now here’s where it gets intense.
Everyone’s assuming Bitcoin can hold $115K even if ALT dominance retraces to $1.28T .
Let’s be real:
> If ALT dumps, Bitcoin bleeds too.
And here’s what I see:
- There's a fair value gap between $113K and $111K , a probable first target.
- But beneath that lies the demand zone between $109K and $107.5K , loaded with liquidity.
- That liquidity is a magnet $107.5K is where the smart money lurks.
- A move from $115K to $107.5K is a 6–7% drop , and with ALTs faltering, it’s becoming increasingly probable.
This isn't panic territory. It's precision territory .
> We want that drop. That’s the spring before the sprint.
3. So what’s next?
This is how I see it:
- ALTS retrace into the $1.28T–$1.24T range, maybe wick to $1.19T completing the handle.
- BTC fills the FVG to $111K , then dives to $107.5K gathering all that demand before rebounding.
- Once BTC reclaims $113K and ALTS reattempt $1.43T , the stage is set. We’re looking at a clean slate… and clean breakouts .
🎯 What should you do with this?
1. Don’t panic—plan.
Use these drops as entries, not exits. Liquidity hunts aren’t to scare you—they’re to position the sharp ones.
2. Watch the zones like a hawk:
- BTC: $113K, then $107.5K
- ALTS: $1.28T, then $1.24T or $1.19T
3. Stay bullish—but strategic.
The structure is intact. Momentum is coiling. And once this handle completes, the push above $1.43T isn’t a maybe it’s a matter of timing.
💡 Final Word
Are we at the end of the bull year?
No . We're simply testing the patience of tourists… while giving early movers one final entry.
Are we going higher?
Absolutely. But first, we dip.... not because we’re weak… but because that’s what strength looks like before it roars.
Brace for impact. Then brace for ignition.
INDEX:BTCUSD
CRYPTOCAP:TOTAL2
BTC ReaccumulationI'm watching here either for a local model 1 which forms a MTF accumulation model 2 or a model 1 which deviates the range one more time. There is a nice build up of liquidity to the upside but sadly no clear model 2 POI. The technical target if the model gets confirmed will be the range high but i would expect to see a new ATH. Let's see.

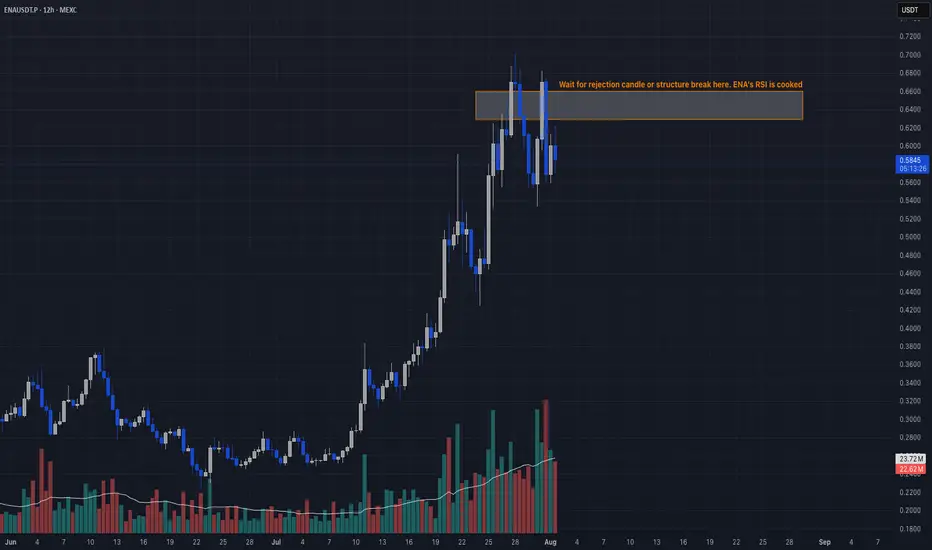
Overbought + Reversal Signal📣 Yo legends!
ENA got jacked on steroids lately, exploding in TVL and open interest like it’s headed to $10. But RSI at 82? Declining OI? That’s not strength, that’s a leverage hangover waiting to happen. Time to fade the party. 🥴
🔥 TRADE SETUP
Bias: Short
Strategy: Overbought + Reversal Signal
Entry: $0.63 – $0.66
SL: $0.71
TPs: $0.5446, $0.50, $0.42
Why?
– RSI 82 on daily = overheated
– Open interest dropping fast after topping $1.35B
– Funding collapsing → longs unwinding
– HTF sweep + LTF CHoCH confirmed.
Candle Craft | Signal. Structure. Execution.
Looks like $ investors switch possible - Crypto rules??Hello fellow traders,
Just looking at the chart of total market cap and based on trend line weekly focus- this is it- a point at which crypto market might start to recover and go for 2 x what it has in total, heading for 5t?? Let me know in your comments what do you think? Also, many investors might start diversifying their portfolio since Fridays 'crash' hence I wouldn't be really surprised if next week brings some $ into crypto !
It's just my idea don't copy think and do your own stuff
