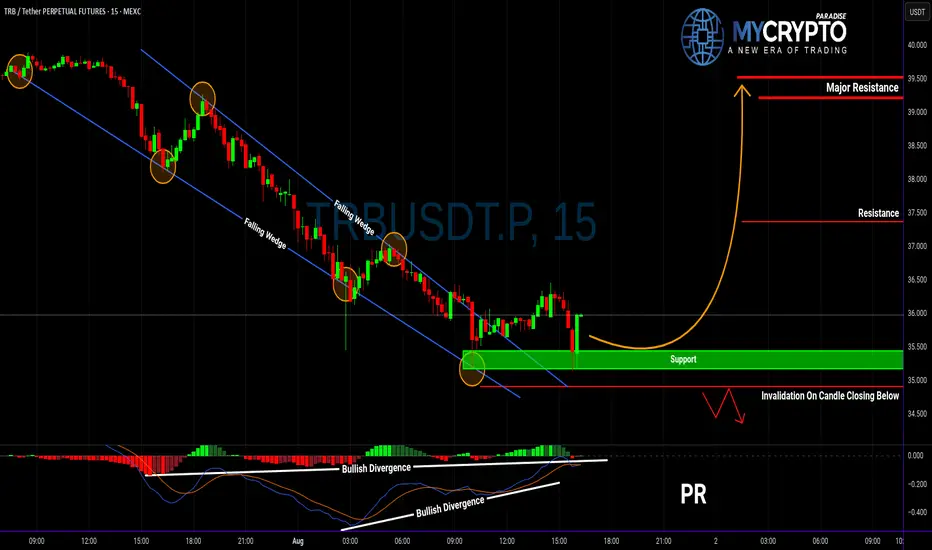
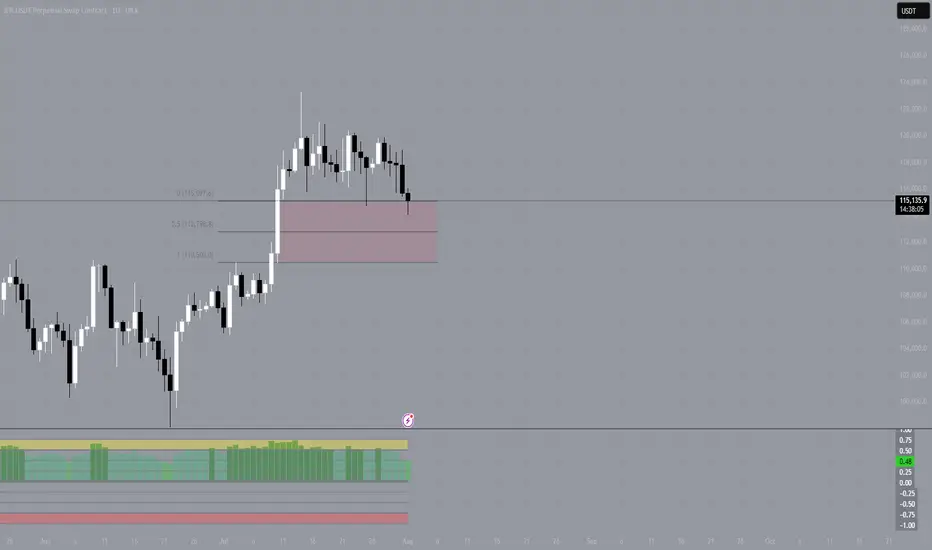
Is TRBUSDT About to Explode or Fake Out Everyone Again?Yello Paradisers! After weeks of quiet price action, is TRBUSDT finally gearing up for a real breakout—or is this just another trap before the next leg down? Let’s break it all down, because the next move could catch many traders on the wrong side.
💎TRBUSDT has recently broken out of a falling wedge pattern, accompanied by a clear bullish divergence—an encouraging sign that momentum may be shifting in favor of buyers. This type of setup historically carries a higher probability of a bullish move, especially if the breakout holds above key support levels. However, the entry strategy here is critical.
💎Ideally, we want to see a minor pullback. If that happens, it could offer a solid bounce opportunity from well-defined support zones, giving a favorable risk-to-reward setup. This is the scenario where patient traders will find the highest probability entries. On the other hand, aggressive traders might consider entering from current levels, but they must understand that doing so offers a less favorable risk-to-reward ratio. Jumping in too early without a clear confirmation could expose you to unnecessary risk, especially if the market reverses quickly.
💎More importantly, we have a clearly defined invalidation level. If TRBUSDT breaks below that level and closes a candle beneath it, this would invalidate the current bullish setup completely. In such a case, the best course of action would be to step aside and wait for a new structure or more reliable price action to form. Forcing trades in uncertain territory is how capital is lost and confidence shaken.
Strive for consistency, not quick profits. Treat the market as a businessman, not as a gambler. Protecting your capital and waiting for high-probability opportunities is what separates professional traders from the rest. Patience here could be the difference between a calculated win and a costly mistake.
MyCryptoParadise
iFeel the success🌴
Crypto market
Range again $ETHDue to typical ETH behavior we can form a range
Can be identified without any lines where I suppose will stay for a month or so consolidating

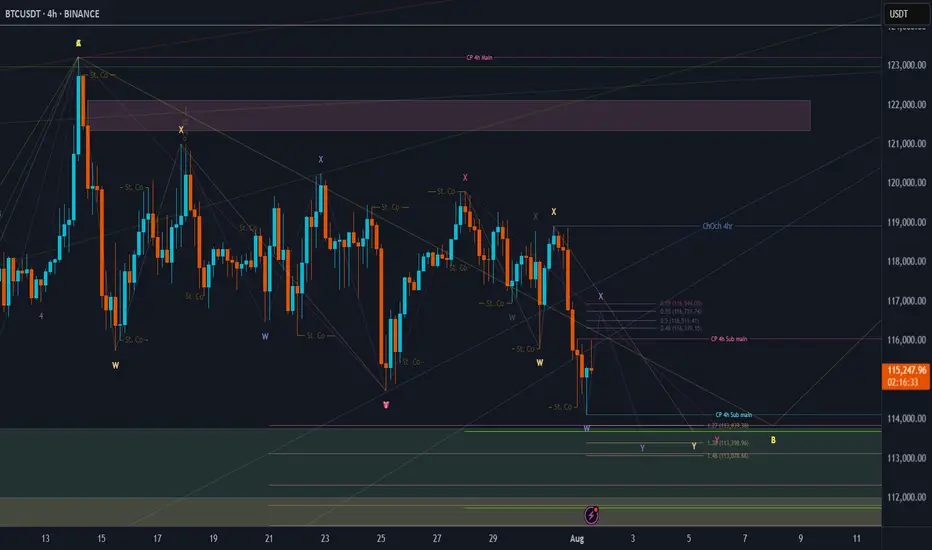
BTC Price Prediction and Elliott Wave AnalysisHello friends,
>> Thank you for joining me in my analysis. We have finished the pink X wave directly, then we have gone to the final pink Y wave, which consists of wxy in orange counting. Now we are moving into the final Orange Y wave.
>> our confirmations:
* 4Hr TF: Breaking 118990 for the next hours, we will end the whole Yellow B "correction" wave successfully. .
Keep liking and supporting me to continue. See you soon!
Thanks, Bros
More Pullback=Further Launch!!The structure has morphed
once again but the direction expectation
is still 100% in tact. In fact, all
we're doing right now is pulling
the bow string back a little more to
allow the arrow to fly up that
much further and faster! BTFD!!!!

Binance coin around $760 ┆ HolderStatBINANCE:BNBUSDT has retraced from its recent high and is consolidating just above $770, a former resistance now acting as support. A bounce from this level would reinforce the uptrend and open the door for a potential push toward $860, continuing the bullish structure.

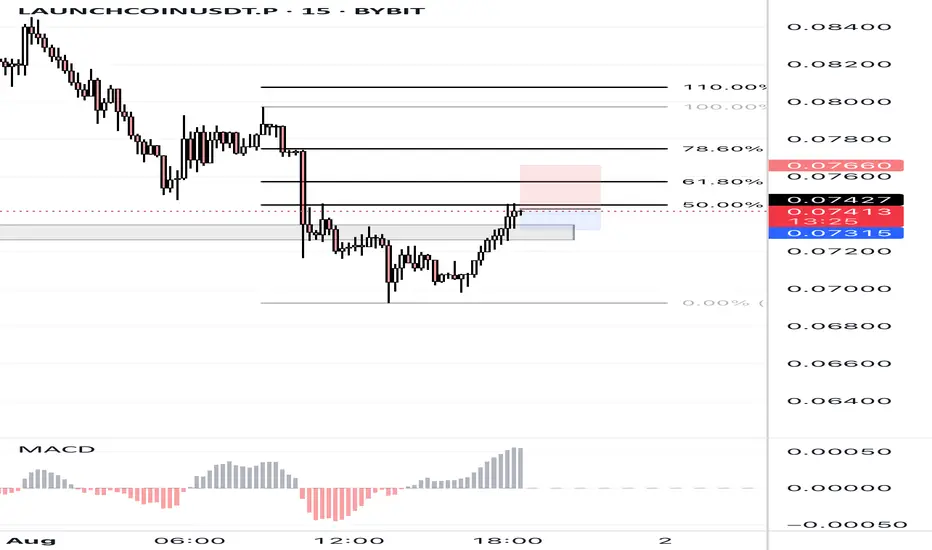
LAUNCHCOINUSDT.P | 50% Fibonacci Rejection – Bearish Reaction LiLAUNCHCOINUSDT.P is showing signs of exhaustion after a clean pullback to the 50% Fibonacci level (0.07427). Price is rejecting the key resistance zone, aligning with the broader downtrend structure.
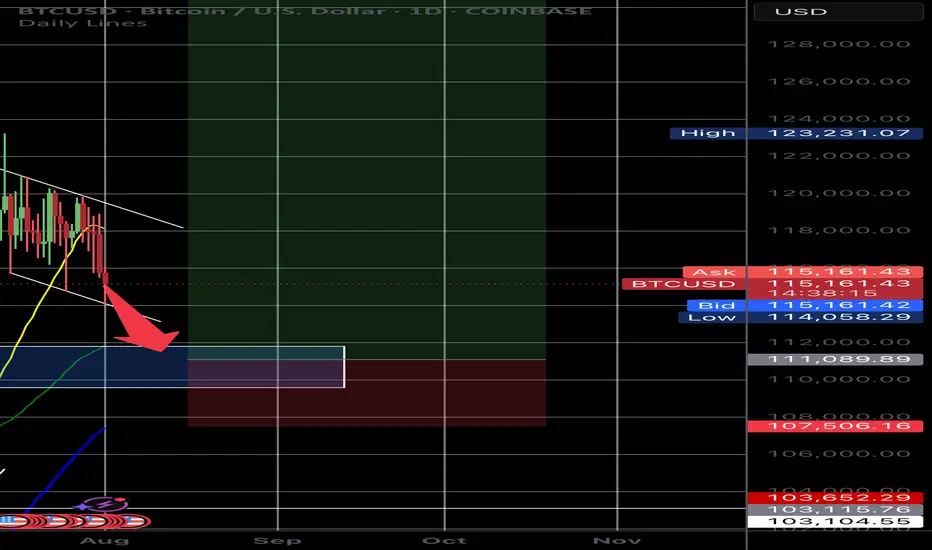
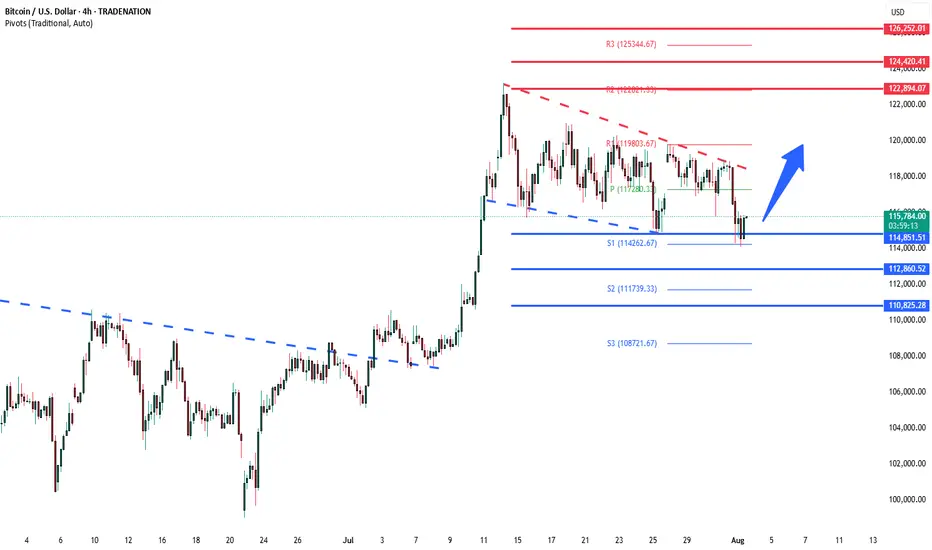
BTCUSD consolidation support at 114,850The BTCUSD remains in a bullish trend, with recent price action showing signs of a corrective pullback within the broader uptrend.
Support Zone: 114,850 – a key level from previous consolidation. Price is currently testing or approaching this level.
A bullish rebound from 114,850 would confirm ongoing upside momentum, with potential targets at:
122,900 – initial resistance
124,420 – psychological and structural level
126,250 – extended resistance on the longer-term chart
Bearish Scenario:
A confirmed break and daily close below 114,850 would weaken the bullish outlook and suggest deeper downside risk toward:
112,860 – minor support
110,825 – stronger support and potential demand zone
Outlook:
Bullish bias remains intact while the BTCUSD holds above 114,850. A sustained break below this level could shift momentum to the downside in the short term.
This communication is for informational purposes only and should not be viewed as any form of recommendation as to a particular course of action or as investment advice. It is not intended as an offer or solicitation for the purchase or sale of any financial instrument or as an official confirmation of any transaction. Opinions, estimates and assumptions expressed herein are made as of the date of this communication and are subject to change without notice. This communication has been prepared based upon information, including market prices, data and other information, believed to be reliable; however, Trade Nation does not warrant its completeness or accuracy. All market prices and market data contained in or attached to this communication are indicative and subject to change without notice.
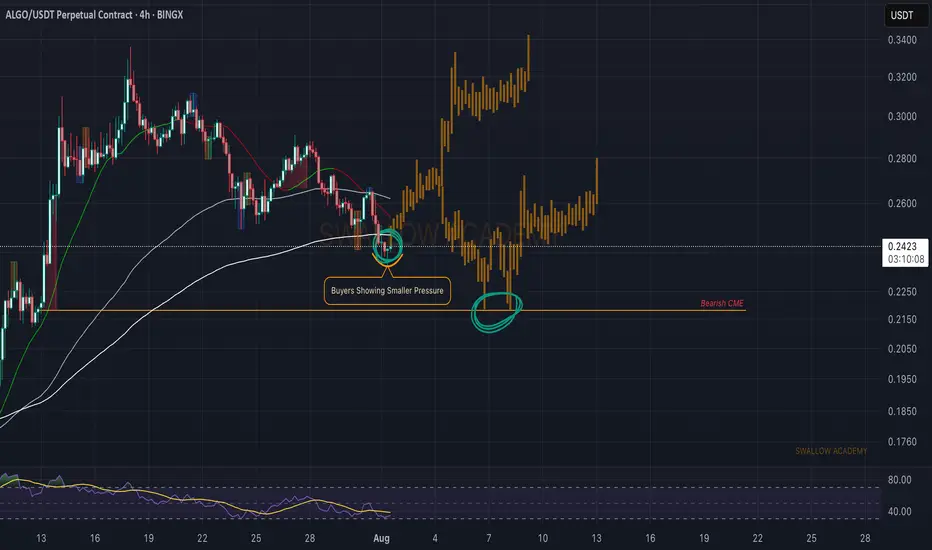
Algorand (ALGO): Seeing Signs of RecoveryAlgorand has made a market structure break (MSB) on smaller timeframes, which is indicating a potential trend switch here.
Now in the current timeframe we are looking for a break of that 200 EMA, as once we see the buyers take full control over it, we will look for buyside movement so eyes on it!
If for any reason we see further movement to lower zones, and we break local low on small timeframes, we are going to aim for that bearish CME, but for now, we are bullish.
Swallow Academy
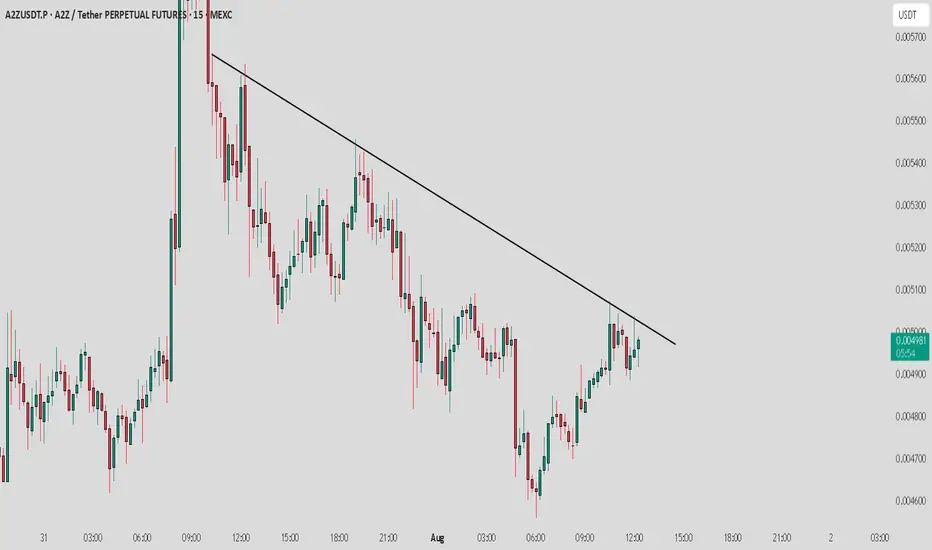
A2Z / USDT : Near Trendline resistance , Keep a close watch A2Z/USDT - Nearing Trendline Resistance
A2Z/USDT is approaching a crucial trendline resistance. Although it looks weak at the moment, a successful breakout could trigger a short-term rally of 10-15%.
Bullish Scenario:
If the price breaks above the trendline, we could see a sharp move upwards, with potential gains of 10-15%. Watch for confirmation of the breakout with higher volume and momentum.
Bearish Scenario:
Failure to break the resistance could lead to further consolidation or a potential reversal, testing lower support levels.
Keep an eye on the trendline and volume for the next key move.
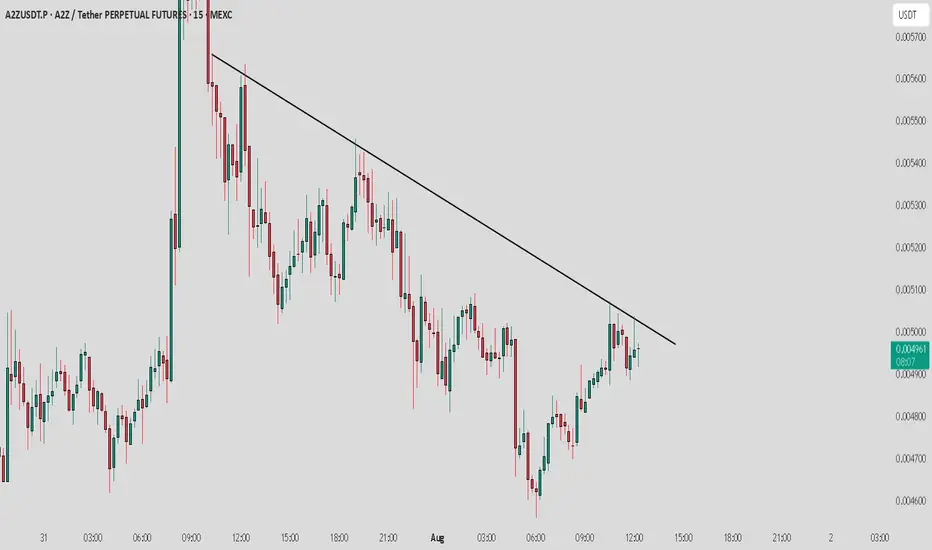
A2Z / USDT : Near trendline and showing weakness, Avoid long A2Z/USDT - Nearing Trendline Resistance
A2Z/USDT is approaching a crucial trendline resistance.
Bearish Scenario:
Failure to break the resistance could lead to further consolidation or a potential reversal, testing lower support levels.
Keep an eye on the trendline and volume for the next key move.
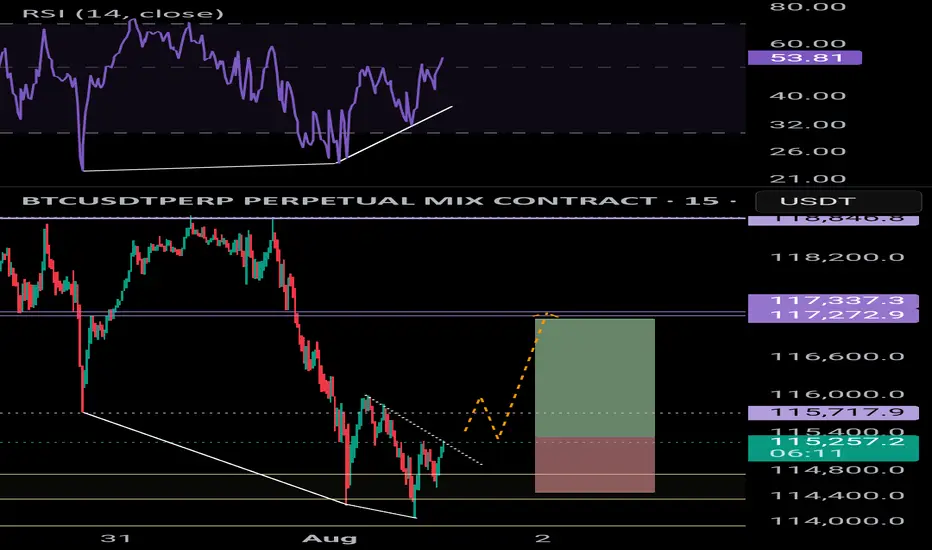
BTC bullish div.Bullish divergence on the 15m and 1H chart 📈
Liquidity grabbed 📈
Expecting a small move up = 1.6%
Long scalp trade if youre interested
Bitcoin Monthly - Structure Intact, Tension Rising?⊣
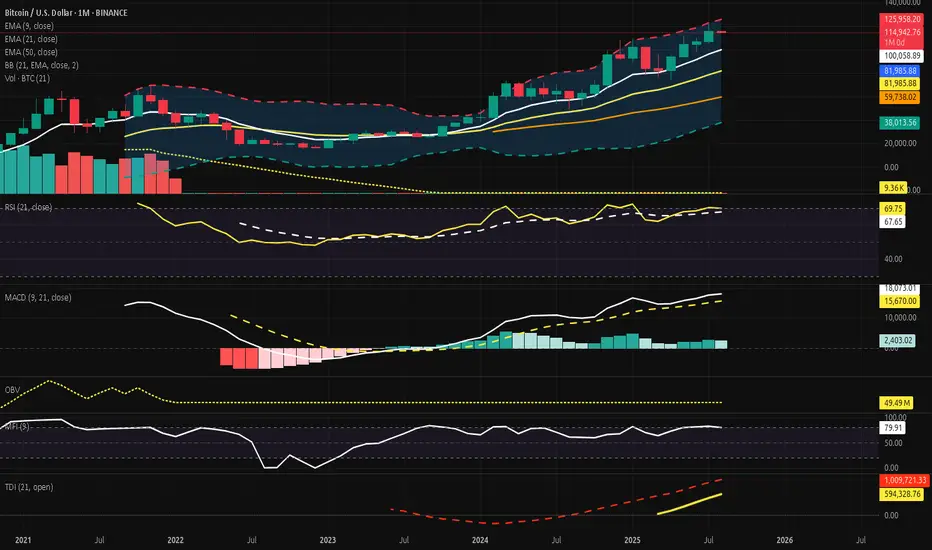
⟁ BTC/USD - BINANCE - (CHART: 1M) - (Aug 01, 2025).
◇ Analysis Price: $114,994.73.
⊣
⨀ I. Temporal Axis - Strategic Interval - (1M):
▦ EMA9 - ($100,069.29):
∴ Price holds 14.93% above this dynamic threshold, indicating momentum continuation but also positioning within an overheated range;
∴ The EMA9 structure is firmly ascending, representing the spine of the short-term bullish wave;
∴ July’s candle remains fully above the EMA without testing it - no wick beneath the line-marking dominance of buyers without internal correction.
✴️ Conclusion: The EMA9 governs the tempo of the current trend and stands untouched. Elevated, but structurally intact.
⊢
▦ EMA21 - ($81,990.60):
∴ A core support vector in the macrostructure, now 28.73% below price, suggesting strong bullish detachment from equilibrium;
∴ The line maintains a smooth, upward slope, echoing the recovery arc since late 2022’s structural low;
∴ Its alignment with the Bollinger Basis and Realized Cap forms a triad of reinforced technical stability.
✴️ Conclusion: EMA21 anchors the mid-term uptrend and guards the sanctum of continuation. No breach, no threat.
⊢
▦ EMA50 - ($47,983.10):
∴ Deep beneath price, resting at 58.27% below the current level - a relic of past cycles, yet still relevant as ancestral support;
∴ The EMA50 has curved upward subtly, signaling the final stage of long-term bear cycle recovery;
∴ Price has not interacted with this zone since late 2023, preserving its status as last-resort structural bedrock.
✴️ Conclusion: EMA50 serves as the sacred foundation of the macro trend - distant, but silently upholding the higher order.
⊢
▦ BB (21, 2) - ($81,990.60, $124,871.91, $39,109.29):
∴ The Basis of the bands aligns precisely with the EMA21, confirming equilibrium at ($81,990.60) - the mid-guardian of the macro cycle;
∴ The Upper Band is currently intersecting the candle body at ($124,871.91), marking an imminent volatility ceiling that may trigger either breakout or rejection;
∴ The Lower Band rests at ($39,109.29), far beneath the trend structure, now serving as a shadow chamber rather than an active field of probability.
✴️ Conclusion: The BB channels have opened widely, signaling expansion. With price nearing the upper rim, the phase is volatile but directional. The core remains intact through the EMA21 basis.
⊢
▦ Volume + EMA21 - (37.62B, 29.71B):
∴ Monthly volume for July reached $37.62 Billion, standing above the EMA21 of volume at $29.71 Billion, indicating an active expansion phase in market participation;
∴ This is the third consecutive monthly close above the EMA21, forming a sequence of rising activity that mirrors the price climb - suggesting healthy conviction behind the movement;
∴ The volume body also aligns with bullish momentum confirmation, as it occurs within an ascending slope of the EMA21, avoiding false divergence or exhaustion patterns.
✴️ Conclusion: Volume expansion supports the current trend. The flow is consistent, not speculative.
⊢
▦ RSI (21, 9) - (69.79, 64.71):
∴ The RSI main line stands at (69.79), nearing the classical overbought threshold but not breaching it, reflecting a strong yet controlled uptrend;
∴ The signal line (9-period smoothing) trails at (64.71), confirming positive pressure without showing divergence - both curves remain aligned and ascending;
∴ There is no crossover, no rejection, and no curvature breakdown - suggesting momentum still leans bullish, but the zone is tightening.
✴️ Conclusion: RSI reveals active strength under equilibrium control. Nearing the gates of exhaustion, but no conflict yet.
⊢
▦ MACD (9, 21, 9) - (4,172.31 / 3,423.95 / +748.36):
∴ The MACD Line remains well above the Signal Line, holding a spread of (+748.36), confirming an active momentum cycle;
∴ Both lines are above the zero axis, reinforcing a long-standing bullish wave with consistent inertia since late 2023;
∴ The Histogram is positive, though it shrinks slightly from previous months, suggesting a potential slowing of force - not a reversal, but a breath.
✴️ Conclusion: The MACD still flows in favor of the bulls. The pulse continues, yet shows first signs of contraction. Momentum remains, but vigilance awakens.
⊢
▦ OBV (21, BB2) - (10.27M / 9.82M / 11.19M / 8.45M):
∴ The OBV line rests at (10.27M), positioned above the Basis (EMA21 at 9.82M), indicating a net accumulation bias over the mid-term;
∴ It remains within the upper half of the Bollinger channel, but beneath the upper band, currently at (11.19M), suggesting accumulation without climax;
∴ The bands are widening, signaling expanding participation and heightened flow volatility - yet without destabilization.
✴️ Conclusion: OBV confirms active, steady inflow. Accumulation sustains the structure. Flow is present, but not yet euphoric.
⊢
▦ MFI (EMA9) - (79.90 / 74.63):
∴ The MFI registers at (79.90), resting near the upper saturation zone, traditionally viewed as overbought - but no rejection candle has occurred;
∴ The 9-period EMA smoothing line at (74.63) trails cleanly beneath, reinforcing directional alignment without divergence;
∴ This spread between the MFI and its smoothing curve affirms a persistent inflow dominance, though now nearing exhaustion thresholds.
✴️ Conclusion: The MFI reveals an environment of strong capital influx. Though high, it is not yet reversal-bound. Compression may precede contraction.
⊢
▦ TDI + EMA21 - (69.79 / 64.71 / / 62.00):
∴ The RSI Line (TDI core) sits at (69.79), nearing the volatility band’s upper arc, denoting strong upward rhythm but with limited expansion room;
∴ The Signal Line at 64.71 lags slightly, confirming the trend with no divergence or curvature weakness;
∴ The Volatility Bands (±10 around Signal) contain price action cleanly - upper band at (74.60), lower at (58.83) - showing moderate but controlled pressure;
∴ The EMA21 overlay at (62.00) forms the base layer, maintaining upward inclination and reinforcing long-term trend security.
✴️ Conclusion: The TDI remains bullish, harmonized, and stable. Momentum leads, volatility permits. No rejection yet, but expansion space is finite.
⊢
🜎 Strategic Insight - Technical Oracle:
𓂀 The monthly structure reveals a state of controlled elevation within a structurally sound uptrend, yet with rising compression near upper bounds. The convergence of indicators outlines a field that is both fortified and tense;
∴ EMA9, EMA21, and EMA50 remain fully aligned and ascending - the Exponential Trinity forms a resilient foundation, untouched by regression;
∴ Bollinger Bands (21) have widened, and price now hovers near the Upper Band, suggesting that the volatility channel is at maximal stretch; further price advance may trigger short-term exhaust or rejection;
∴ Volume + EMA21 confirms that market participation has expanded meaningfully across three consecutive months - a sign of conviction rather than speculation;
∴ RSI (21, 9) and MFI (EMA9) hover in elevated zones, signaling latent overextension, yet without immediate signs of breakdown - still ruled by strength, not fear;
∴ MACD (9, 21, 9) retains bullish momentum, though its histogram begins to contract slightly, marking a potential early shift in impulse rhythm;
∴ OBV confirms accumulation without climax, and the TDI shows synchrony, yet the volatility band ceiling is near - a gateway, or a wall.
✴️ Synthesis Technical: The structure is strong, but stretched, all trend anchors remain intact, and no macro-reversal signal is present. However, the cluster of elevated oscillators and narrowed volatility envelopes warns:
∴ The next impulse will define the phase - either breakout beyond resistance ($125K+) or pullback to base zones near EMA21 (~$82K).
⊢
∫ II. On-Chain Intelligence - (Source: CryptoQuant):
▦ Realized Cap - UTXO Age Bands - ($437.6B):
∴ Capital density remains clustered in the 3m / 12m range, signifying strong mid-term holders anchoring price memory beneath $90K;
∴ The realized cap has risen steadily, confirming new capital commitment and reinforcing the EMA50 region as the “Arcane Bedrock”;
∴ No abrupt aging shift - holders have not fled, nor distributed heavily.
✴️ Conclusion: The realized cost base is lifting upward; Structure is strong beneath price.
⊢
▦ Whale to Exchange Transactions (Binance) - (Rising):
∴ Transfer spikes occurred in mid and late July, echoing pressure near technical ceilings;
∴ Whale flow to exchanges signals potential supply reloads, though no persistent distribution trend is confirmed;
∴ Activity suggests readiness, not execution - threat held in silence.
✴️ Conclusion: Whales signal tension, not aggression; Movement is tactical.
⊢
▦ MVRV Ratio + EMA9 - (2.257 / 2.039):
∴ The MVRV ratio holds above 2.0, implying price trades at over twice the realized cost basis - historically a zone of caution;
∴ No divergence from the EMA9; both slope upward - valuation expansion continues, but no climax;
∴ Price remains above the line of equilibrium, but not in parabolic distortion.
✴️ Conclusion: MVRV confirms overvaluation, but not detachment; Risk is elevated, but contained.
⊢
▦ Exchange Net Position Change (BTC) - (–35,871 BTC):
∴ Net outflows persist, with 35,871 BTC withdrawn in the last monthly cycle;
∴ This behavior aligns with strategic cold storage accumulation, reducing circulating pressure;
∴ On-chain confirms technical's: price rises on supply contraction, not mere speculation.
✴️ Conclusion: Bitcoin leaves the field; Supply retracts as price ascends; Structure reinforced.
⊢
🜎 Strategic Insight - On-Chain Oracle:
𓂀 The on-chain field reveals a fortified structure of conviction beneath the surface of price. Flow, cost basis, and behavior of dominant agents all signal a phase of controlled strength, though shadowed by rising valuation pressure;
∴ The Realized Cap ascends in harmony with price - an uncommon convergence. It suggests that new capital is not merely speculating, but embedding itself into the very structure of the network. The UTXO Age Bands reveal no panic rotation - holders remain;
∴ Whale Transactions to Exchanges rise in key moments, particularly around technical compression points. They do not yet dominate the flow, but stand ready - guardians or destroyers, in silence;
∴ The MVRV Ratio, though elevated, does not deviate violently. It warns, but does not collapse. It reflects a price above cost, but not a mania;
∴ The Net Exchange Position continues its descent. Bitcoin leaves the field; Supply contracts; This is not exit liquidity; This is strategic withdrawal.
✴️ Synthesis Technical: The network breathes in accumulation, not inflation; The participants anchoring this cycle are deliberate; On-chain structures confirm that value is migrating into dormancy, not into exits. The risk is not in structure collapse, but in overvaluation compression - a tightening halo around price.
⊢
⧉ III. Contextvs Macro-Geopoliticvs - Interflux Economicvs - (Jul 31, 2025 - Post-FOMC Strategic Decoding):
▦ FOMC Decision - (July 31, 2025):
∴ The Federal Reserve held its benchmark interest rate steady at (5.50%), marking the fourth consecutive pause - a clear stance of vigilant hold;
∴ The tone was neutral-hawkish, acknowledging progress on inflation while leaving the door open for future hikes if data demands;
∴ No mention of cuts. The Fed maintains narrative control - a message to both markets and sovereigns: we're not done yet.
▦ Jerome Powell’s Address:
∴ Powell reiterated the “data-dependent” framework, but expressed concern over sticky inflation in services and housing;
∴ He praised the resilience of the labor market, signaling no urgency to ease policy;
∴ His delivery was measured, ambiguous by design, injecting uncertainty - fuel for volatility, not clarity.
▦ Market Response - (Traditional Finance):
∴ The DXY (Dollar Index) swung sharply, but closed neutral, reflecting indecision over the Fed’s path;
∴ The S&P500 and Nasdaq attempted intraday rallies but reversed lower - a reaction to Powell not being “dovish enough”;
∴ Gold and Silver caught bids - hedges moved in, not out.
▦ Bitcoin (BTC/USD) Response:
∴ Bitcoin spiked on initial Fed release, tagging the upper Bollinger Band (1M) before retreating slightly - not a rejection, but a breath;
∴ No capital flight occurred. The response was measured and strategic, not speculative;
∴ On H4, Bitcoin touched the EMA200, reinforcing it as a post-FOMC decision point.
✴️ Macro Synthesis: The Fed sheathed the blade but did not lower the shield; Powell’s message: discipline remains. Markets flinched but did not panic; Bitcoin stood firm. This was not a moment of collapse - this was a moment of calibration.
⊢
⌘ Codicillus Silentii - Strategic Note:
𓂀 Let this note be written in the margin of all oracles, beneath the seals and above the motion: This is a cycle governed not by noise, but by intent restrained; The silence between macro movements, the calm in on-chain flows, and the geometry of structure all speak one truth:
The system is waiting;
There is no breakdown;
There is no climax;
There is only a tightening coil - one that neither confirms euphoria nor accepts rejection.
∴ Bitcoin holds above its sacred averages;
∴ The on-chain breath is slow, but pure;
∴ The macro field is firm, yet not soft.
⟁ The next force will not be a whisper - it will be a break or a roar.
✴️ Let no position be based in hope;
✴️ Let no assumption ignore volatility’s patience;
✴️ Let silence guide the strategy, not emotion.
⊢
𓂀 Stoic-Structural Interpretation:
∴ In the mirror of the arcane chart and the silence of on-chain flow, the Stoic lens reveals not merely price action - but the nature of motion itself;
∴ All movement is governed by tension and release, control and surrender. This cycle is no different;
∴ The trend holds, but does not rise arrogantly. It is disciplined;
∴ Capital flows, but not chaotically - it retreats where needed and commits only in strength;
∴ The macro world tempts chaos, but Bitcoin walks with its own gravity - unmoved unless chosen;
∴ Indicators show power without delusion, and pressure without collapse.
This is not a time for euphoria;
This is not a time for panic;
This is a time to observe structure, act with clarity, and remain unshaken.
✴️ The Stoic sees the signal beneath the storm:
Structure is intact;
Trend is valid;
Valuation is tense;
Strategy must remain cold.
⟁ Therefore, the Stoic does not chase candles; He waits for break of structure, or confirmation of continuation; No action is better than misguided motion.
⊢
✦ Structure: Bullish - (Controlled Phase).
∴ All key exponential moving averages - EMA9, EMA21, and EMA50 - remain aligned and ascending, with no curvature breakdown or crossover threat;
∴ Momentum indicators (MACD, RSI, TDI) are positive and synchronized, with no bearish divergence or rejection confirmed;
∴ Price holds above the EMA9 and remains well above the Bollinger Basis, signaling ongoing trend dominance;
∴ Volume exceeds its 21-month moving average, reflecting conviction, not hollow motion.
⟁ However:
∴ The structure is technically stretched - several oscillators approach saturation thresholds, signaling compression, not collapse;
∴ This is a bullish structure, but under strategic tension, not euphoria.
✴️ Final Judgment: Bullish Structure, currently in a compressed expansion state, preparing for either breakout continuation or technical correction - but showing no signs of structural reversal.
⊢
⧉
· Cryptorvm Dominvs · MAGISTER ARCANVM · Vox Primordialis ·
⚜️ ⌬ - Silence precedes the next force. Structure is sacred - ⌬ ⚜️
⧉
⊢

BTC is likely to resist falling below $112000BTC is likely to resist falling below $112000
If the confluence between the yellow trendline and the top green horizontal support level dont hold strong, we are likely to see BTC retrace to $100K
Please trade with care.
My thoughts are shown on the chart technically
I hope to connect with you.
Please like, share, comment and follow me.

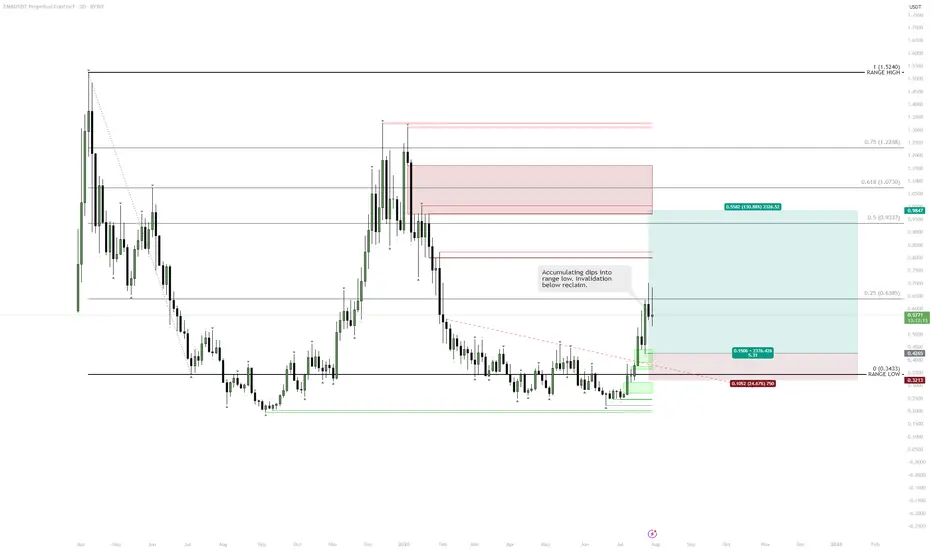
ENA | Range Low Reclaim — Targeting Midrange and AboveClear reclaim of the range low and a strong daily close confirm a bullish market structure shift.
Printing a higher high signals potential for continuation.
Dips toward the reclaimed range low are healthy, providing buy-the-dip opportunities.
Accumulation at the range low with invalidation below keeps risk tight.
Plan:
Accumulate pullbacks toward the range low.
Hold for midrange ($0.83) and upper range/major resistance.
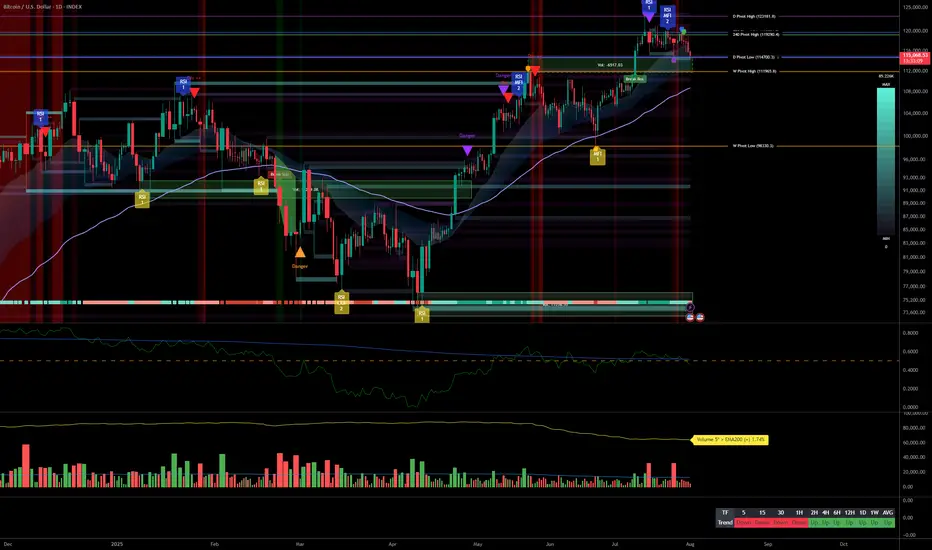
Bitcoin Facing Macro Volatility: Key Supports Hold Firm__________________________________________________________________________________
Technical Overview – Summary Points
__________________________________________________________________________________
Momentum: Dominant bullish bias on higher timeframes (1D to 2H).
Key Supports/Resistances: Key pivot zone at 114.7K–115.8K defended across all timeframes; major resistances at 119.7K, upside extension to 122.3K.
Volume: Peaks on breakout, normal to high volumes depending on TF, no signs of seller capitulation.
Behavioral Indicators: Risk On / Risk Off Indicator remains strong on all strategic TFs; ISPD DIV neutral except for a defensive buy signal on 1H.
Multi-timeframe summary: Broad horizontal consolidation, no panic or euphoria detected. Major supports overlap, confirming structural strength amid macro volatility.
__________________________________________________________________________________
Strategic Summary
__________________________________________________________________________________
Overall bias: Bullish above 114.7K; neutral/slightly bearish below this key level.
Opportunities: Longs via scalping/range trading on reactions at 114.7–115.8K; swing accumulation on daily/4H stabilization above 115K.
Risk: Break below <114.7K, macro volatility around NFP/PMI, false breakouts.
Macro catalysts: Expanded US tariffs (Trump), NFP, PMI, Fed status.
Action plan: Reactivity on pivots, reduce exposure during macro events, hard stops <114.5K H4.
__________________________________________________________________________________
Multi-Timeframe Analysis
__________________________________________________________________________________
1D: Working the 114723 pivot support. Bullish momentum, no excessive selling, Risk On / Risk Off Indicator “STRONG BUY”.
12H-6H: Building a bottom on the daily base; sustained volumes during sell-off, no panic, technical buy signals emerging.
4H-1H: Vigorous support defense, 1H ISPD DIV “buy” signal. Healthy range pattern; volumes up during rebound attempts.
30min-15min: Slow recovery after high-volume drop, no euphoria or capitulation. No “trap” or imminent squeeze, favorable for tactical trades.
Risk On / Risk Off Indicator: Higher TFs (1W/1D/12H/4H) show strong bullish signals, boosting risk confidence. Decorrelation with lower TFs allows flexible management, controlled accumulation, tight stops at 114.7K.
__________________________________________________________________________________
Macro & BTC Context Summary (Twitter)
__________________________________________________________________________________
Macro: US tariff shock, max volatility likely, amplified moves in equities and crypto.
Bitcoin: Sharp correction post-record close, but solid supports remain, no sign of trend end.
Integration: Technical status quo; favor defensive accumulation, caution on NFP/PMI.
__________________________________________________________________________________
Actionable Synthesis: Plan & Risk Management
__________________________________________________________________________________
Strategies: Longs/scalp >114.7K; swing/accumulate post daily/4H confirmation; partial TPs near 119.7K/122.3K.
Risk Zones: Hard stop <114.5K. Tight monitoring around NFP for volatility spikes.
Reward: Risk-to-reward >2 if buying lower range with strict stops.
__________________________________________________________________________________
Key Macro Events to Watch
__________________________________________________________________________________
2025-08-01: US NFP, unemployment, hourly wages – High volatility expected, possible swings
2025-08-01: ISM Manufacturing PMI – Short-term trend confirmation or invalidation
2025-07-30: FED conference – Range-bound / Moderate volatility
US Tariffs (Trump) – Global risk-off, caution BTC & tech
__________________________________________________________________________________
Conclusion
__________________________________________________________________________________
BTC consolidates steadily between 114.7K–122.3K despite macro shocks
Daily/H4 supports robust, Risk On / Risk Off Indicator strong on higher TFs
Accumulation/scalping favored as long as supports defended
Main risk = break of 114.7K, imminent macro volatility
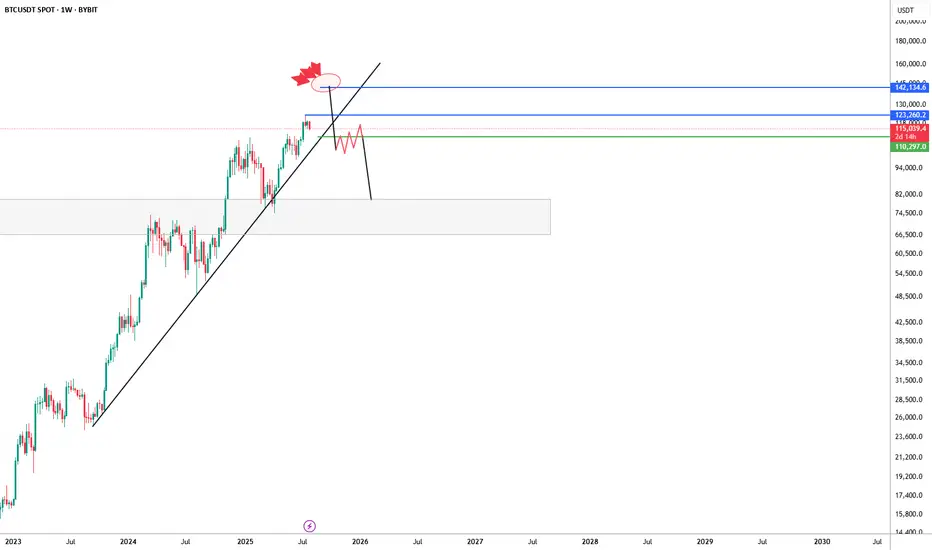
BTC/USDT Weekly – Bearish Rejection Brewing?Bitcoin has been riding a strong uptrend supported by a long-term ascending trendline, but recent price action is showing signs of exhaustion near the $123K–$142K supply zone.
The chart suggests a potential deviation above resistance, marked by a fakeout wick and aggressive rejection (highlighted with red blast icon). If price fails to reclaim and hold above $123K, the structure risks breaking down below trendline support — opening the door to a larger correction.
🔹 Key Resistance Zone: $123,260–$142,134
🔹 Critical Trendline Support: Recently broken — watch for retest/failure
🔹 Bearish Confirmation: Clean break & lower high formation under $109K
🔹 Next Major Demand Zone: $75K–$85K region
This setup leans bearish unless bulls can reclaim the upper blue range and re-establish control. If not, we could be looking at a significant macro retest of previous breakout levels.
#Bitcoin #BTC #BTCUSDT #CryptoChart #TrendReversal #BearishScenario
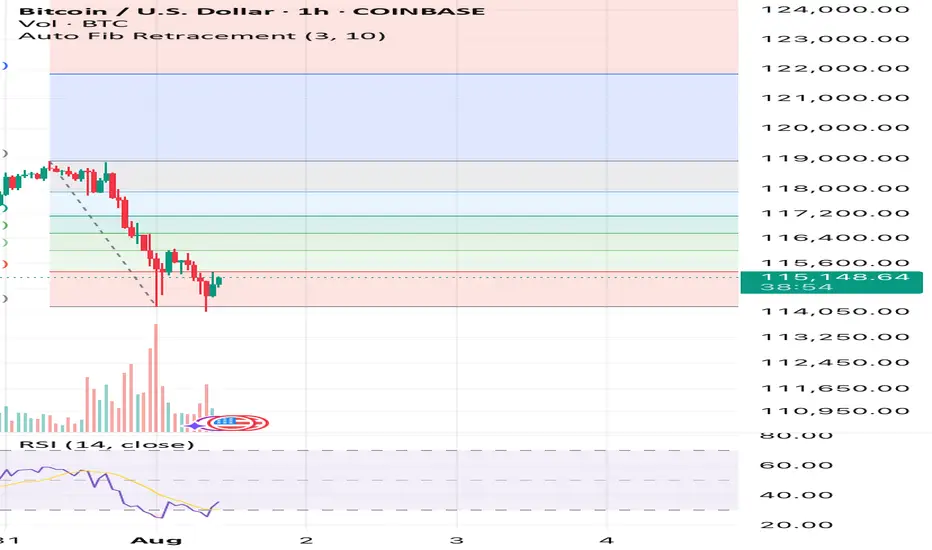
Bitcoin has an upside to it if we hold above $14,900See what you think it’s simple Auto Fib Retracement and RSI. That’s all I’m using here and also past times and other data outside of this image but inside the CRYPTOCAP:BTC market.
What you think? Up to $118k again before down or sideways? Or will this be the end of the large bull flag formation? We’ll soon find out!
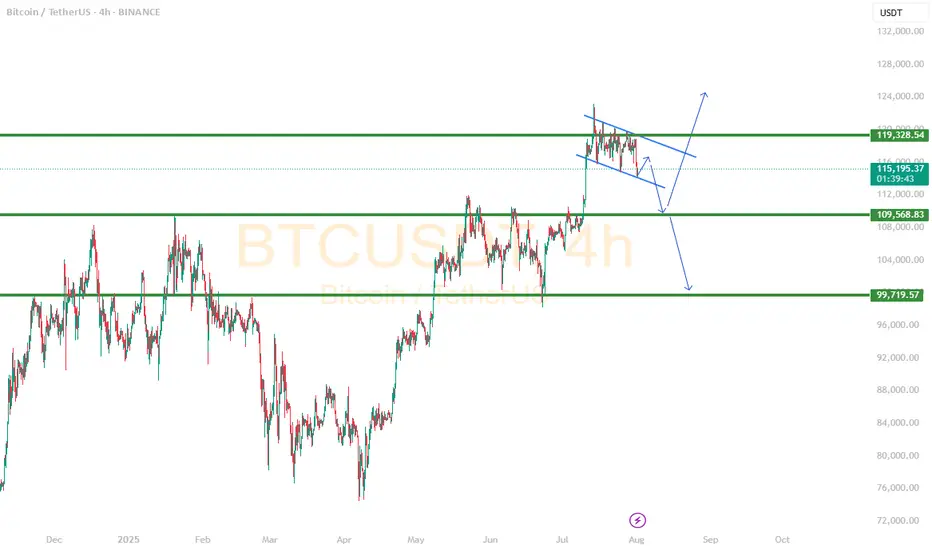
Two simple scenarios could playing out The buying pressure has been slightly less over the last week, I see a small improvement today but later this weekend, it is still likely to head downward towards the 110k area.
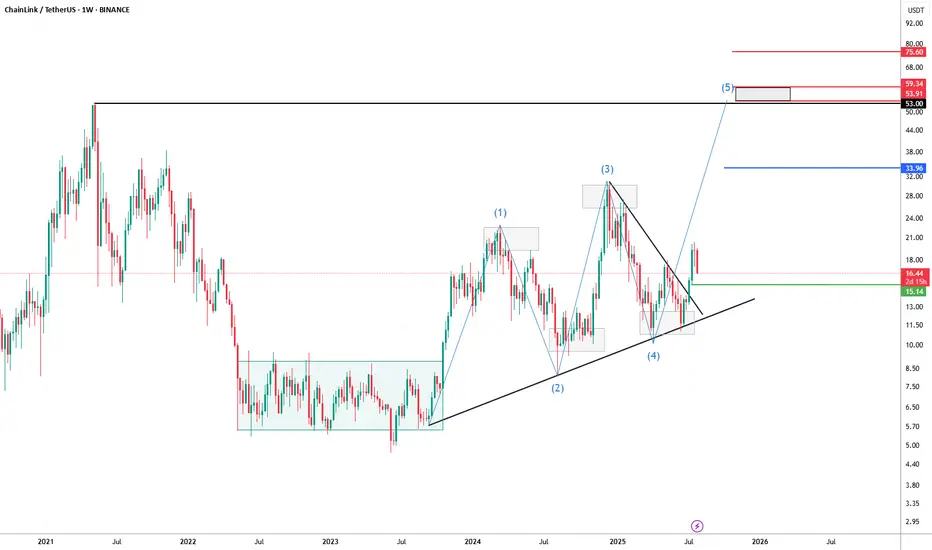
LINK/USDT Weekly Chart – Wave 5 in Play?Chainlink has been showing a textbook technical setup. After spending most of 2023 in a prolonged accumulation phase (highlighted in the range-bound consolidation box), price action broke out and has since been respecting a clear harmonic and Elliott Wave structure.
We’ve now likely completed waves (1) through (4), with a clean breakout from the wedge suggesting the beginning of the final 5th impulsive wave. The projected target zone for wave (5) sits between $53 and $59, aligning with key historical resistance and Fibonacci extension levels.
🔹 Support Zone: $15.14 — key structure and prior breakout level.
🔹 Mid-Level Target: $33.96 — potential resistance and consolidation area.
🔹 Final Target Area: $53.00–$59.34 — Wave 5 objective.
🔹 Stretch Target: $75.60 — if momentum exceeds expectations.
The ascending trendline from mid-2022 continues to act as dynamic support, helping guide this move. As long as the structure holds, the bullish thesis remains intact.
📈 Watching for confirmation of continuation and volume follow-through as we head into Q4.
#LINK #Chainlink #LINKUSDT #CryptoTA #ElliottWave #Harmonics #Altcoins
$BTCtime to run it back from here little more to go for H4 reclaim then looking for the thick white line to be reclaimed
stop below range low

BTC in a Sideways MovementBTC in a Sideways Movement: When the Market Froze, Psychology Starts to Fail
Honestly, this is one of the most difficult stages in the market - uncertainty without a clear direction. Bitcoin gets stuck between levels, giving false breakouts and immediately rolling back. It seems that something serious is about to happen, but in reality, nothing happens.
This kind of price movement often leads to emotional burnout of traders. Some start entering trades blindly, just to stay in the market. Others suffer a series of small losses, trying to guess the breakout. And some just close the charts, unable to cope with the silence.
The reality is that markets get tired too, especially after big moves. What we are seeing now with BTC is probably just a rebalancing phase. And that's okay. If there is no clear pattern, then this is not your trade.
For now, I am just watching, marking the boundaries of the range and waiting. For myself, I highlight the order block for 1D as zones of interest, I wait for a reaction from it and will look for a model to enter a position.
Any breakthrough, confirmed by volume and subsequent movement - that's when the next real movement will begin.
The main thing is not to waste energy in vain. Sideways movement is not eternal. After silence, movement always comes.
Liquidity sweep to $111,000 then bounce to new ATHBTC must see a liquidity sweep down to the previous resistance level of around $111k wiping out the over leveraged longs before a push to new highs. We are seeing this slowly unfolding now where a push down to $114k has just happened. Soon a momentary push down to $111k hitting old resistance levels and the currently 50 day moving average will occur with a quick bounce back to $114-$115k.
THIS IS WHEN WE WILL SEE NEW ATH’s🚀🚀