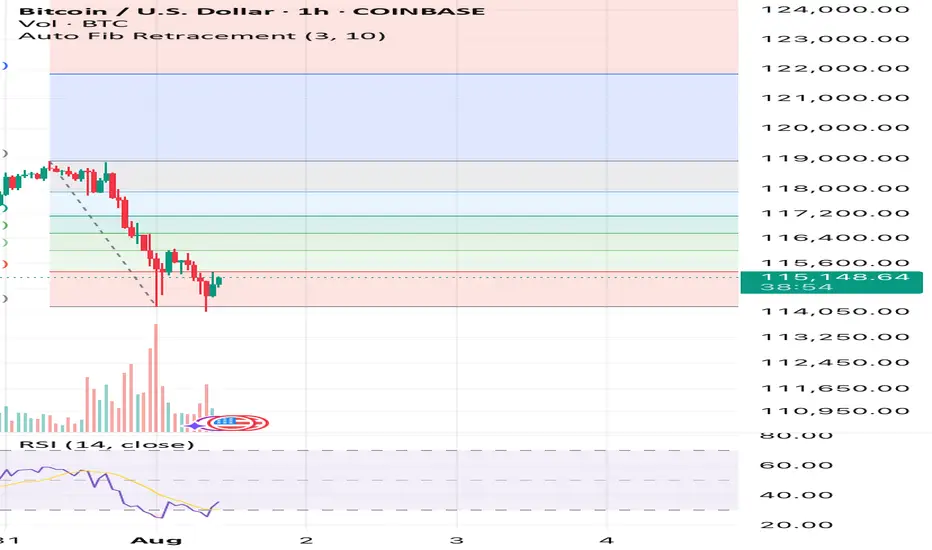
Bitcoin has an upside to it if we hold above $14,900See what you think it’s simple Auto Fib Retracement and RSI. That’s all I’m using here and also past times and other data outside of this image but inside the CRYPTOCAP:BTC market.
What you think? Up to $118k again before down or sideways? Or will this be the end of the large bull flag formation? We’ll soon find out!
Crypto market
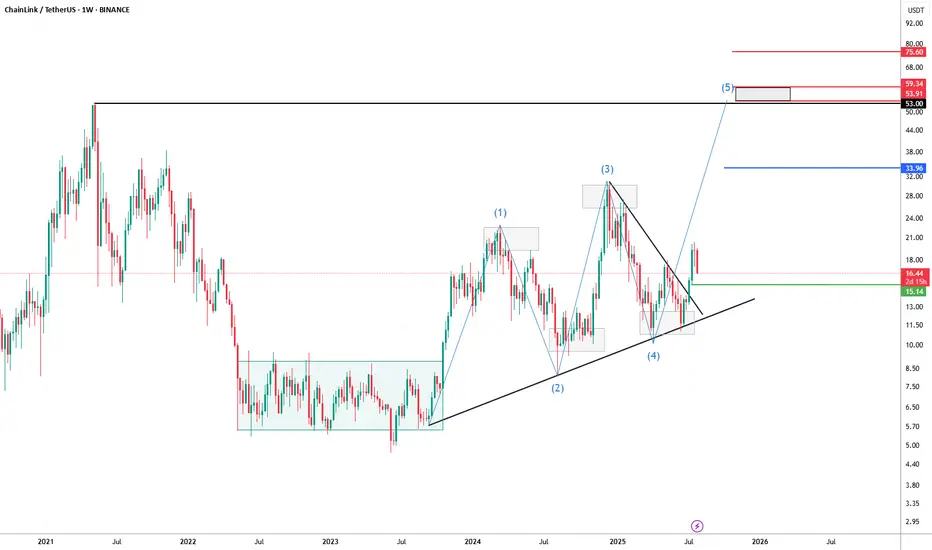
LINK/USDT Weekly Chart – Wave 5 in Play?Chainlink has been showing a textbook technical setup. After spending most of 2023 in a prolonged accumulation phase (highlighted in the range-bound consolidation box), price action broke out and has since been respecting a clear harmonic and Elliott Wave structure.
We’ve now likely completed waves (1) through (4), with a clean breakout from the wedge suggesting the beginning of the final 5th impulsive wave. The projected target zone for wave (5) sits between $53 and $59, aligning with key historical resistance and Fibonacci extension levels.
🔹 Support Zone: $15.14 — key structure and prior breakout level.
🔹 Mid-Level Target: $33.96 — potential resistance and consolidation area.
🔹 Final Target Area: $53.00–$59.34 — Wave 5 objective.
🔹 Stretch Target: $75.60 — if momentum exceeds expectations.
The ascending trendline from mid-2022 continues to act as dynamic support, helping guide this move. As long as the structure holds, the bullish thesis remains intact.
📈 Watching for confirmation of continuation and volume follow-through as we head into Q4.
#LINK #Chainlink #LINKUSDT #CryptoTA #ElliottWave #Harmonics #Altcoins
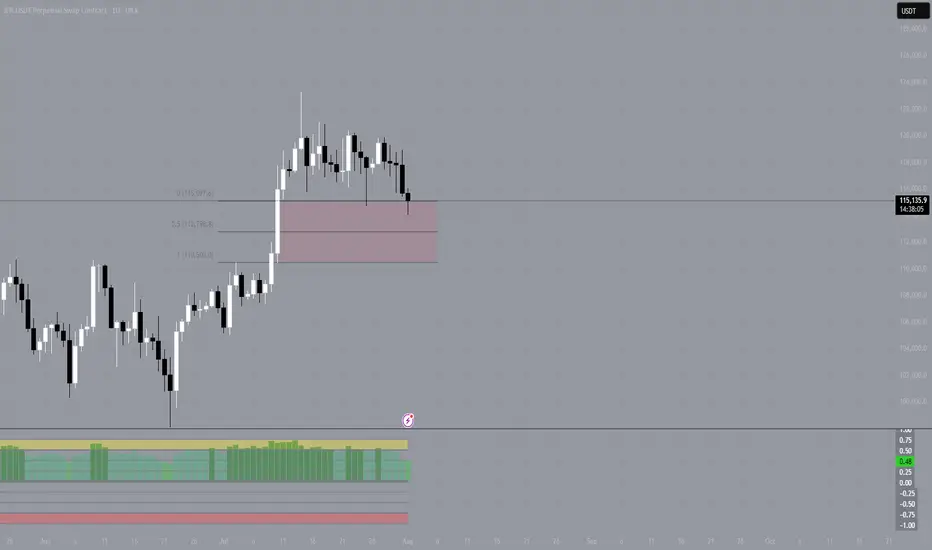
$BTCtime to run it back from here little more to go for H4 reclaim then looking for the thick white line to be reclaimed
stop below range low

BTC in a Sideways MovementBTC in a Sideways Movement: When the Market Froze, Psychology Starts to Fail
Honestly, this is one of the most difficult stages in the market - uncertainty without a clear direction. Bitcoin gets stuck between levels, giving false breakouts and immediately rolling back. It seems that something serious is about to happen, but in reality, nothing happens.
This kind of price movement often leads to emotional burnout of traders. Some start entering trades blindly, just to stay in the market. Others suffer a series of small losses, trying to guess the breakout. And some just close the charts, unable to cope with the silence.
The reality is that markets get tired too, especially after big moves. What we are seeing now with BTC is probably just a rebalancing phase. And that's okay. If there is no clear pattern, then this is not your trade.
For now, I am just watching, marking the boundaries of the range and waiting. For myself, I highlight the order block for 1D as zones of interest, I wait for a reaction from it and will look for a model to enter a position.
Any breakthrough, confirmed by volume and subsequent movement - that's when the next real movement will begin.
The main thing is not to waste energy in vain. Sideways movement is not eternal. After silence, movement always comes.
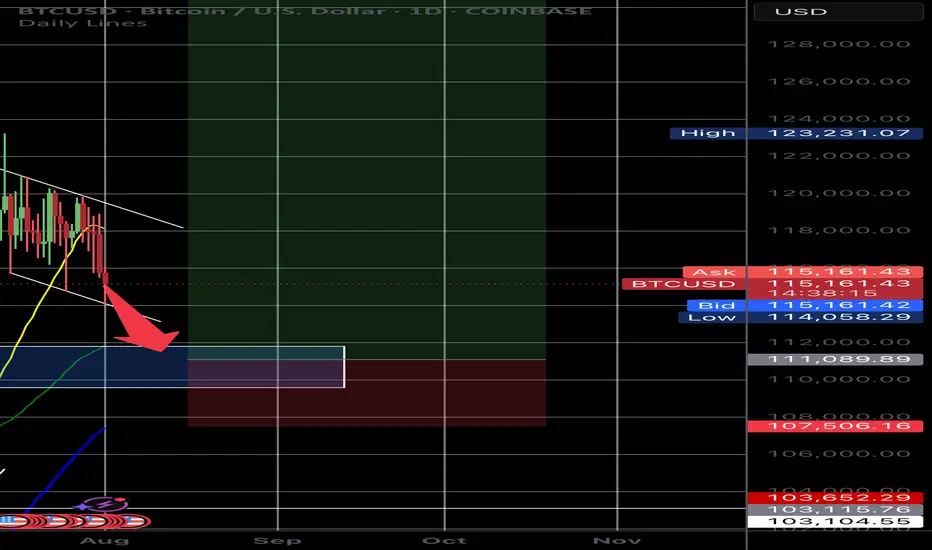
Liquidity sweep to $111,000 then bounce to new ATHBTC must see a liquidity sweep down to the previous resistance level of around $111k wiping out the over leveraged longs before a push to new highs. We are seeing this slowly unfolding now where a push down to $114k has just happened. Soon a momentary push down to $111k hitting old resistance levels and the currently 50 day moving average will occur with a quick bounce back to $114-$115k.
THIS IS WHEN WE WILL SEE NEW ATH’s🚀🚀
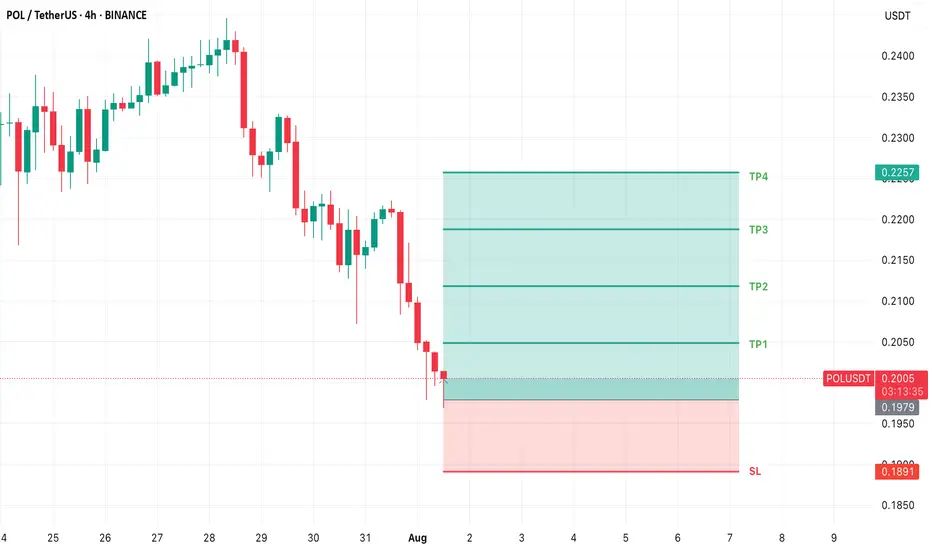
POL USDT LONG TRADE SETUPNew Trade Setup: POL-USDT
LONG
Entry: 0.1979 OR CMP
Target: TP1: 0.2049, TP2: 0.2118, TP3: 0.2188, TP4: 0.2257
Stoploss: 0.1891
Leverage: 1X
Technical Analysis: POL/USDT has been facing strong resistance, and a price reversal may occur soon in the short term.
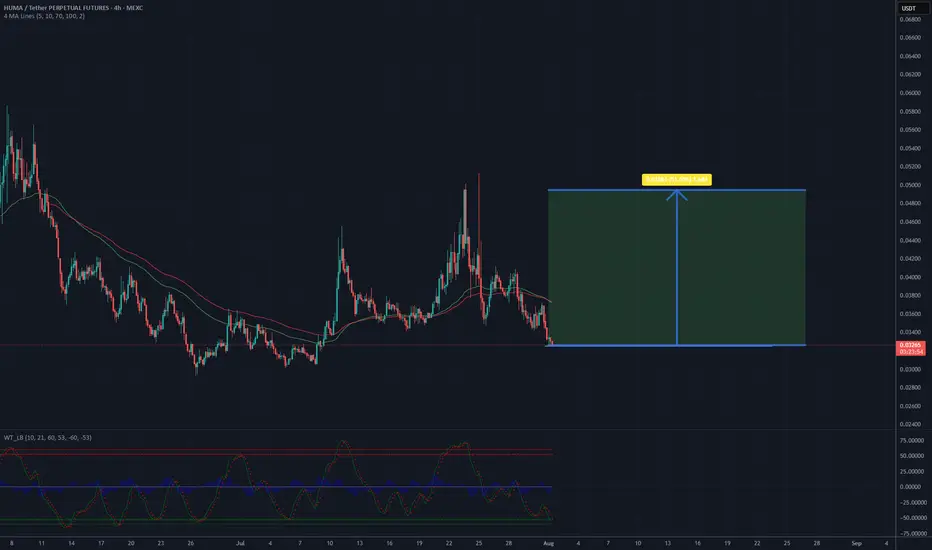
Is it a time fore HUMA? 50% profit - 0.05 USD TargetThe analysis of the HUMAUSDT chart on Binance highlights several key points. The current price is around 0.032764 USD, close to a local low. A clear downtrend is visible since the July peak, but recent days suggest a potential rebound, which could mark the start of an upward movement.
A suggested rise to 0.05 USD (approximately 52% from the current level) is feasible if the price breaks through the resistance around 0.037 USD and stays above the moving average (e.g., 50-day, as shown on the chart). The increase could be supported by rising volume and positive oscillator signals (e.g., RSI above 30, indicating an exit from oversold conditions). A key support level is at 0.03 USD – a drop below this could invalidate the bullish scenario.
I recommend monitoring the breakout above resistance and confirming the trend. For more detailed data, I can perform a DeepSearch to check current market sentiment.
Correction coming in....This channel is not providing individualized trading or investment advice, nor is it a banking service, brokerage service, trading service, investment service or money management service

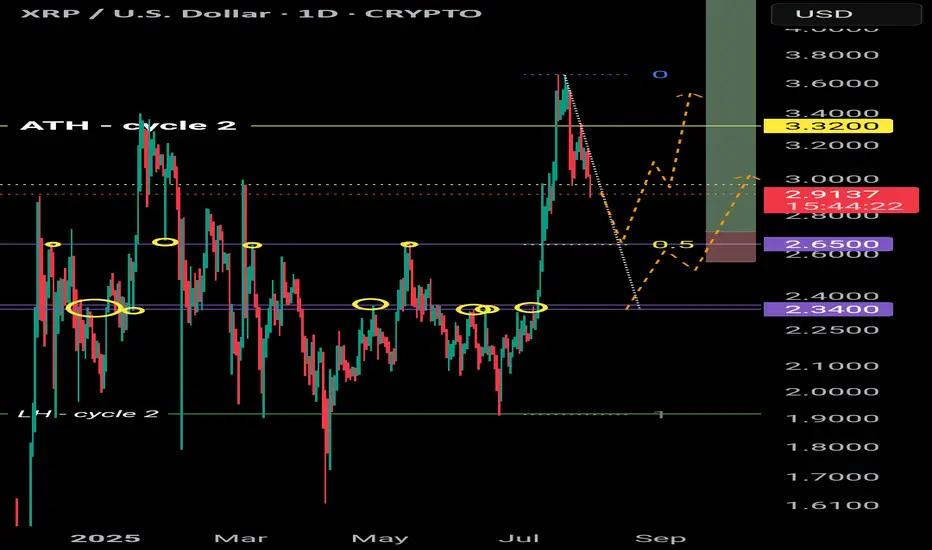
XRP retracement levelsWhere is XRP next likely to head next?
$2.65 is the next price level down with 4 points of contact. This level was also a weekly high as well as the 0.5 fibbonachi.
Next level down is $2.34 with 6 points of contact.
There is a downtrend forming so a breakout of this trend could be bullish for XRP 📈
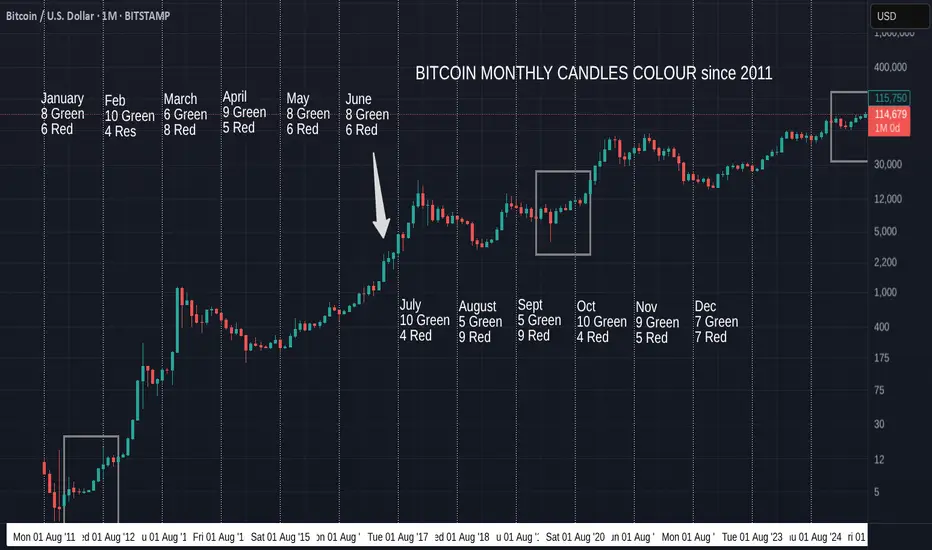
Bitcoin Monthly Candle Colour patterns and Colours since 2011
We got the expected GREEN July and so, amazingly, we continue to repeat the pattern from January to July 2012. ( Left Box )
It is almost the same pattern as 2020, apart from the Red May candle in that Year. (Right box)
The Large Arrow points towards another occasion where we had a series of consecutive Green candles from March to July, though these candles sizes are nothing like the ones we are currently experiencing.
The Boxes show us The only 2 occasions where we have had a Green December, Red January, Red February, Green March, Green April.
Then we had a Green May 2012 and a Red May 2020
Then both repeated a Green June, Green July.
The thing to note here is how all these are en-route to Cycle Highs.
So, August count currently is 5 Green to 9 Red, so the Odds are, while looking at BTC History, that we will get a RED August
HOWEVER, if we continue this run of following previous patterns, we will see a GREEN August.
In fact, 3 of those 5 Green August closes were in these 3 patterns mentioned.
Every single one of the 5 Green previous August followed a Green July, the last time was in 2021.
As mentioned in last months report, the size of the candles currently in this pattern are more like those in 2020 than the other 2 patterns talked about here.
With this in mind, we may expect a smaller Green candle close for August , Followed by a small Red candle in September. This did also happen in 2017 ( Arrow).
This August has opened Red but so far this year, many month opens were red and then changed.
So, My expectation id for a small Green August as markets cool off over the holidays and we wait for the start of Q4 in October.
We will have to wait and see as ever
Stay safe
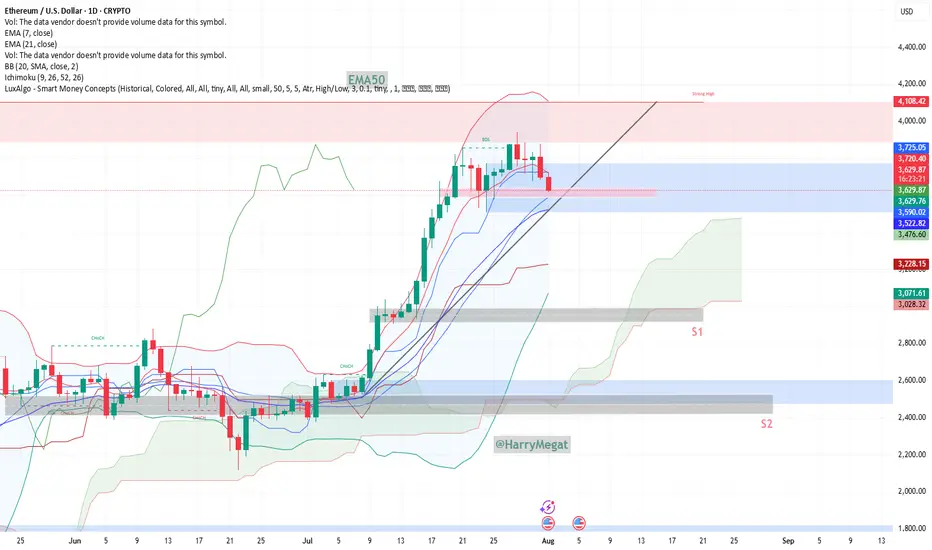
Ethereum (ETH/USD) Technical InsightsEthereum (ETH/USD) Technical Insights
**Chart Overview**
* **Current Price**: \~\$3,631
* **EMA 7 (Red Line)**: \$3,720.80
* **EMA 21 (Blue Line)**: \$3,522.96
* **Key Support Zone (Pink area)**: \~\$3,600–\$3,650
* **Support 1 (S1)**: \~\$2,950
* **Support 2 (S2)**: \~\$2,500
* **Uptrend Line**: Still intact, but under pressure
**Technical Insights**
* **Price Breakdown**: ETH has dropped below the **EMA 7**, and is now testing a **critical horizontal support zone** around **\$3,600–\$3,650**.
* **Trendline**: Still holds, but ETH is **hovering just above it**, signaling a potential bounce or breakdown.
* **EMA 21** near \$3,522 is the next short-term support if \$3,600 fails.
* **Momentum**: Recent candles show **strong selling**, indicating weakness, but no full breakdown yet.
**Bullish Scenario**
*Conditions**:
* Price **holds above** \$3,600–\$3,620 zone and the **trendline**
* **Bounce** with bullish daily candle from current zone or above \$3,650
**Buy Setup**:
* **Entry**: \$3,620–\$3,650 on confirmation
* **Stop-loss**: Below \$3,520 (just under EMA 21)
* **Targets**:
* TP1: \$3,720 (reclaim EMA 7)
* TP2: \$3,850–\$3,940
* TP3: \$4,100+
**Bearish Scenario**
**Conditions**:
* Price **breaks below** \$3,600 and **the trendline**
* EMA 21 is lost with strong bearish candle
**Sell Setup**:
* **Entry**: Below \$3,580 on breakdown
* **Stop-loss**: Above \$3,650
* **Targets**:
* TP1: \$3,520 (EMA 21)
* TP2: \$2,950 (S1)
* TP3: \$2,500 (S2)
**Bias: Neutral with Bearish Lean**
* **Decision Zone**: ETH is at a key inflection point
* Wait for **confirmation**: bounce or breakdown before entering
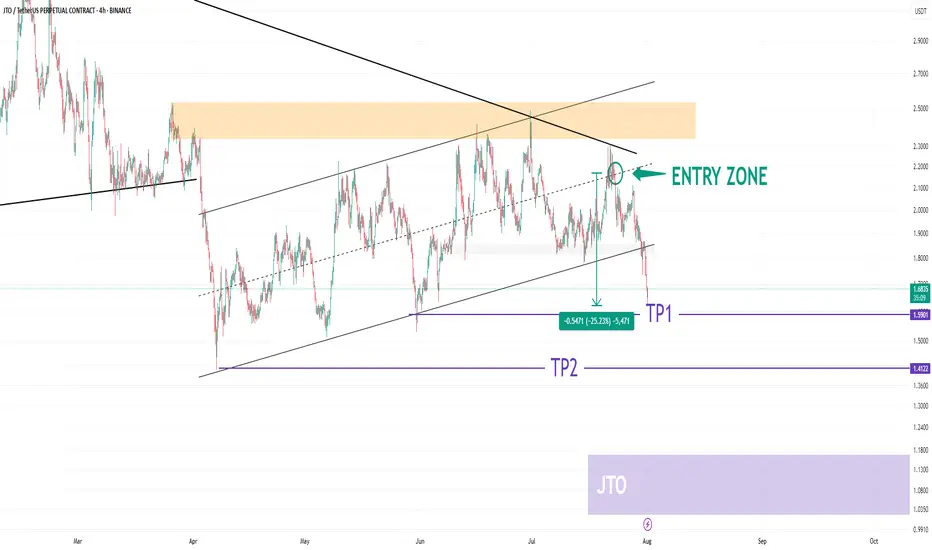
JTO USDT UpdateHELLO 😍
JTO Update
💁♂️ -25% 🔥
I shared this analysis when it was in the entry section. It would be nice to have an update of this analysis.
The JTO cryptocurrency has corrected 25% since the entry zone.
We saw a very good analysis together. What do you think? 😊💖
You can save some profit from the position in this area. 🐱
Please don't forget to like, share, and boost so that I can analyze it for you with more enthusiasm. Thank you. 💖😍
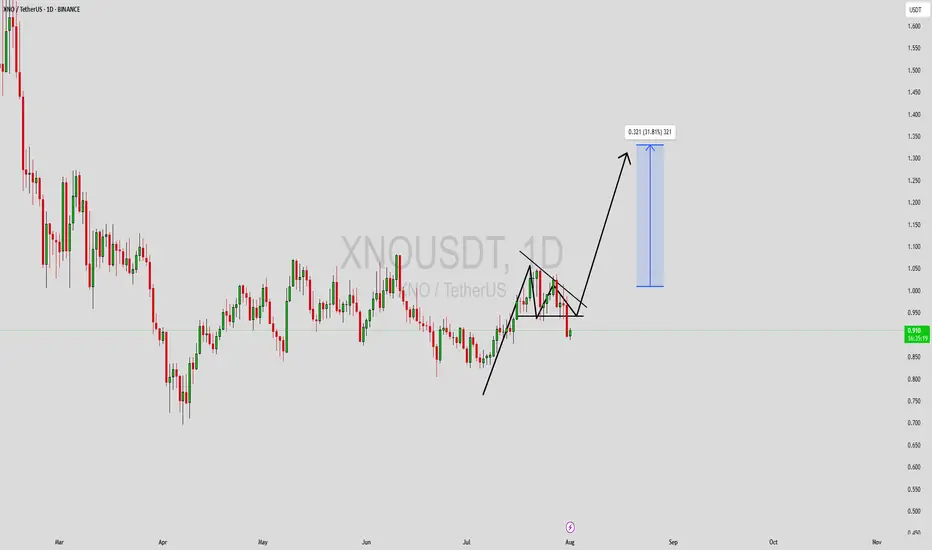
XNOUSDT Forming Bullish PennantXNOUSDT is currently displaying a bullish pennant pattern on the charts, which typically signals a continuation of the prior upward trend after a brief consolidation. This formation is marked by converging trendlines and reduced volatility, often setting the stage for a sharp breakout to the upside. With bullish momentum already in place, traders are closely monitoring this setup for confirmation of the next leg up.
The trading volume remains supportive, maintaining a steady flow that could power a breakout beyond the pennant resistance line. A breakout with a strong volume spike would indicate renewed buying pressure, which could push prices up by 20% to 30% or more. This makes XNO an attractive short-term opportunity for technical traders looking to capitalize on momentum-driven setups.
Investor interest around XNO has been gaining traction, especially as smaller altcoins with solid patterns begin to outperform during market recoveries. The bullish pennant adds to the credibility of this setup, especially in combination with favorable sentiment and increased watchlist mentions across trading communities.
Given the structure and volume dynamics in play, XNOUSDT is positioned for a potential bullish surge if key resistance levels are breached. This pattern, combined with current market conditions, could offer a favorable risk-reward ratio for traders watching for breakout confirmation.
✅ Show your support by hitting the like button and
✅ Leaving a comment below! (What is You opinion about this Coin)
Your feedback and engagement keep me inspired to share more insightful market analysis with you!
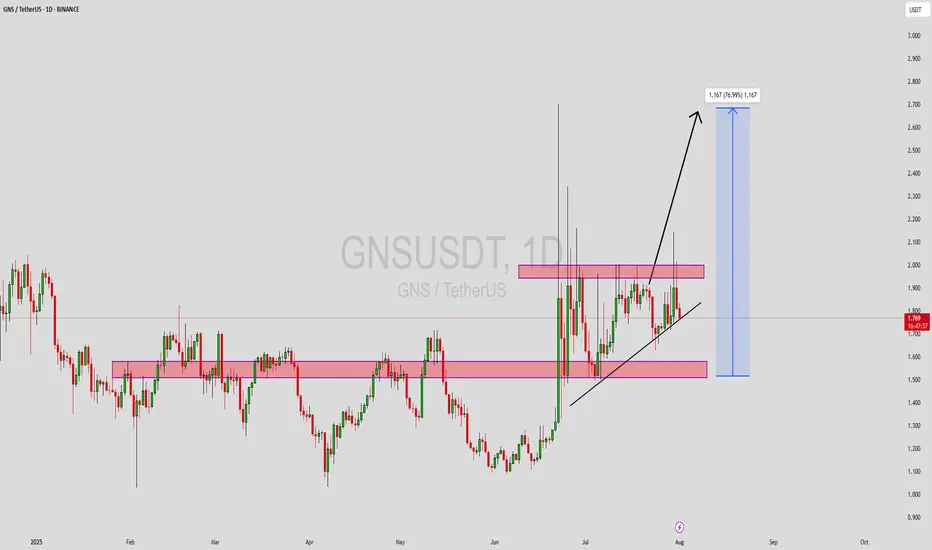
GNSUSDT Forming Bullish ContinuationGNSUSDT is exhibiting a bullish continuation pattern, suggesting that the existing uptrend is poised to extend further. This technical formation often signals market strength and the likelihood of higher highs after a brief consolidation phase. With current price action forming higher lows and tightening within a structure that favors breakout potential, traders are closely watching for a decisive move upward.
The trading volume remains consistently strong, a key confirmation that the breakout, once it occurs, could be supported by sustained market interest. GNS has also demonstrated resilience against broader market fluctuations, which speaks to underlying investor confidence. As long as price remains above the identified support levels and continues to respect trendline structures, a move toward the 60% to 70% gain target appears realistic in the coming weeks.
Investor sentiment around GNS is increasingly positive, with growing social media chatter and technical analysts pointing out the potential for mid-cap altcoins to outperform. The bullish continuation pattern only adds weight to this optimism, particularly if upcoming candles close above the breakout zone on strong volume. This scenario often acts as a catalyst for rapid price movement.
With its solid fundamentals, strong volume profile, and a favorable chart structure, GNSUSDT is well-positioned for bullish continuation. Traders looking for trending assets with potential for solid upside returns should keep this crypto pair on their radar.
✅ Show your support by hitting the like button and
✅ Leaving a comment below! (What is You opinion about this Coin)
Your feedback and engagement keep me inspired to share more insightful market analysis with you!
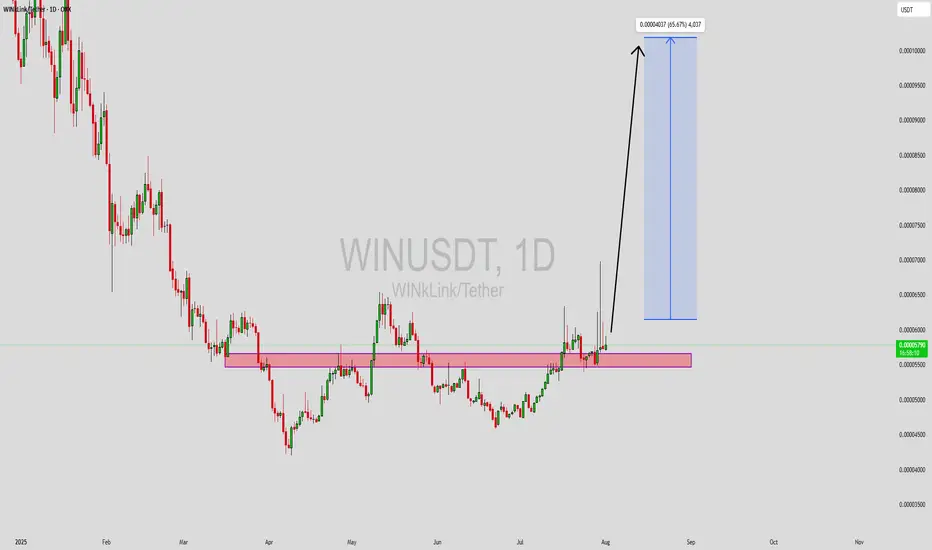
WINUSDT Forming Bullish ReversalWINUSDT is currently showcasing a classic bullish reversal pattern, indicating a potential shift from its recent downtrend toward an upward trajectory. This pattern is typically observed at market bottoms and often serves as a signal for a strong rebound. With solid volume support accompanying the recent candles, market participation is increasing—suggesting that smart money may be accumulating positions ahead of a major breakout.
Technically, WIN has tested and respected key support zones multiple times, strengthening the validity of this reversal formation. The price structure suggests growing momentum, and if it breaks above its immediate resistance level with a confirmed candle close, it could trigger a new bullish wave. Based on the pattern's breakout potential and measured move targets, a 50% to 60% price gain is reasonably anticipated in the short to mid-term.
Moreover, WIN is gaining attention across trading forums and crypto communities due to its low market cap and historical tendency to deliver sharp rallies once momentum shifts. This adds to its speculative appeal and could attract more volume and volatility in the days ahead. Traders seeking early entries into potentially explosive moves should keep a close eye on this coin.
Overall, WINUSDT presents a compelling technical case supported by strong demand zones and a classic bullish setup. If current levels hold and breakout confirmation arrives, the coin could offer lucrative returns for disciplined traders.
✅ Show your support by hitting the like button and
✅ Leaving a comment below! (What is You opinion about this Coin)
Your feedback and engagement keep me inspired to share more insightful market analysis with you!
Bullish Bat (1.272 Target)Bullish Bat Harmonic Pattern Discovered on the Larger Timeframes for ENA-USDT. 1.272 Fibonacci Target. 3:1 Trade Setup

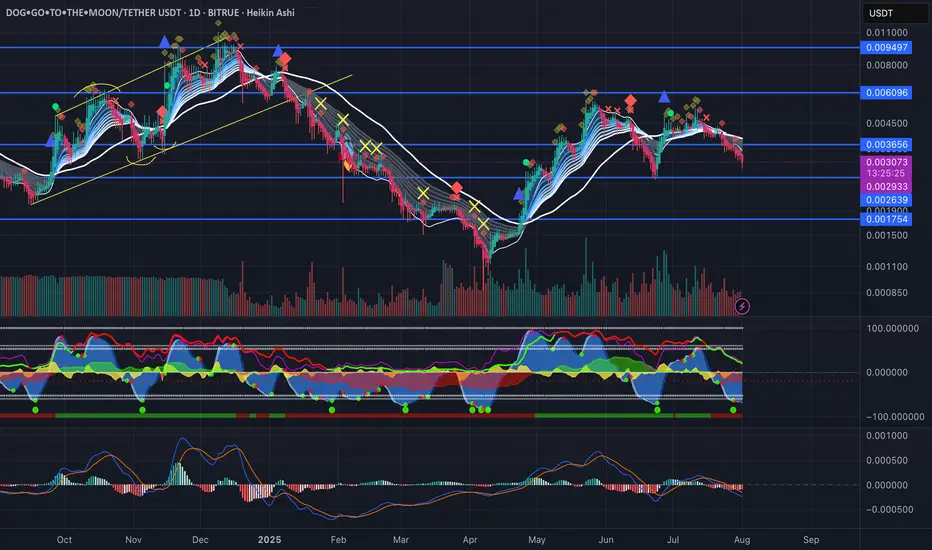
DOGSeems like we getting a cool down going into August. More sideways CHOP ahead nothing new. HODL the line..
ENA 8H +164% From Trend Entry, But Can Support Hold?The MACD Liquidity Tracker Strategy caught a clean +164.38% move on ENA after price reclaimed both the 60 and 220 EMAs with MACD momentum flipping bullish.
The entry came just as consolidation ended and trend expansion began — no early exits, no chop. Price is now testing the 60 EMA again, which has acted as dynamic support throughout the run.
If bulls defend this zone, continuation remains on the table. But if it cracks, a deeper pullback could be in play.
📊 Strategy Settings:
MACD: 25 / 60 / 220
EMA Filter: 60 & 220
Mode: Normal
Timeframe: 8H
Educational analysis. Let’s see how this plays out.

BTC?
Hi,
How do you stay bullish, when price is moving lower.
Ofcoz,
With knowledge & own research
Securitizing you entries.
Example:
Yest.. price was about to break, failed.
I'm thinking
www.investing.com
What USD is doing (DXY), it's retesting LOW that had broken in May 2025
check yourself pls.
POSITIONING SELF:
I'm willing to take bullish moves.
i) Bearish Trendline broken
ii) Bullish pattern
Might repeat, few times with stops.
Because, pattern only give you higher % probability not CERTAINTY.
And money management IS ONLY thing you could control.
Not a guru
All the best

ETH 4H – 58% Trend Ride From MACD Liquidity StrategyThis Ethereum 4H setup shows the power of a clean trend-following system. The MACD Liquidity Tracker Strategy (Normal Mode) entered long on July 1st after price reclaimed both the 60 and 220 EMAs — a major shift in directional bias confirmed by MACD momentum flipping bullish.
From there, ETH trended smoothly for weeks, gaining +58.35% before the strategy exited automatically as momentum waned and MACD flipped bearish. No overtrading, no manual input — just clear structure, confluence, and filter-based entries.
Now, we’re seeing pink candles return and price struggling to hold the 60 EMA. A continued breakdown here could open the door toward $3,400–$3,500 support. Bulls must reclaim $3,750+ quickly to confirm continuation.
📊 Strategy Breakdown:
– MACD: 25 / 60 / 220
– EMA Filter: 60 & 220
– Mode: Normal
– Timeframe: 4H
Educational content. Drop thoughts or questions below — let’s break it down together.

#XRPUSD 1st Aug Looking for one more move higherBINANCE:XRPUSD Looking for one more push to higher, and bullish as far as IV is intact. Any rally should find buyers in 3-7 swings and reach one more high minium.

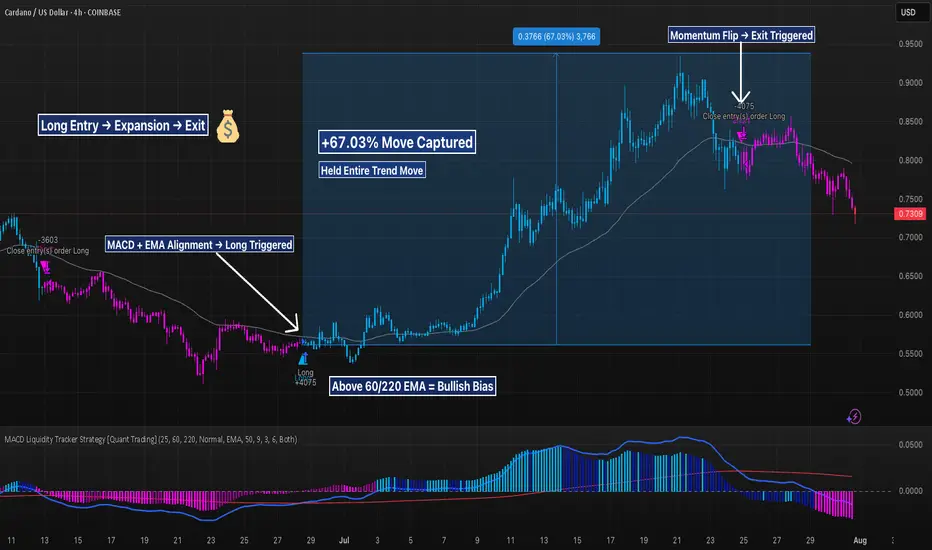
ADA 4H – 67% MACD Long Captured, But Is Trend Breaking?ADA just printed a textbook 67.03% move using the MACD Liquidity Tracker Strategy (Normal Mode). The system triggered long on bullish MACD crossover confluence with the 60/220 EMA trend filter — signaling the first real momentum shift after weeks of sideways action.
Price rallied from ~$0.56 to over $0.93, with the strategy holding the entire trend thanks to its filter logic: no early exits, no noise, just directional conviction. The exit fired only after MACD flipped bearish and price fell back below the trend EMAs.
Now, we’re watching the $0.72–$0.74 zone — a key support structure from early July. Momentum is weakening, pink candles are printing, and if bulls can’t reclaim the EMAs soon, a deeper pullback toward $0.68–$0.70 is likely.
📊 Backtest Snapshot:
– MACD: 25 / 60 / 220
– Trend Filter: 60 EMA + 220 EMA
– Strategy Mode: Normal
– Timeframe: 4H
BTCUSD ShortBTCUSD is now net short on the regression break.
I am hedging out my cold wallet holdings.
