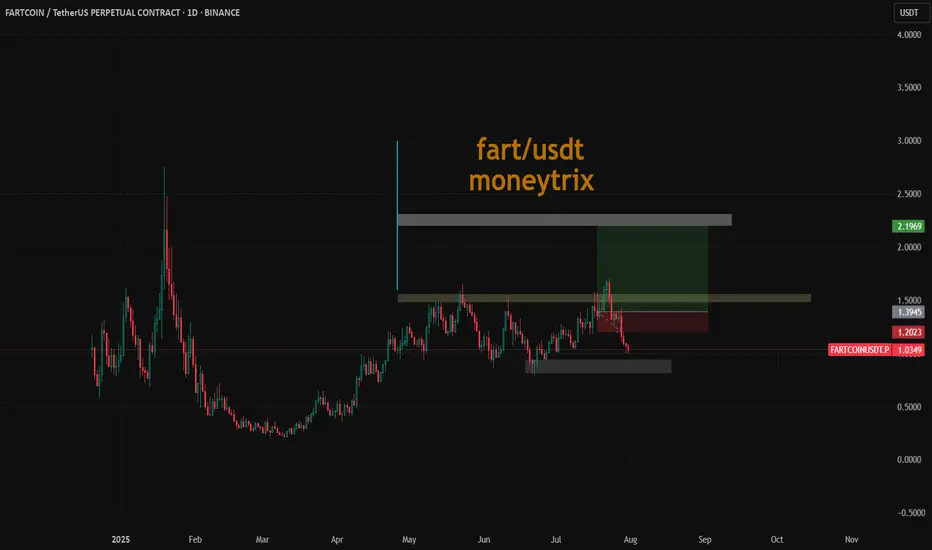
fart long entry soon as per analysisits not afinancial advice #dyor
evry thiong is mentioned on chart as u can see clearly
and this is strongly bullish until turn this below order block to breaker blok with heavy volume
Crypto market
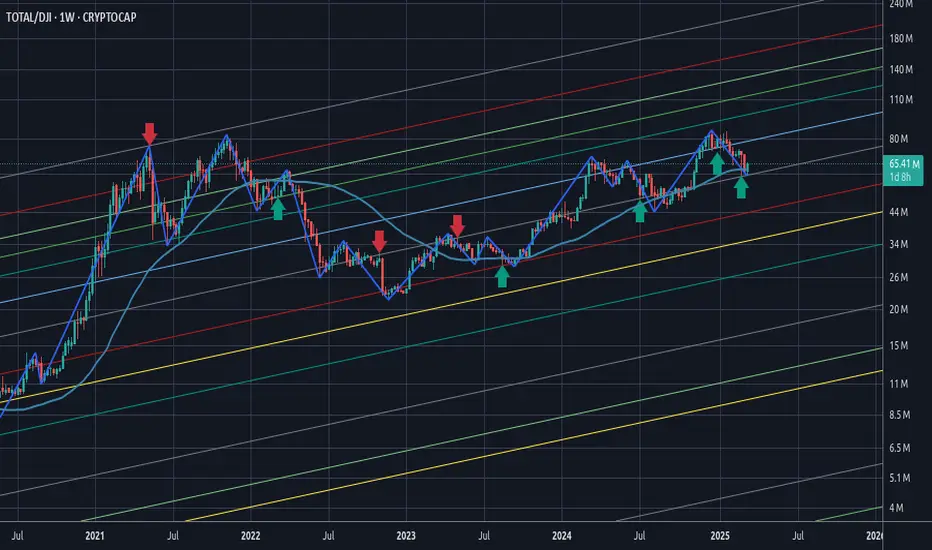
Money Flow - 2### Money Flow Spread from DJI to Cryptocurrency: A Fibonacci Perspective
The financial markets operate in an interconnected ecosystem where capital flows between asset classes based on macroeconomic trends, investor sentiment, and risk appetite. One such dynamic involves the movement of funds from traditional markets like the **Dow Jones Industrial Average (DJI)**—a barometer of blue-chip stocks—to emerging asset classes such as **cryptocurrencies**. This phenomenon can often be analyzed using **Fibonacci retracements and extensions**, which serve as powerful tools for identifying key support, resistance, and potential price targets during shifts in market momentum.
#### 1. **Market Sentiment and Capital Rotation**
- The DJI represents large-cap equities that are heavily influenced by institutional investors, central bank policies, and global economic conditions. When these factors trigger volatility or uncertainty in traditional markets, investors may seek alternative investments with higher growth potential or hedging properties.
- Cryptocurrencies, known for their decentralized nature and high volatility, attract speculative capital during periods when confidence in traditional assets wanes. For instance:
- During bearish trends in the DJI, characterized by falling prices and increased selling pressure, some investors might reallocate portions of their portfolios into cryptocurrencies like Bitcoin (BTC) or Ethereum (ETH).
- Conversely, bullish trends in the DJI could signal improved risk appetite, prompting a portion of crypto gains to rotate back into equities.
#### 2. **Fibonacci Retracements: Identifying Key Levels**
- Fibonacci retracement levels are derived from the Fibonacci sequence and are widely used in technical analysis to predict areas of support and resistance. These levels (e.g., 23.6%, 38.2%, 50%, 61.8%) help identify potential turning points in price action.
- In the context of money flow from the DJI to cryptocurrencies:
- A significant decline in the DJI could lead to a pullback to Fibonacci retracement levels (e.g., 38.2% or 61.8%). At these junctures, traders may reassess their positions and consider diversifying into cryptocurrencies.
- Similarly, after a sharp rally in cryptocurrencies, prices might retrace to Fibonacci levels before continuing upward. Investors exiting equities due to underperformance might view these retracements as entry points for digital assets.
#### 3. **Fibonacci Extensions: Projecting Price Targets**
- While retracements focus on corrective moves within a trend, Fibonacci extensions project potential price targets beyond the initial move. Common extension levels include 127.2%, 161.8%, and 261.8%.
- In scenarios where money flows out of the DJI and into cryptocurrencies:
- If the DJI experiences a prolonged downtrend, its losses could coincide with outsized gains in cryptocurrencies. Fibonacci extensions can help forecast how far crypto prices might rise amid this influx of capital.
- For example, if Bitcoin breaks above a key resistance level following a surge in inflows from equities, traders might use Fibonacci extensions to estimate future price milestones (e.g., $100,000 or $200,000).
#### 4. **Psychological Drivers Behind the Transition**
- Fibonacci levels resonate with traders because they align with natural human tendencies toward symmetry and proportion. This psychological aspect amplifies their relevance when analyzing cross-market dynamics.
- As money exits the DJI and enters cryptocurrencies, Fibonacci-based trading strategies provide a framework for understanding how participants perceive value across different asset classes. For instance:
- Institutional investors exiting equities might anchor their decisions around Fibonacci-derived thresholds, ensuring disciplined entry and exit points in volatile crypto markets.
- Retail traders, who dominate much of the cryptocurrency space, also rely on Fibonacci tools to time their trades, creating self-reinforcing patterns that influence overall market behavior.
#### 5. **Case Study Example**
- Imagine a scenario where the DJI drops sharply due to rising interest rates or geopolitical tensions. The index falls from 35,000 to 30,000—a decline of approximately 14%. Traders observe Fibonacci retracement levels at 38.2% ($31,900) and 61.8% ($33,100), expecting temporary bounces at these levels.
- Simultaneously, Bitcoin rallies from $20,000 to $30,000 as investors seek refuge in digital gold. Using Fibonacci extensions, analysts project further upside to $38,200 (127.2%) or even $48,500 (161.8%), attracting additional capital from equity markets.
#### 6. **Conclusion**
- The interplay between the DJI and cryptocurrencies highlights the fluidity of modern financial markets. By leveraging Fibonacci retracements and extensions, traders can better anticipate shifts in money flow and position themselves strategically.
- Whether driven by macroeconomic headwinds, technological innovation, or evolving investor preferences, the migration of capital from traditional indices like the DJI to digital assets underscores the growing convergence of old and new finance. Fibonacci analysis serves as a bridge, offering insights into both the timing and magnitude of these transitions.
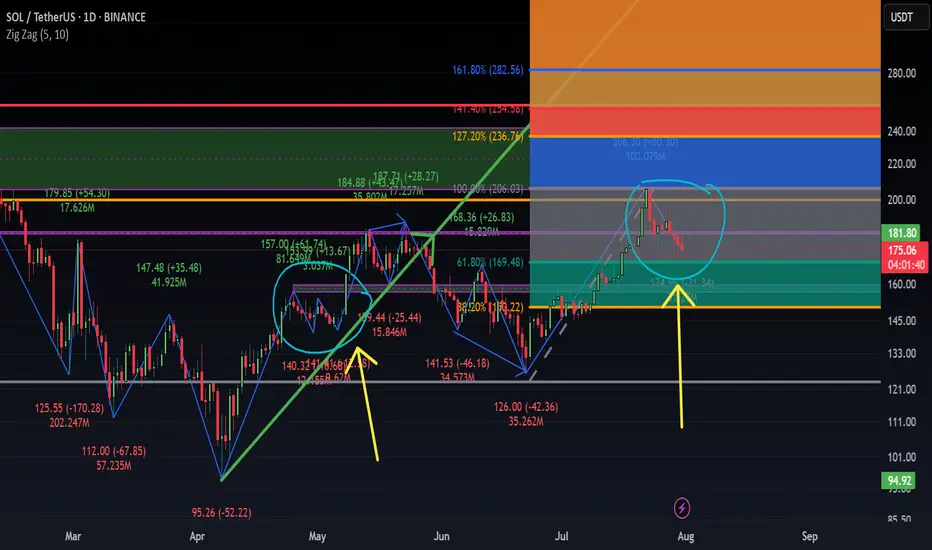
fart/usdt buy side trade dyorthis is formation of wave structure and handle cup formation
but DYOR im not a financial advisor

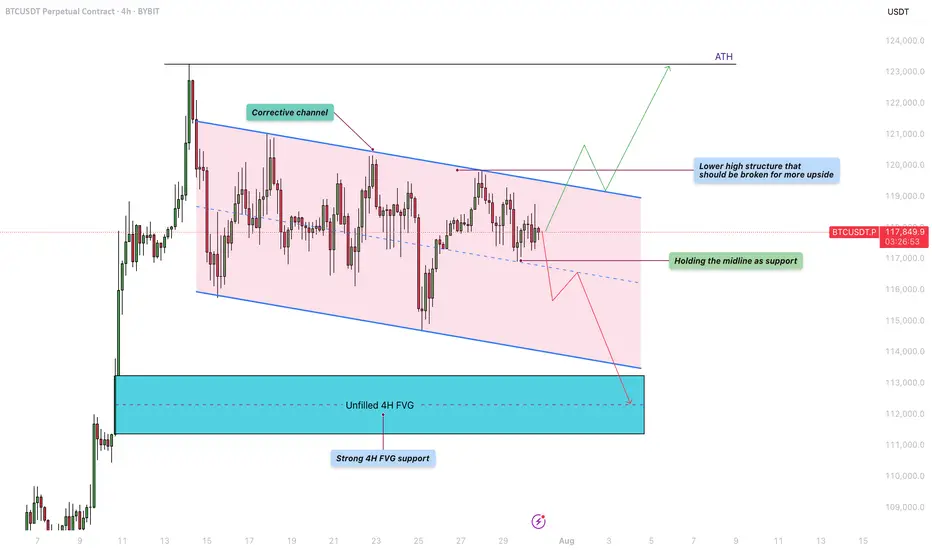
Bitcoin - Will the liquidity at $122K be the next target?Bitcoin is currently trading within a defined corrective channel, which has been developing over the past few weeks. Price action within this structure has been characterized by a sequence of lower highs and lower lows, suggesting a mild downtrend. However, these movements lack strong momentum, indicating that the market is consolidating rather than entering a deeper correction. This kind of structure often precedes a significant breakout, and given the nature of the current price action, a retest of previous highs remains a realistic possibility.
Bullish Scenario
Looking at the overall structure of the channel, a bullish breakout seems increasingly likely. For this scenario to unfold, BTC needs to hold the midline of the channel as support. If this level is respected, it could pave the way for a push towards the upper boundary of the channel and a potential break above the lower high structure near $120,000. A successful breach of that level could trigger a move toward the $122,000 liquidity zone, with the potential to challenge the all-time high (ATH) in the near future. Holding the midline and breaking above key resistance would provide confirmation of strength and continuation to the upside.
Bearish Scenario
On the flip side, if BTC fails to hold the midline as support and starts closing below it on the 4H timeframe, we could see a renewed move toward the lower boundary of the corrective channel. This could lead to a test of the unfilled 4H fair value gap (FVG) highlighted in the chart, located around the $112,000 – $113,000 area. This zone also coincides with a strong historical support level, making it a logical area where buyers might step in and provide the momentum needed for a more sustainable bullish reversal.
Final Thoughts
While both scenarios remain valid, the price structure within the corrective channel currently leans slightly more toward a bullish outcome. The lack of aggressive selling and the potential for liquidity above the previous highs support this view. However, trading is never about certainty but about preparing for various possibilities. Being aware of both bullish and bearish setups allows traders to react with flexibility and discipline depending on how the market unfolds in the coming sessions.
-------------------------
Thanks for your support. If you enjoyed this analysis, make sure to follow me so you don't miss the next one. And if you found it helpful, feel free to drop a like 👍 and leave a comment 💬, I’d love to hear your thoughts!
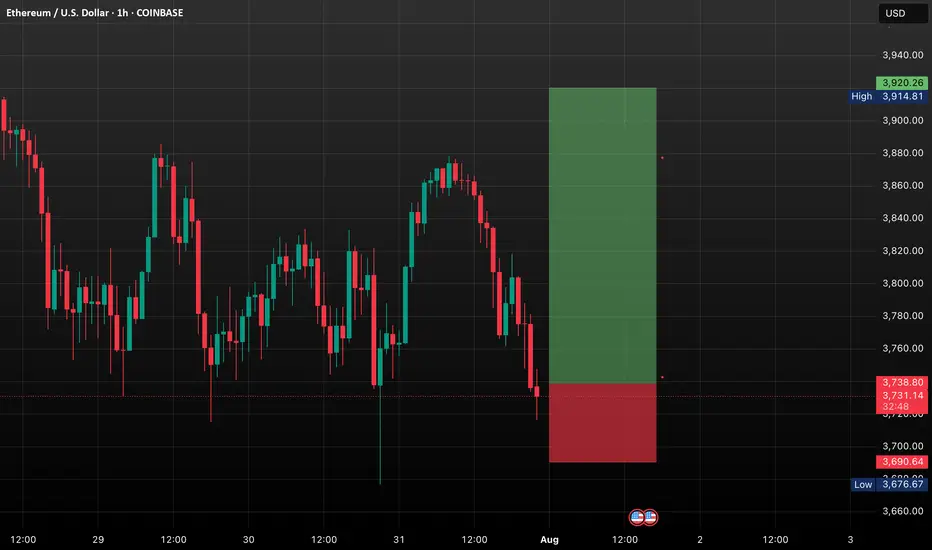
ETH BREAKOUT IMMINENT?Ethereum is currently trading around $3,726, holding just above key support levels, including the 50-day SMA and the psychological $3,700 zone. Despite a minor pullback, ETH continues to show signs of bullish strength and remains in a healthy uptrend.
Momentum indicators like RSI and volume show signs of recovery, and ETH is forming a bullish continuation pattern near resistance. If Ethereum can break above the $3,820–$3,850 zone, we are likely to see a quick push toward higher levels.
Ethereum is showing solid strength after consolidating above $3,700. The breakout attempt toward $3,850 will be critical. If bulls push through this level with volume confirmation, a move toward $3,900 and then $4000 becomes highly probable.
The market structure is constructive, and the presence of ETF-driven institutional demand adds further bullish pressure. While short-term volatility may create minor pullbacks, the medium-term setup favors upward continuation.
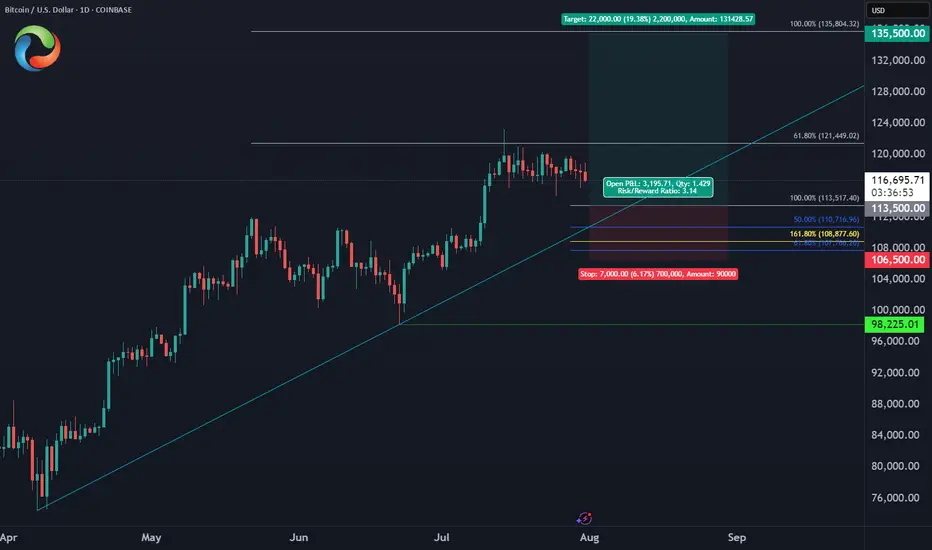
Bitcoin August Trade PlanBINANCE:BTCUSD
✅Entry Zone: $113,500 - $110,700
⛔️Stop: $106,500 (below June low)
🎯Target: $135,500 (ATH liquidity)
🔖Risk/Reward: 1:3

i confuse !!!i see bearish engulfing candle stick in weekly time frame what is going on a big retracement await of just trick us???!!

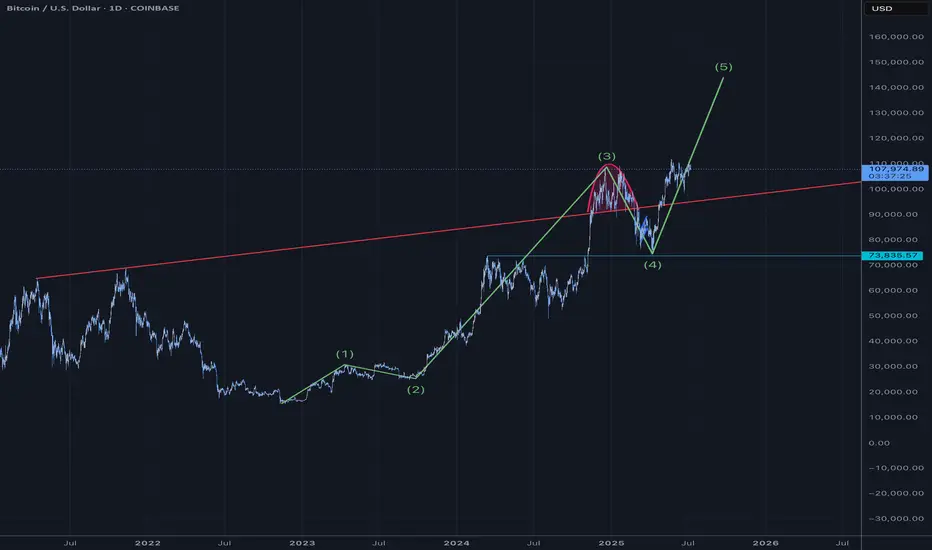
Bitcoin Elliot Wave CountBullish for the next 90 days
Blow off top thesis
Pump into rate cuts and Big Beautiful Bill.
Doge is a LaggerHello I am the Cafe Trader.
Today we are looking at DOGE.
Normally I refuse to look at "Meme Coins" but with a 33 Billion Dollar Market cap, I don't think it falls into it's own category.
Doge, like many Crypto, have come alive. If this is one you are looking at, here are the Keys:
Short Term
A new seller did prevail as of July 23rd. It's important to note that they are still not in control of this rally. We need to see a key buyer get taken out first. This leads us to the scenario I have drawn.
Green Machine
Big buyers move markets... A lot. They can't buy what they want to buy on the open market without a reaction, so what do they do? Simple
Buy... then wait... then buy again near where they bought before.
So your "Strong buyer" is that area.
You have passive buyers looking to get a good price at 19.223 This would offer the greatest position for a reversal and a continuation.
Long
Entry - .19.250
Stop - .17.050
1st TP .24.050
2nd TP .28.600
Final TP .38.250
This should take at least a month. Be prepared to not look at it everyday.
Long Term
These prices should reflect your sentiment on DOGE.
Aggressive = .20.650
Good Price = .18.900 - 19.250
STEAL = 13.950 - 14.550
Thanks for reading, Don't forget to Boost and Follow !
Happy Trading
@thecafetrader

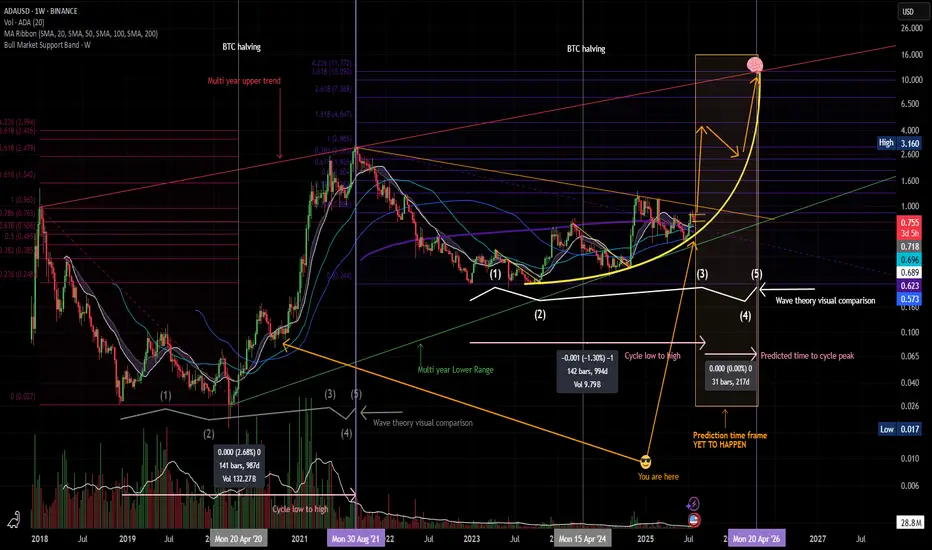
$ADA Macro ThesisGD To all
I have cleaned up and thrown a few other correlated patterns on the Chart for my Macro thesis.
You will have to watch the metrics and on chain data as well as sentiment to verify as we move fwd.
This is Pattern recognition on a Log Chart:
BINANCE:ADAUSD
I have been using this thesis since 2019 and have been able to successfully ident general buy/sell points ( weighing against real world events and on chain data )
I hope it helps you and feel free to ask questions.
Told ya I like crayons
Xrp - It all comes down to this!🚀Xrp ( CRYPTO:XRPUSD ) has to break structure:
🔎Analysis summary:
After Xrp created the previous all time high in 2018, we have been seeing a consolidation ever since. With the recent all time high retest however, Xrp is clearly showing some considerable strength. It all comes down to bulls being able to push price higher, above the massive horizontal structure.
📝Levels to watch:
$3.0
SwingTraderPhil
SwingTrading.Simplified. | Investing.Simplified. | #LONGTERMVISION

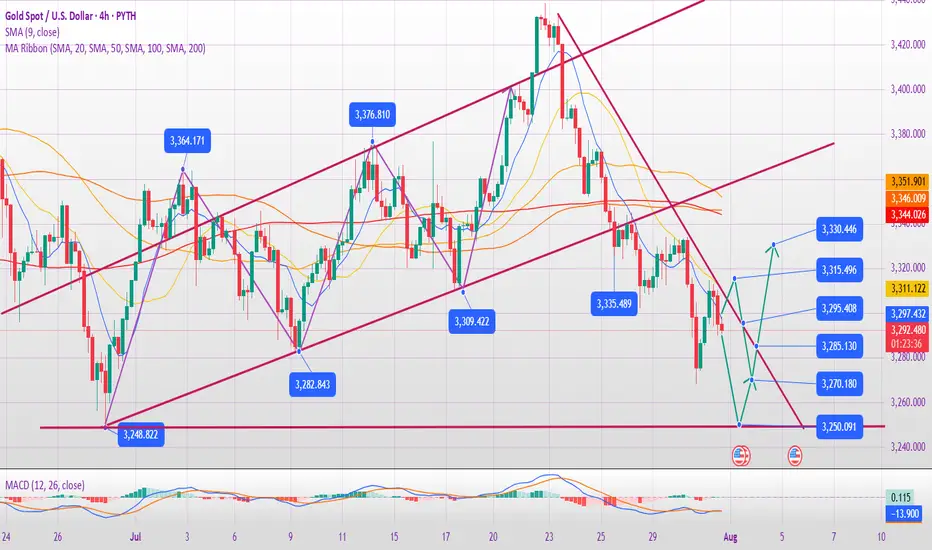
Will gold prices continue to fall on August 1st?
Core Logic Analysis
Negative factors dominate
The Federal Reserve's hawkish stance: keeping interest rates unchanged and Powell suppressing expectations of a rate cut have weakened gold's safe-haven appeal.
Strong economic data: ADP employment data exceeded expectations, and coupled with the upcoming PCE and non-farm payroll data, market expectations of an early Fed rate cut have cooled.
Technical Breakdown: Gold prices fell below the key support level of $3,300, hitting a new monthly low. A large weekly bearish candlestick chart indicates bearish dominance.
Key Support and Resistance
Resistance: 3315 (hourly rebound resistance), 3333 (previous high and daily resistance).
Support: 3280-3290 (short-term), 3250-3245 (strong monthly support).
Potential Risks
Unexpectedly weak non-farm payroll data or escalating geopolitical tensions could trigger a short-term rebound, but a break above 3330 is required to reverse the downward trend.
Today's Trading Strategy
Short-Term Trading
Primarily short at highs: Short lightly on a rebound to 3310-3315, stop loss at 3325, target 3290-3280.
Aggressive Short: Add to short positions if the price reaches 3330-3333, stop loss at 3340, target 3280.
Cautious Long: Try a long position on the first touch of 3250-3245, stop loss at 3235, target 3270-3280 (quick in and out).
Mid-term Strategy
If the monthly line closes below 3250, shorting at high levels can be continued in August, targeting the 3150-3100 range.
If the gold price rebounds above 3350 after the non-farm payrolls, the trend needs to be reassessed.
Events to Watch
Data:
Non-farm payroll report on Friday (if the data exceeds expectations, gold prices may fall further).
US June PCE Price Index (Federal Reserve inflation indicator).
Technical Signal:
A daily close below 3250 would confirm a medium-term downtrend.
Observe the recapture of the 3300 level, which serves as a dividing line between bulls and bears.
Summary
Gold is currently in a bearish phase. Prioritize shorting on rallies, but be wary of unexpected data fluctuations. If the mid-line breaks below 3250, the market could target the 3000-3100 range. Conversely, if it holds above 3330, strategy adjustments will be necessary. Strictly stop loss and control risks.
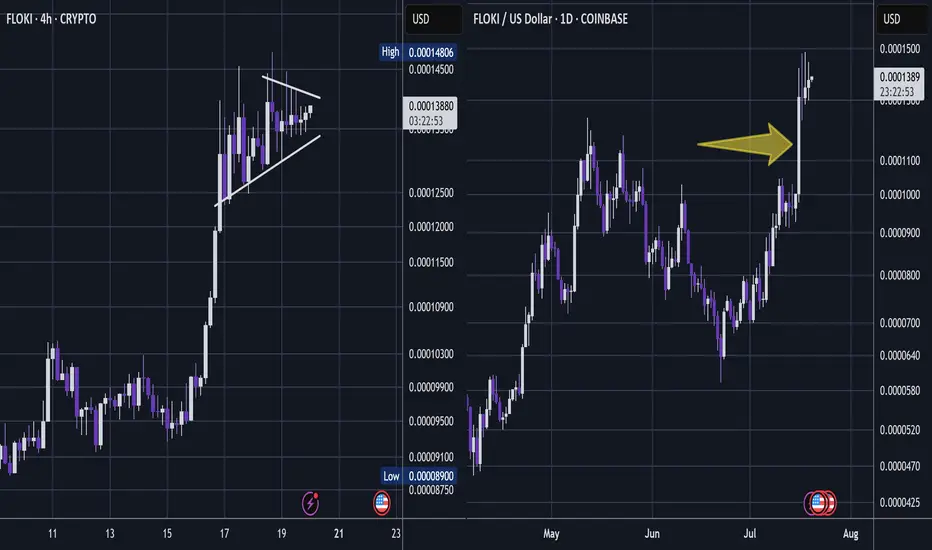
FLOKI - Oki Doki PumpJust one of many coins that I am picking in this area.
But these meme coins can have some pop - and so this is one I share with TradingView.
It had once nice push up (arrow) - signalling it has plenty of bullish potential.
The low time frame is choppy but the candles are both narrowing and shallowing -
I think this may be building pressure for a next wave up.
This analysis is shared for educational purposes only and does not constitute financial advice. Please conduct your own research before making any trading decisions.
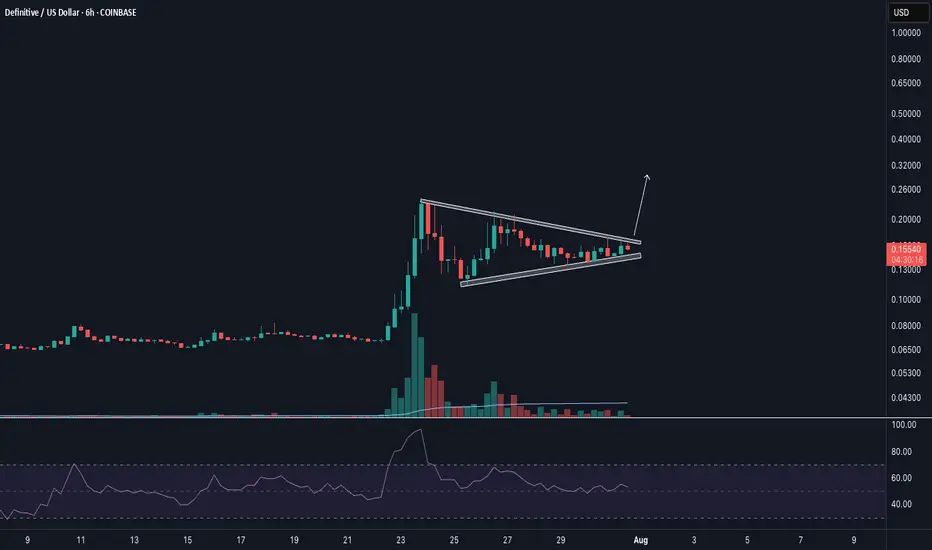
High Tight FlagDefinitive released an update to their trading product and a roadmap as well, which seemed to be well received by the market. Now developing a high tight flag on lower time frames. RSI reset.
Backed by Coinbase Ventures, among others
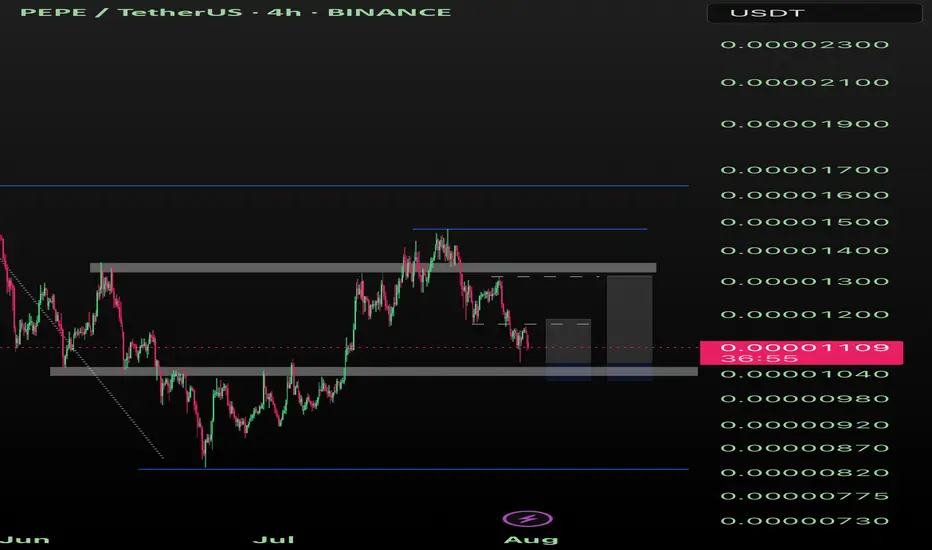
Pepe 10% or 25% Pepe could see a 10% - 25% pump after one more sweep to 1040 or even a hold for the week over 1040, for a trade.
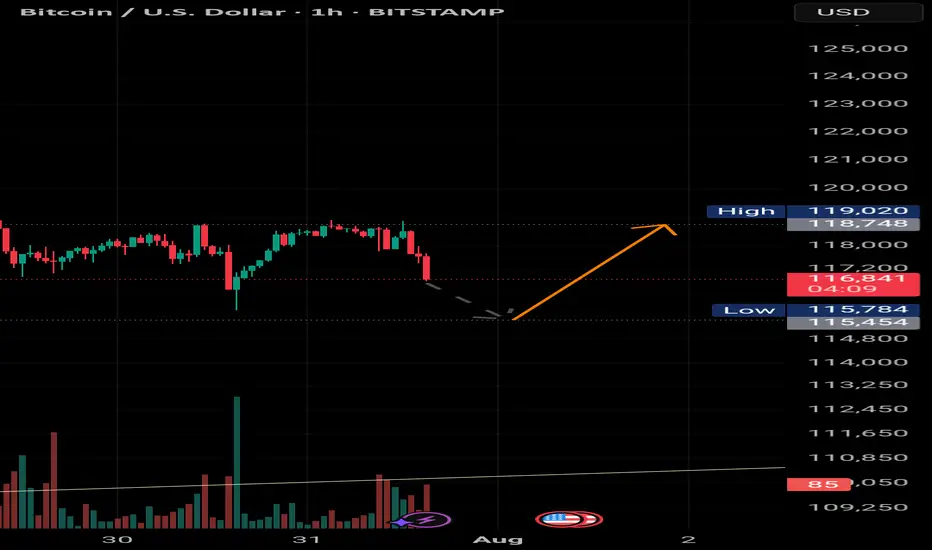
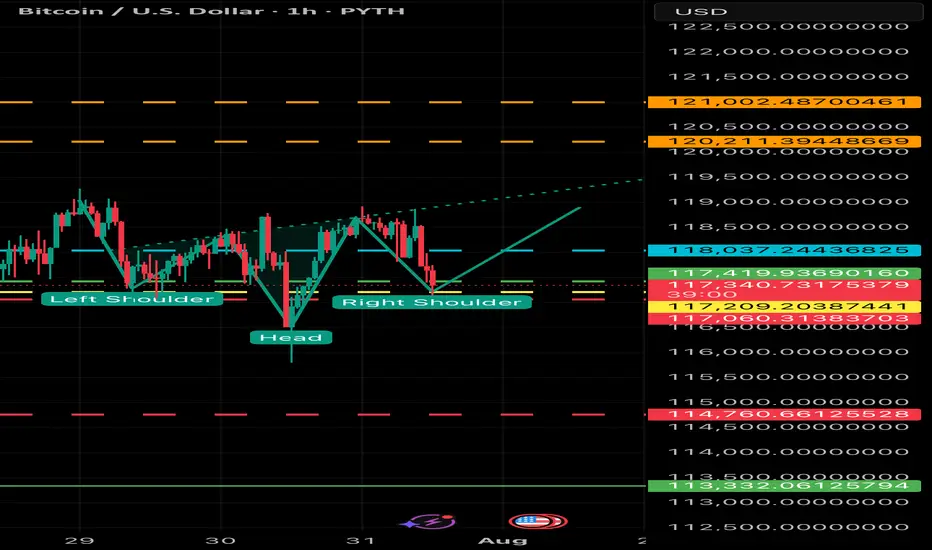
BULLISH BTC - Potential Inverted head and shoulders forming Potential breakout to $119 to $124,000 - Look for volume and support at $116 to $117,000. Breakout above $118,500 will confirm formation.
Potential Roadmap for BTC/USD In the next 30-40 daysVolatility incoming. It seems like BTC/USD is heading down to sweep some liquidity range at around 107-110,000.
However, market will recover after that, we are still in the "buy the dip" scenario.
End of August, I can personally still bet that BTC will sit higher than the current level

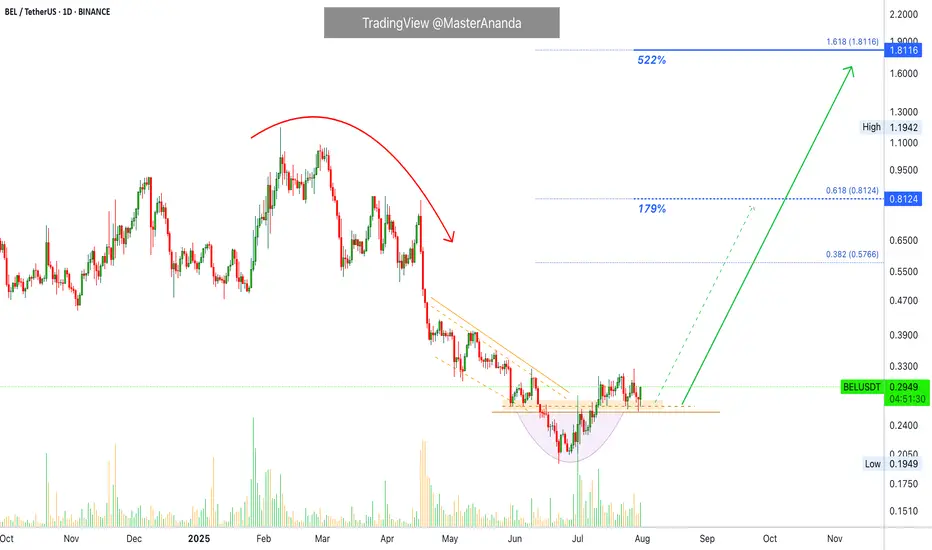
Bella Protocol 522% Easy Profits PotentialWe are going to be looking at many charts together every single day. We will go through all the altcoins basically. I am starting with some of those from the last period that didn't move. The charts look good but they filed to break their May high. These pairs are now ready to move before the rest of the market.
Here we have BELUSDT. A nice rounded bottom to end the downtrend. A small bullish recovery supported by high volume.
We have a perfect set of reversal signals and today a full green candle. This candle confirms those signals and opens up the chance of a strong advance. If the action starts now, you can be looking at the start of a major 2-3 months long move.
There will be some stops along the way but the action should be bullish nonetheless, higher highs and higher lows.
Strategy
In this setup we simply buy spot, no stop-loss. After buying we wait for as long as it is needed for prices to rise. Normally within 2-3 weeks, can be just a few days, but sometimes the wait can extend to 1-2 months. It varies. We are always prepared and ready to wait six full months, so if anything happens before this time horizon, even better but be ready to wait.
Even if you were to sell your current pair to buy a new one, the new one also requires waiting. We tend to sell wanting to find something that is moving but the moment we sell, we are faced with the same problem; even if the pair you chose is moving you have to wait for the bullish wave to develop. Even if prices rise 5% daily it would still take 20 days for a 100% price increase. 40 days for 200%. Etc. Patience is key.
So, simply, buy and hold. The market will take care of the rest.
Namaste.
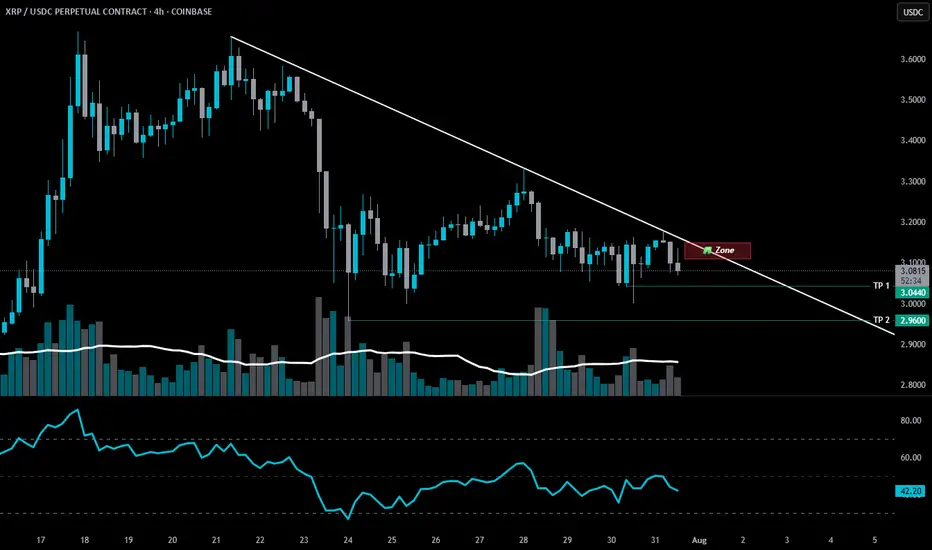
SHORT ZONE-XRP structure shiftThere was an XRP structure shift last week.
📉 It’s been bleeding ever since.
Now, another bearish setup is forming.
If XRP nears that descending trendline and fails to break through — it enters the SHORT ZONE.
🚫 No breakout? No mercy.
This isn’t the end for CRYPTOCAP:XRP — but a purge may be necessary before liftoff.
A proper cleansing to prepare for the next ascension.
🫡 xrpArmy, forgive me…
But hey, feel free to earn your keep.
Stay Sharp. Regulate Yourself.
🚫 100% NOT financial advice.
🎭 Edutainment purpiz only.
Will gold bottom out and rebound on July 31st?
1. Key News Drivers
Federal Reserve Policy Expectations: The market generally expects the Fed to maintain a hawkish stance. If economic data (such as ADP, GDP, and PCE) show strong performance, the expected rate cut may be further postponed, which is bearish for gold.
Geopolitics and Risk Aversion: Uncertainty in the US-China trade negotiations and the situation in the Middle East may temporarily support gold prices, but the market is currently more focused on macroeconomic data.
Dollar Trend: If the US dollar index continues to strengthen (driven by expectations of a Fed rate hike), it will suppress gold's rebound potential.
2. Key Technical Signals
Trend Break Confirmation:
The daily chart shows four consecutive declines below the 60-day moving average and the rising trend line, confirming a mid-term correction following the 3439 high.
The next key support is 3245 (previous low). If it falls below this, the price could drop to 3150-3120.
Short-term oversold rebound demand:
The RSI entered the oversold zone, and a technical rebound may occur.
Key rebound resistance level:
3315-3325 (near yesterday's high, short-term short position entry area)
3345-3350 (bull-bear watershed, strong resistance area)
3380-3400 (trend reversal confirmation point, ideal layout position for medium-term short positions)
3. Today's operation strategy
(1) Short-term trading (intraday)
Mainly high-short:
Rebound to 3315-3325, light position short test, stop loss 3335, target 3280-3270.
If it touches 3345-3350, you can add short positions, stop loss 3360, target 3300-3280.
Dip-buying strategy (caution):
If the price stabilizes after a pullback to 3280-3270, short-term buying is recommended, with a stop-loss at 3260 and a target of 3300-3310 (quick entry and exit).
4. Key Risks
Federal Reserve Policy Shift: If the Fed unexpectedly releases dovish signals (such as hinting at a rate cut), it could trigger a rapid rebound in gold prices.
Unfortunate Economic Data: If US GDP, PCE, and other data fall short of expectations, it could boost gold prices in the short term, but after the rebound, it will still be an opportunity to buy higher.
Escalating Geopolitical Conflict: If a major risk event occurs (such as a escalation in the Sino-US trade war), it could temporarily boost safe-haven buying.
Summary
Short-Term: Oversold rebounds may provide opportunities to sell high, with attention to resistance at 3315-3325 and 3345-3350.
Medium-Term: The trend remains bearish, with a target of 3245 to 3150. Any upward movement is considered an opportunity to enter a short position. Trading strategy: Mainly short on rebound, be cautious when buying long orders on rebound, and strictly set stop-loss to prevent unexpected fluctuations.
