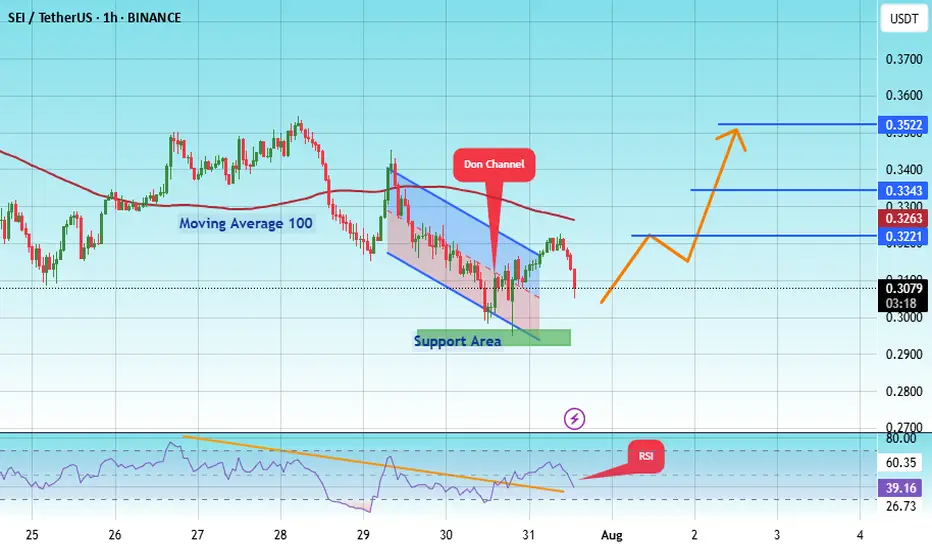
#SEI/USDT The best future belongs to this coin.#SEI
The price is moving within an ascending channel on the 1-hour frame, adhering well to it, and is on track to break it strongly upwards and retest it.
We have support from the lower boundary of the ascending channel, at 0.2967.
We have a downtrend on the RSI indicator that is about to break and retest, supporting the upside.
There is a major support area in green at 0.2950, which represents a strong basis for the upside.
Don't forget a simple thing: ease and capital.
When you reach the first target, save some money and then change your stop-loss order to an entry order.
For inquiries, please leave a comment.
We have a trend to hold above the 100 Moving Average.
Entry price: 0.3080.
First target: 0.3221.
Second target: 0.3343.
Third target: 0.3522.
Don't forget a simple thing: ease and capital.
When you reach your first target, save some money and then change your stop-loss order to an entry order.
For inquiries, please leave a comment.
Thank you.
Crypto market

#LEVER/USDT#LEVER
The price is moving within an ascending channel on the 1-hour frame, adhering well to it, and is poised to break it strongly upwards and retest it.
We have support from the lower boundary of the ascending channel, at 0.0001664.
We have a downtrend on the RSI indicator that is about to break and retest, supporting the upward trend.
There is a key support area (in green) at 0.0001673, which represents a strong basis for the upward trend.
Don't forget one simple thing: ease and capital.
When you reach the first target, save some money and then change your stop-loss order to an entry order.
For inquiries, please leave a comment.
We have a trend of stability above the Moving Average 100.
Entry price: 0.0001757
First target: 0.0001870
Second target: 0.0001937
Third target: 0.0002017
Don't forget one simple thing: ease and capital.
When you reach the first target, save some money and then change your stop-loss order to an entry order.
For inquiries, please leave a comment.
Thank you.

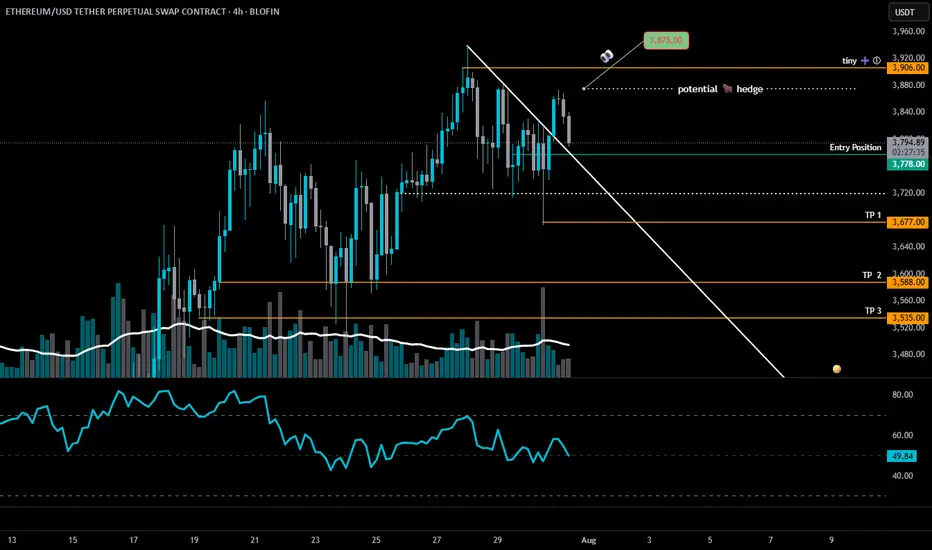
ETH is at a critical inflection pointETH 4H – Decision Time 🧠🐂🐻
Ethereum’s dancing on the edge of a blade.
📍 Entry: $3,778 (Short)
🧪 Next Add: Tiny at $3,906 (updated)
🚨 Major Add: Above $4,100 (TBD)
⚠️TP 1: $3,677 (updated)
We’ve broken the downtrend line — bullish on paper — but ETH is stalling right near resistance at $3,875. If bulls don’t show up with volume and conviction, this move fizzles out fast.
Here’s the playbook:
🔸 $3,875 = key battle zone
— Reclaim it clean (4H close + volume) = "short-term" bear bias invalid (◘reread◘)
— Failure = likely drop to $3,677 → $3,588
🔸 $3,720 = swing short confirmation if broken
🧩 If bulls win $3,875, I keep the short but hedge with a long. Because if the herd’s charging uphill, they might lead us to gra$$.
Momentum is king. No follow-through = fakeout top.
Let the chart breathe.
LOW LEVERAGE POR FAVOR!
Stay Sharp. Stay nimble. 🎯
100% not financial advice, for edutainment purposes only!
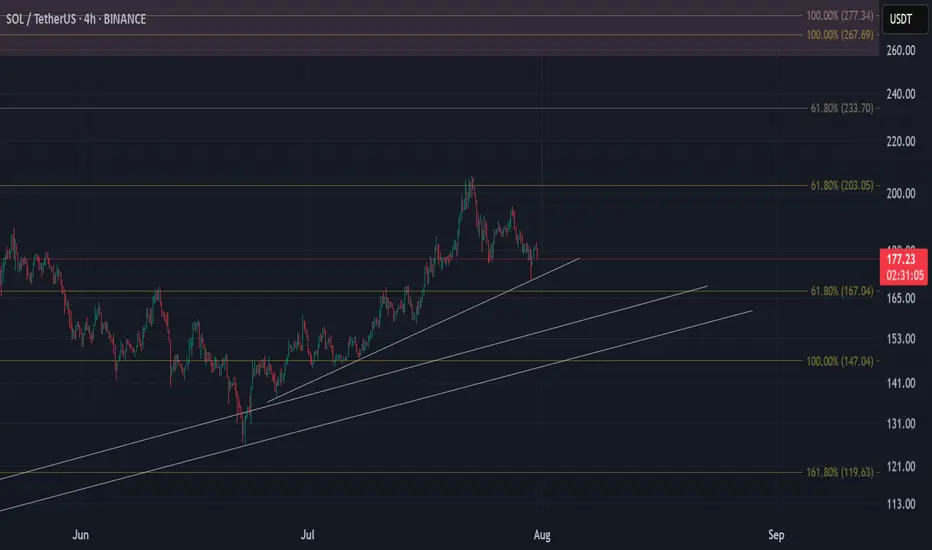
SOLUSDTSix potential targets for SOL. I personally am bullish on SOL, but the price action confirms the final price.
Bitcoin Intraday Analysis 31-Jul-25Quick analysis on bitcoin, the main area of interest i will be monitoring are 110,500, 115k, 120K. Keeping in mind that we still have important economic data tomorrow (US Employment Data).
Disclaimer: easyMarkets Account on TradingView allows you to combine easyMarkets industry leading conditions, regulated trading and tight fixed spreads with TradingView's powerful social network for traders, advanced charting and analytics. Access no slippage on limit orders, tight fixed spreads, negative balance protection, no hidden fees or commission, and seamless integration.
Any opinions, news, research, analyses, prices, other information, or links to third-party sites contained on this website are provided on an "as-is" basis, are intended only to be informative, is not an advice nor a recommendation, nor research, or a record of our trading prices, or an offer of, or solicitation for a transaction in any financial instrument and thus should not be treated as such. The information provided does not involve any specific investment objectives, financial situation and needs of any specific person who may receive it. Please be aware, that past performance is not a reliable indicator of future performance and/or results. Past Performance or Forward-looking scenarios based upon the reasonable beliefs of the third-party provider are not a guarantee of future performance. Actual results may differ materially from those anticipated in forward-looking or past performance statements. easyMarkets makes no representation or warranty and assumes no liability as to the accuracy or completeness of the information provided, nor any loss arising from any investment based on a recommendation, forecast or any information supplied by any third-party.

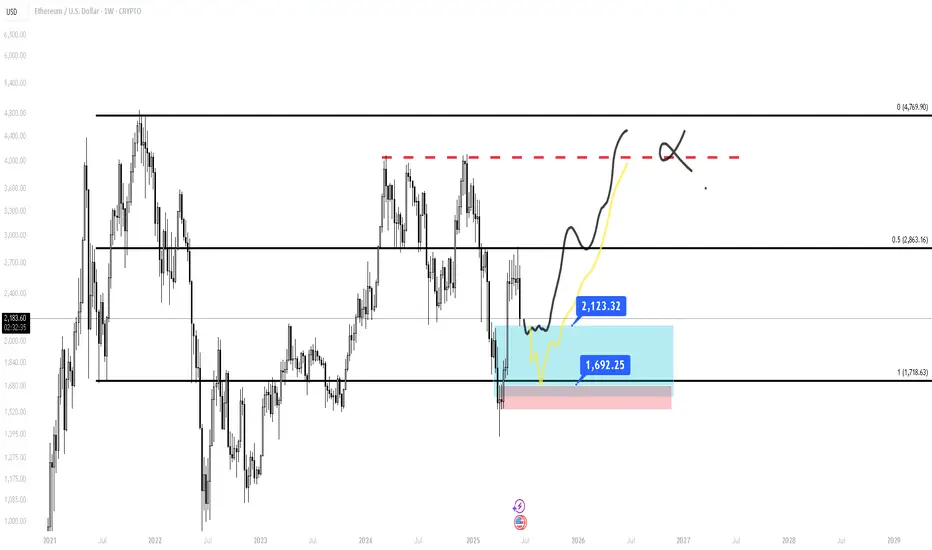
A rocket is fueling on the launch padNever before has Bitcoin so thoroughly built a launch pad. Retail interest is still low after the 2024 top and corporate/governmental interest is through the roof. This is going to be a massive bubble playing out over the next 3-6 months, possibly even over $300k Bitcoin at the end as the narrative shifts from "BITCOIN IS SPECULATIVE" to "BITCOIN IS A MUST HAVE ASSET" and retail will FOMO in as they always do.
The higher it goes, the more brutal the bear market will be. in late 2026-2027 the narrative will be "CRYPTO IS A SCAM". Corporate treasuries that jumped in late will be dumping bitcoin from their balance sheet and all these leveraged longs will fully unwind. Whales will start to accumulate and the 2029 cycle will be epic.
I'll believe cycles are dead when i see evidence of it. I haven't yet. Play this one right boys! Life changing money is coming.

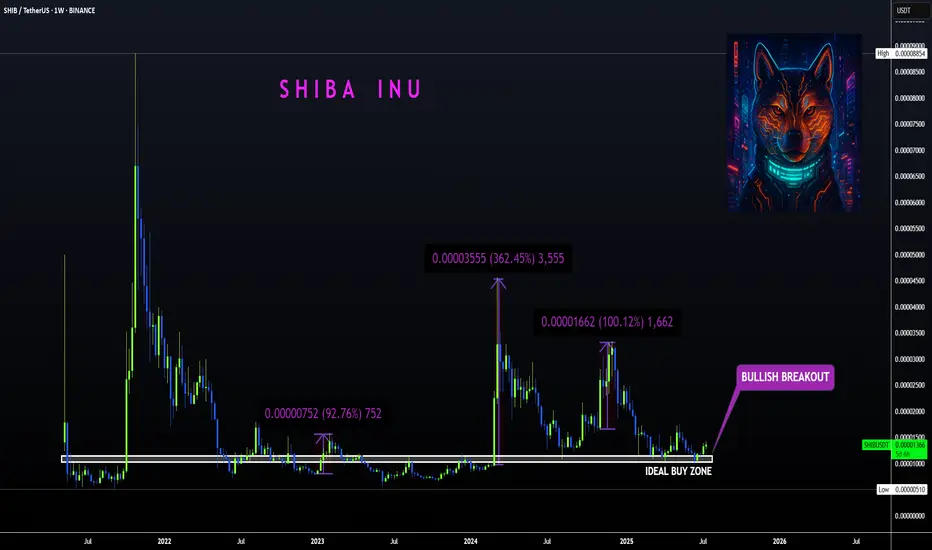
SHIBA | Bullish Breakout ABOVE Ideal Buy ZoneBINANCE:SHIBUSDT
Shiba is know to make big increases in short periods of time... that's why we love it!
The tricky thing about SHIBA is that the pumps can be unpredictable so the best way to ensure a position is to buy as low as possible to the ideal buy zone.
In the weekly timeframe, the technical indicators are not quite bullish yet. The moving averages is still above the price, meaning the bulls have yet to take full control of the price in lower timeframes.
The same can be said for the daily, although we are seeing progress as the 200d moving averages have been reclaimed:
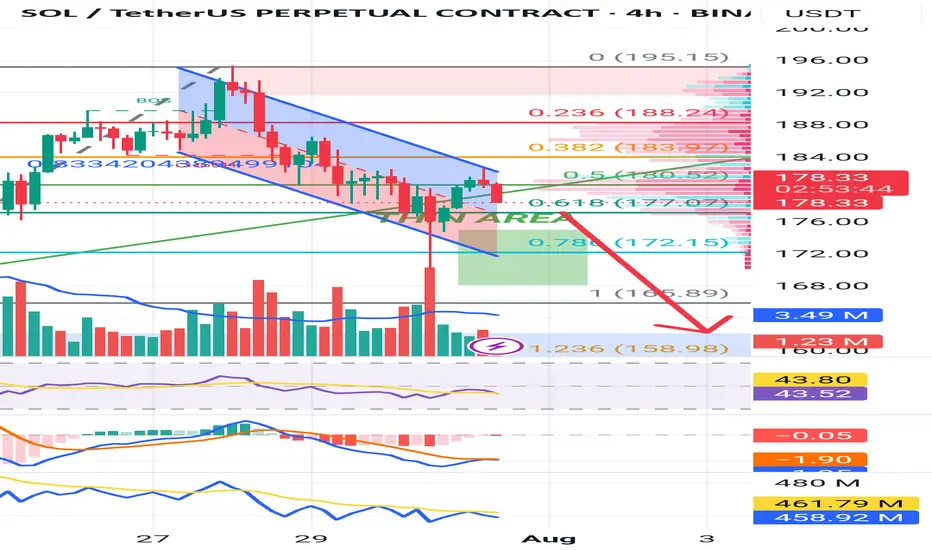
Break down before the run upSo i feel this will go to the 4 hr OB. My reasoning is there's very little buy volume, the OBV is very low even though the price climbed a bit, and the RSI is below 50 still, so still bearish imo. But the market has its own ideas so be wary and watch closely. Make money my friends!
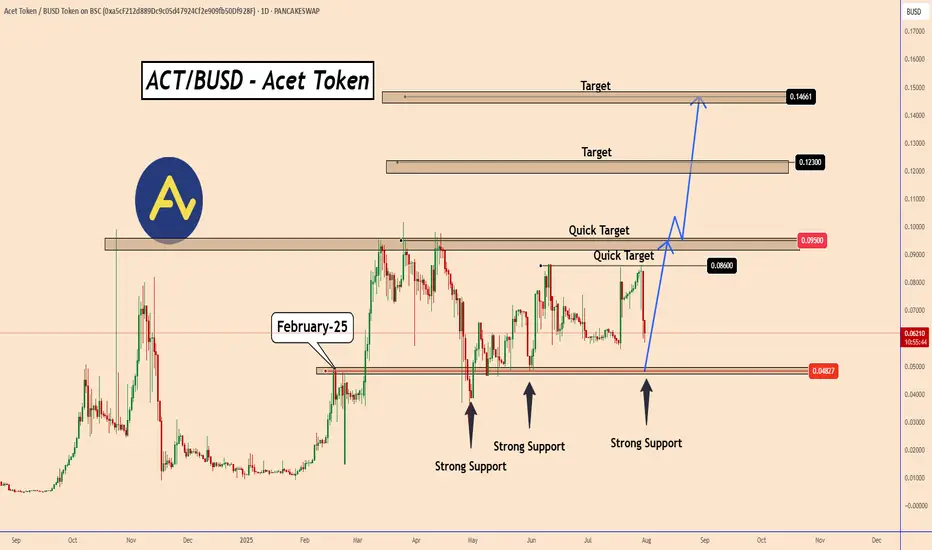
ACT Token: Ready to Break out from Months of AccumulationACT Token: Ready to Break out from Months of Accumulation
Price Outlook – ACT Token Since February 2025, ACT Token has been consolidating within a wide trading range between 0.0480 and 0.0950—a nearly 97% price spread from support to resistance. This prolonged accumulation offers a decent opportunity.
Currently, price action is hovering near the support zone again, hinting at a potential bullish breakout.
Historically, ACT’s impulsive moves have unfolded in aggressive waves, and with months of accumulation behind us, the likelihood of a breakout above 0.09500 has increased.
Key Upside Targets:
Minor resistance levels: 0.08600 and 0.09500
Breakout extension: 0.1230 and 0.14660 if momentum accelerates
We’ll follow the price development step by step, as the structure suggests a greater upside potential is in play.
You may find more details in the chart!
Thank you and Good Luck!
PS: Please support with a like or comment if you find this analysis useful for your trading day
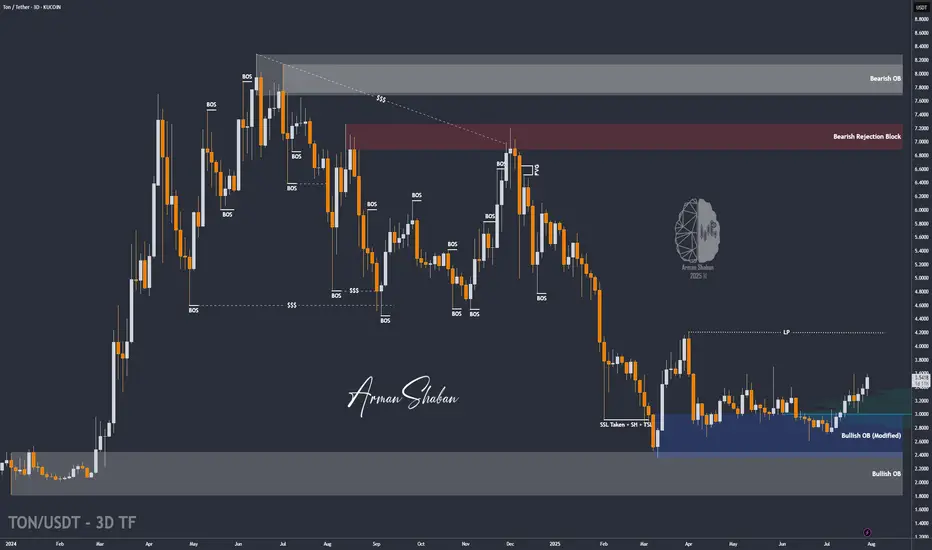
TON/USDT | Surges 18% – Eyes on $3.63, Then $4.20 and $4.68!By analyzing the Toncoin chart on the 3-day timeframe, we can see that after a pullback to the $3 area, strong demand kicked in, and within just one week, the price surged over 18%, reaching above $3.5. Toncoin is currently trading around $3.53, and I expect it to hit the $3.63 target soon. The next bullish targets after that are $4.20 and $4.68.
Please support me with your likes and comments to motivate me to share more analysis with you and share your opinion about the possible trend of this chart with me !
Best Regards , Arman Shaban
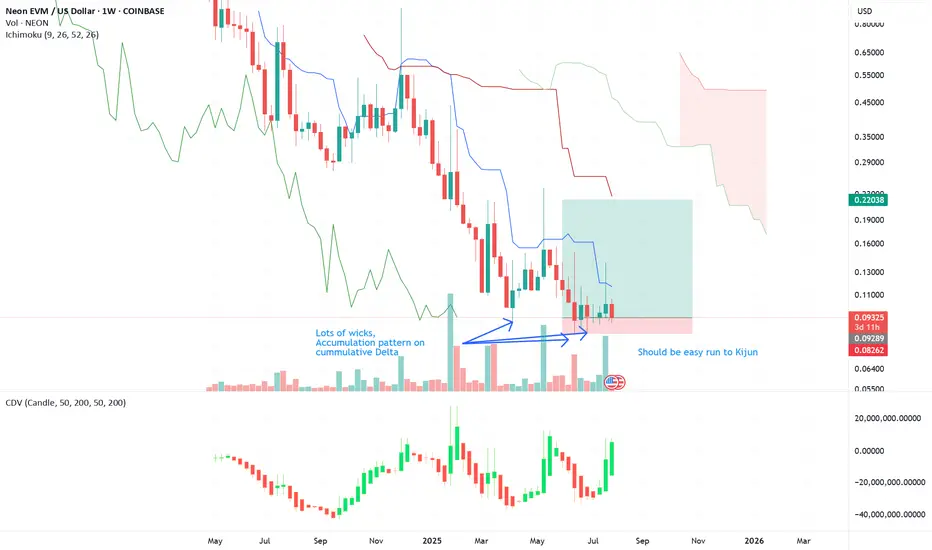
Neon to KijunShould be lining up for a run to Kijun on weekly. Lots of wicks forming and big accumulation pattern on cumulative delta.
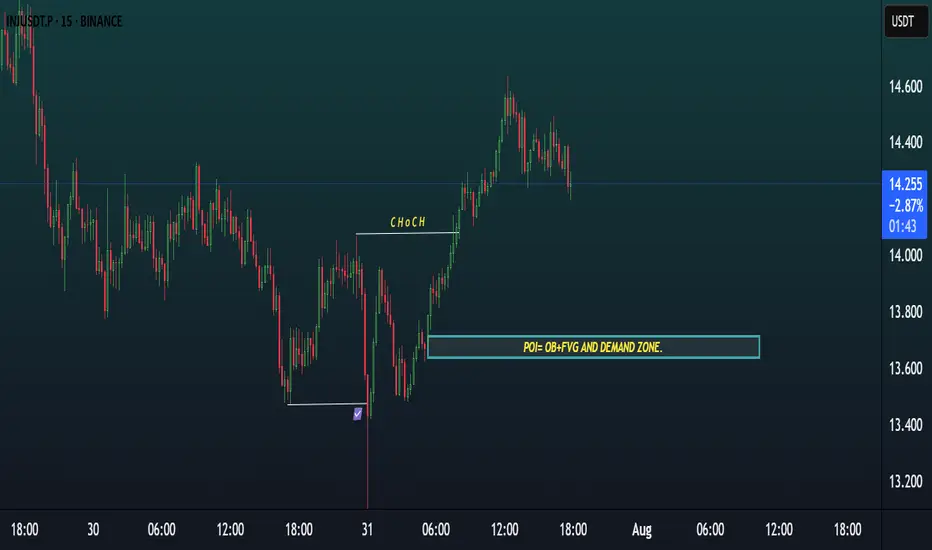
INJ 15m SETUPINJ/USDT 15m Setup 🔥
Market showed a clear Change of Character (ChoCH), confirming bullish momentum.
Now price is retracing toward a strong POI zone, which includes:
✅ Order Block (OB)
✅ Fair Value Gap (FVG)
✅ Demand Zone
📍 Waiting for price to tap this area for a high-probability long entry based on SMC principles.
Watch for bullish confirmation before entering!
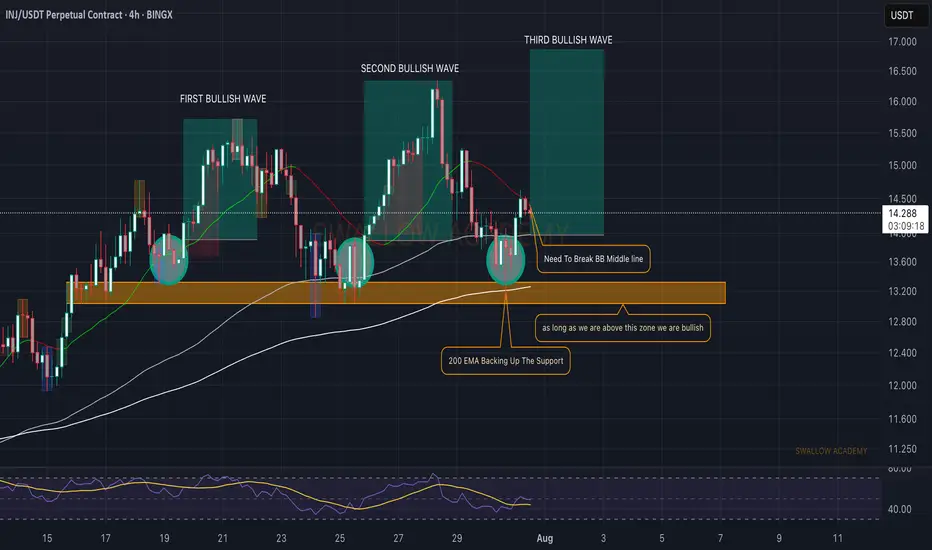
Injective (INJ): Getting Ready To Bounce | BullishINJ seems to be going for another upside movement here after a recent retest of the local support zone, where the price is now trying to break that middle line of Bollinger Bands, which is like a final stage for our upside movement here.
So that's what we are looking for: a break of the middle line of the Bollinger Bands and then a steep movement to upper zones.
Swallow Academy
LINK/USDT 15M SETUP.LINK/USDT 15m Setup 🔥
Price confirmed a bullish shift with a clear ➜ ChoCH.
Now retracing and heading toward a Hidden Demand Zone, with Sell-Side Liquidity (SSL) resting above it.
📍 Expecting price to sweep SSL and tap the zone before a potential bullish reversal.
Perfect SMC setup — wait for reaction and confirmation! 📈

Sui (SUI): Looking For Breakout | Potential Move To $5.40!SUI is still hovering near our local resistance line, where since last time we had one breakout but failed one, which led the price back to EMAs, where we bounced off from.
We still see upside potential here so if we get another breakout attempt, most likely it will be the last one, before going for the $5.40 zone.
Swallow Academy
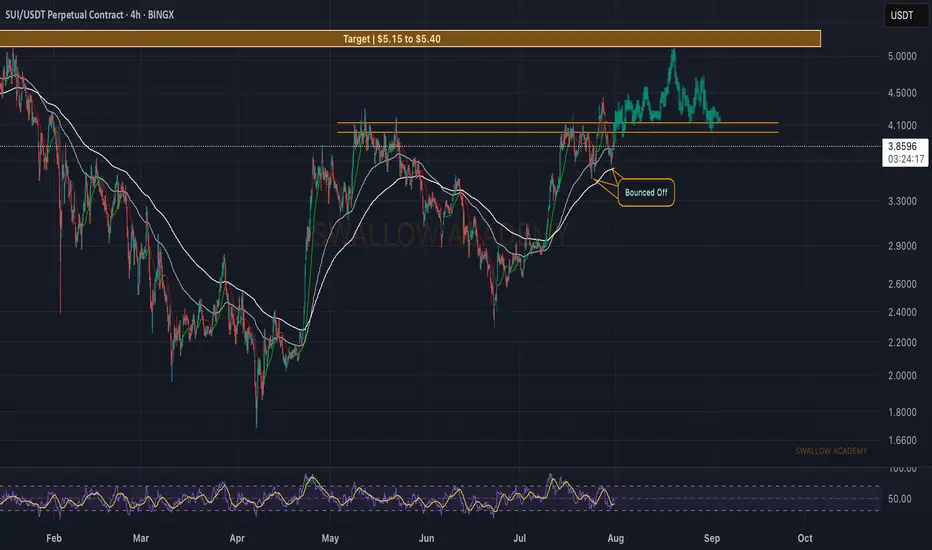
Chart Patterns - How to read them like a ProChart patterns are visual formations on price charts that help traders anticipate potential market movements.
These patterns fall into three main categories: bullish , bearish , and indecisive .
---
1. Bullish Chart Patterns
Bullish patterns often signal that price is likely to move upward.
1.1 Bull Flag
* What it looks like: A sharp upward move followed by a small downward-sloping rectangle (the flag).
* Meaning: After a strong rally, the price consolidates briefly before continuing higher.
* Key insight: A breakout above the flag typically signals a continuation of the trend.
1.2 Pennant (Bullish)
* What it looks like: A strong upward move followed by a small symmetrical triangle.
* Meaning: Similar to the bull flag, but the consolidation takes a triangular form.
* Key insight: Once price breaks above the pennant, the uptrend often resumes.
1.3 Cup & Handle
* What it looks like: A “U”-shaped curve (the cup) followed by a small downward drift (the handle).
* Meaning: This pattern suggests a period of accumulation before price breaks higher.
* Key insight: A breakout above the handle signals the beginning of a new bullish leg.
1.4 Inverse Head & Shoulders
* What it looks like: Three low points, with the middle low being the deepest.
* Meaning: This reversal pattern appears after a downtrend and signals a potential change to an uptrend.
* Key insight: A breakout above the “neckline” confirms the reversal.
---
2. Indecisive Chart Patterns
These patterns show market hesitation, where neither bulls nor bears are clearly in control.
2.1 Consolidation Channel
* What it looks like: Price moves within a horizontal channel.
* Meaning: Market is moving sideways with no strong trend.
* Key insight: A breakout in either direction often leads to a significant move.
2.2 Symmetrical Triangle
* What it looks like: Two converging trend lines forming a triangle.
* Meaning: This is a neutral pattern that can break out in either direction.
* Key insight: Traders wait for a breakout before taking a position.
---
3. Bearish Chart Patterns
Bearish patterns signal a high probability of downward price movement.
3.1 Bear Flag
* What it looks like: A sharp decline followed by a small upward-sloping rectangle.
* Meaning: After a strong drop, price consolidates before continuing lower.
* Key insight: A breakout below the flag suggests a continuation of the downtrend.
3.2 Pennant (Bearish)
* What it looks like: A sharp downward move followed by a small symmetrical triangle.
* Meaning: Similar to the bear flag, but the consolidation takes a triangular form.
* Key insight: A breakout downward typically resumes the bearish trend.
3.3 Inverse Cup & Handle
* What it looks like: An upside-down cup with a small upward drift forming the handle.
* Meaning: Indicates weakness after an uptrend, often followed by a drop.
* Key insight: A break below the handle usually signals a strong bearish move.
3.4 Head & Shoulders
* What it looks like: Three peaks, with the middle one being the highest.
* Meaning: A classic reversal pattern that indicates a potential shift from an uptrend to a downtrend.
* Key insight: A break below the “neckline” confirms the bearish reversal.
---
How to Use These Patterns
* Combine pattern recognition with support/resistance, volume, and indicators for stronger confirmation.
* Always wait for breakouts and avoid acting too early.
* Manage risk with stop-loss orders.

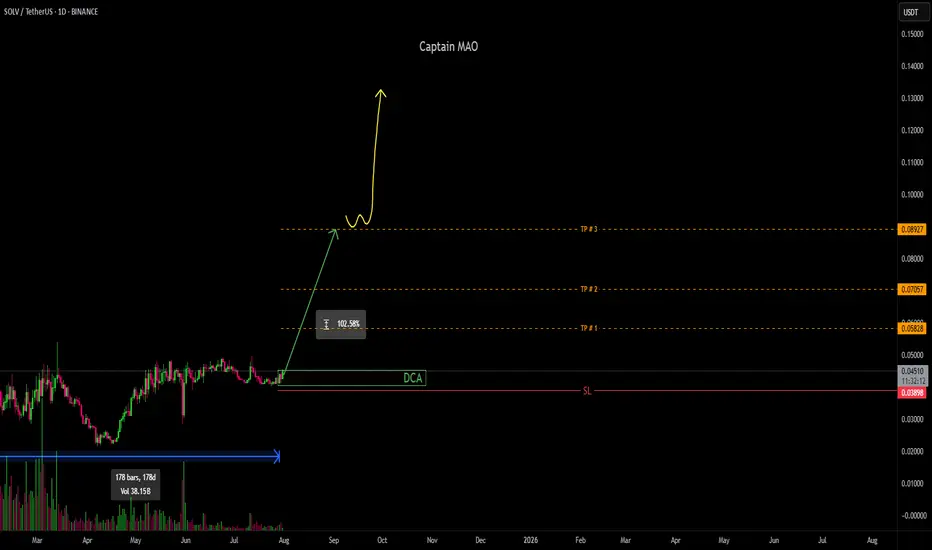
SOLV/USDT +100%has been consolidating in a tight accumulation range for an extended period (~6 months), consistently defending the $0.04 support zone. Price action suggests a potential base-building phase, with buyers repeatedly absorbing dips below $0.04 and establishing a clear floor.
A breakout scenario is developing as SOLV attempts to challenge the key resistance at $0.05 ,Above this level will see big push toward $0.09 zone
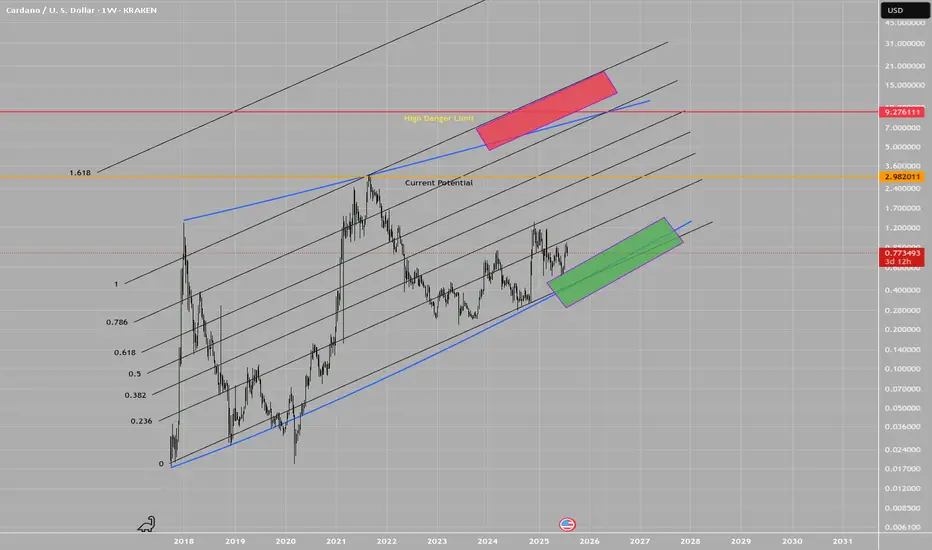
ADA, long term dubious speculationWARNING: This idea is highly dubious!
This is a logarithmic estimate of potential targets, in case Cardano moves in long logarithmic measures.
The real potential of this idea is strongly linked to the fundamentals evolution on time, i.e.: FED reducing the interest rate, for instance, but not only.
The plot features top and bottom limits drown by hand!, these are not perfect logarithmic measures, thus they certainly lacks of math accuracy. Beware.
There are zones in red and green, as transparent boxes, which depicts potential zones of buy and sell interest, of course, everything is in a log scale.
Everyone wish these kind of scenarios to be true. Only time and reality will show us the true face of it. In any case, in the total chaos of uncertainty that this market is, we try to make a sense of it.
Best of the lucks for everyone.
T.
DISCLAIMER: Do your own research! This idea is not a financial advice. All the information presented is highly speculative and cannot be taken as a reference in any circumstance.
Roadmap for $TOTAL aligned with the $444K $BTC price forecastThis idea outlines a projected roadmap for CRYPTOCAP:TOTAL (Total Crypto Market Cap) based on my $444,000 Bitcoin price forecast. As BTC climbs toward this long-term target, CRYPTOCAP:TOTAL is expected to follow a corresponding macro growth trajectory. This roadmap explores potential milestones, correction zones, and acceleration phases within the crypto market as capital flows increase.
🔍 This analysis is a continuation of my $444K BTC thesis, which you can find on my profile for context.
📈 Key highlights:
• Correlation between BTC and CRYPTOCAP:TOTAL historical growth patterns
• Projected market cap targets in alignment with BTC reaching $444K
• Technical and macroeconomic confluence zones
• Strategic outlook for altcoins as CRYPTOCAP:TOTAL expands
🧠👇💬 Any thoughts?


