#DYM/USDT Dymension's Falling Wedge#DYM
The price is moving within an ascending channel on the 1-hour frame, adhering well to it, and is on track to break it strongly upwards and retest it.
We have support from the lower boundary of the ascending channel, at 0.2550.
We have a downtrend on the RSI indicator that is about to break and retest, supporting the upside.
There is a major support area in green at 0.2583, which represents a strong basis for the upside.
Don't forget a simple thing: ease and capital.
When you reach the first target, save some money and then change your stop-loss order to an entry order.
For inquiries, please leave a comment.
We have a trend to hold above the 100 Moving Average.
Entry price: 0.2730.
First target: 0.2771.
Second target: 0.2832.
Third target: 0.2909.
Don't forget a simple thing: ease and capital.
When you reach your first target, save some money and then change your stop-loss order to an entry order.
For inquiries, please leave a comment.
Thank you.
Crypto market
Btcusd techinical analysis.Btcusd techinical analysis next move posibale at h1 time frame not finchinal.

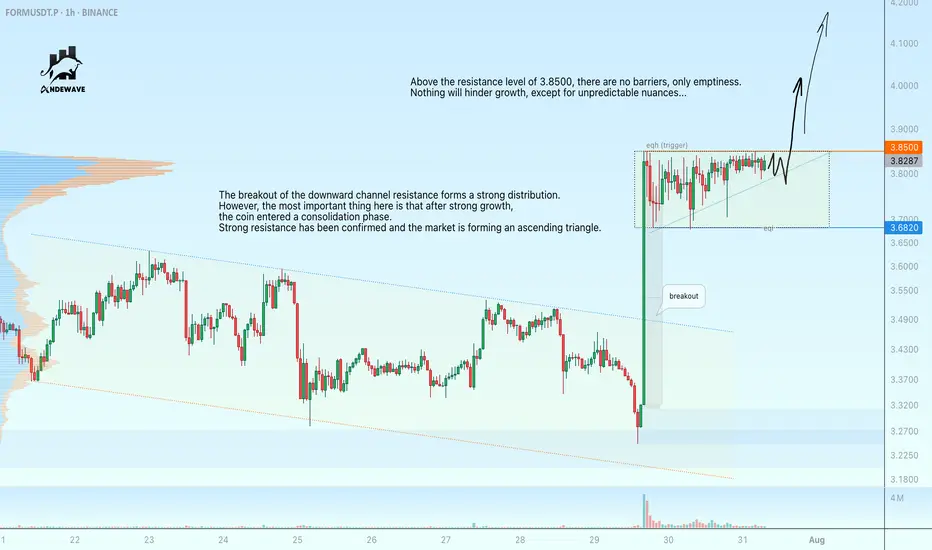
FORMUSDT is preparing for a rally. Breakthrough at 3.8500The breakout of the downward channel resistance forms a strong distribution. However, the most important thing here is that after strong growth, the coin entered a consolidation phase. Strong resistance has been confirmed and the market is forming an ascending triangle.
The coin's behavior is strong, as the entire cryptocurrency market has been red for the past two days and testing lows, while FORM has been consolidating for growth.
The breakout of the 3.85 resistance level could be rapid due to the accumulation of liquidity above the level.
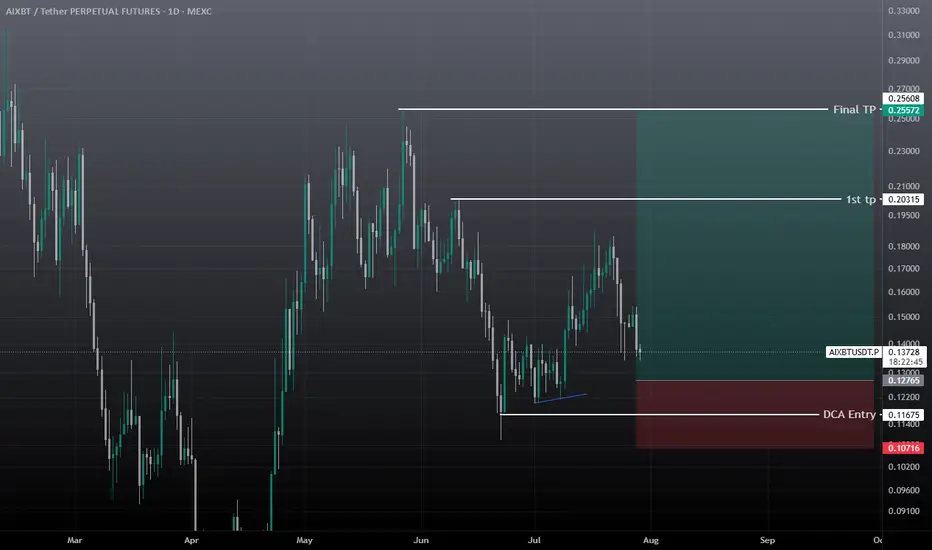
AIXBT Swing Trade Buy / Long SetupMarket is taking some good correction, Also It has cleared almost all liquidity below side, Now It can move towards upside. Must wait for the entry. It's a swing trade so it can take time on entry and tp. Best Of Luck.
SUI Swing Buy / Long SetupSui is on Strong and decision Order block on 1 day Timeframe, If we break this then SUI will take correction till recent weekly low. If we hold this then new ath. Book some or 80% on mentioned area, rest hold till 6$.

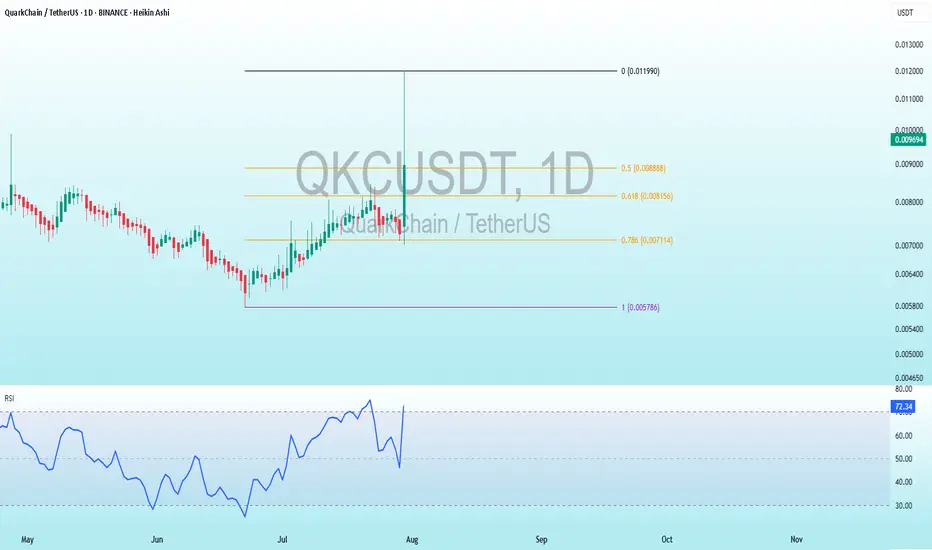
QKC Bearish DivergenceBINANCE:QKCUSDT
Trade Setup:
Target 1: 0.008888 (0.5 Fibonnaci Golden Zone).
Target 2: 0.008156 (0.618 Fibonnaci Golden Zone).
Target 3: 0.007114 (0.786 Fibonnaci Golden Zone).
Target 4: 0.005786 (1 Fibonnaci).
Stop Loss: 0.011990 (0 Fibonnaci).
RSI Analysis: The RSI is showing a bullish divergence, suggesting potential bullish momentum. The current RSI is around 72.29, approaching overbuy territory, so caution is advised.
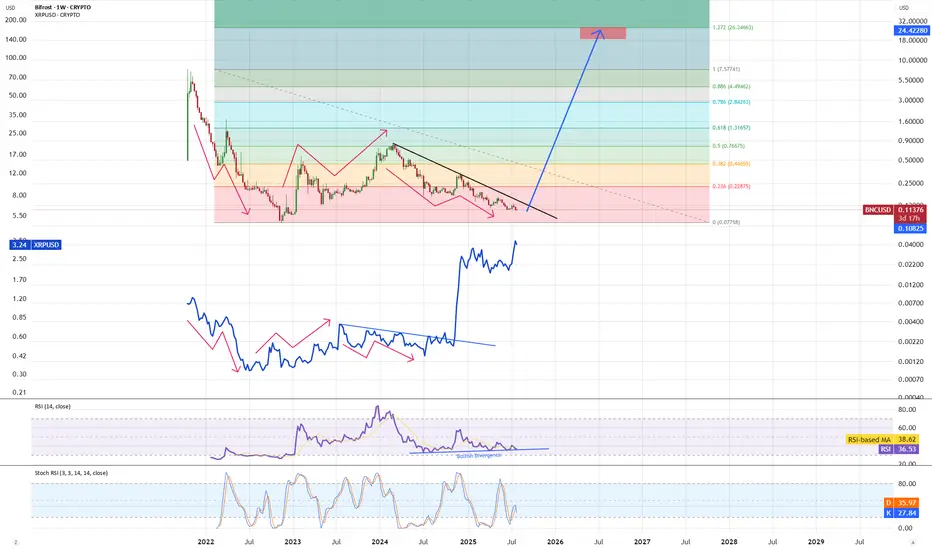
BNC - setup ready for reversalBNC is oversold, has bullish divergence and pattern similar to XRP prior a reversal. Once we bounce and break local diagonal resistance line expect a strong push up to ATH range, with likely wick to fibb 1.272 extension. Rule as always - DCA secure profits on the way up, once you see confirmed bearish signals (divergence, overbought) be sure to be out and observe correction + crypto market for further steps...
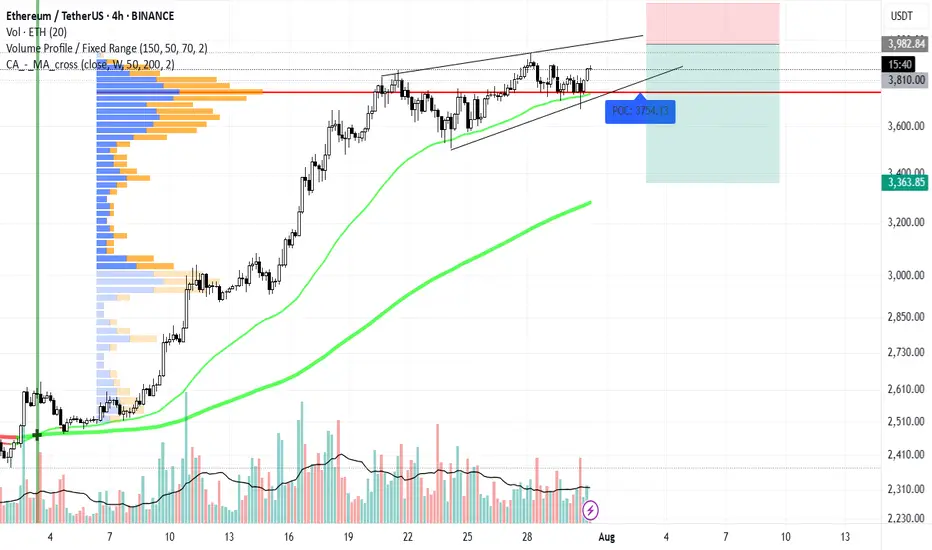
ETH ready for a Pullback.... As we can see, BINANCE:ETHUSD is forming a wedge pattern and may drop to $3,300. We're in a bullish trend, so shorting ETH could be risky—please be cautious !
Potential Long Scalp Trade for BTCBitcoinUSD is testing support at $116,400. Depending on this 1HR close, we could have a long trade scalp opportunity for it to reach PoC @ $118,000 to test resistance there. Stop loss would be set below wick @ $115,700. Open Interest for shorts and longs has gone up at this candle. If support holds, shorts will be underwater and liquidation will push prices up.

BNB LONG TRADE SETUPNew Trade Setup: BNB-USDT
LONG
Entry: 803.50 OR CMP
Target: TP1: 816.54, TP2: 829.57, TP3: 842.61, TP4: 855.64
Stoploss: 773.84
Leverage: 1X
Technical Analysis: BNB/USDT is currently facing strong support. There is a high probability of a short-term upward move.

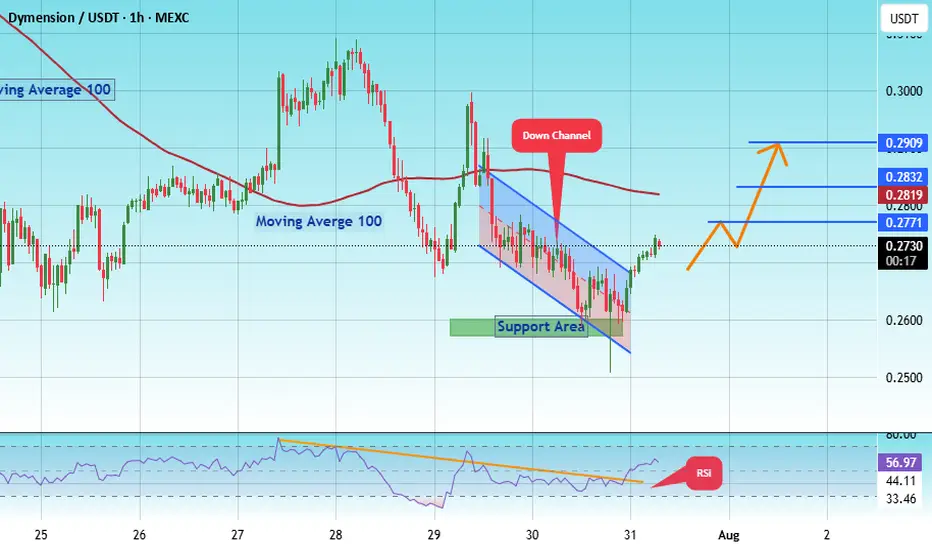
#DYM/USDT#DYM
The price is moving within a descending channel on the 1-hour frame, adhering well to it, and is on its way to breaking strongly upwards and retesting it.
We have support from the lower boundary of the descending channel at 0.2795.
We have a downtrend on the RSI indicator that is about to be broken and retested, supporting the upside.
There is a major support area in green at 0.2746, which represents a strong basis for the upside.
Don't forget a simple thing: ease and capital.
When you reach the first target, save some money and then change your stop-loss order to an entry order.
For inquiries, please leave a comment.
We have a trend to hold above the 100 Moving Average.
Entry price: 0.2860.
First target: 0.2923.
Second target: 0.2976.
Third target: 0.3060.
Don't forget a simple thing: ease and capital.
When you reach your first target, save some money and then change your stop-loss order to an entry order.
For inquiries, please leave a comment.
Thank you.

#DOGS/USDT – Launchpad or Breakdown?#DOGS
The price is moving within an ascending channel on the 1-hour frame, adhering well to it, and is poised to break it strongly upwards and retest it.
We have support from the lower boundary of the ascending channel, at 0.0001300.
We have a downtrend on the RSI indicator that is about to break and retest, supporting the upward trend.
There is a key support area (in green) at 0.0001330, which represents a strong basis for the upward trend.
Don't forget one simple thing: ease and capital.
When you reach the first target, save some money and then change your stop-loss order to an entry order.
For inquiries, please leave a comment.
We have a trend of stability above the moving average of 100.
Entry price: 0.0001424
First target: 0.0001456
Second target: 0.0001515
Third target: 0.0001570
Don't forget one simple thing: ease and capital.
When you reach the first target, save some money and then change your stop-loss order to an entry order.
For inquiries, please leave a comment.
Thank you.
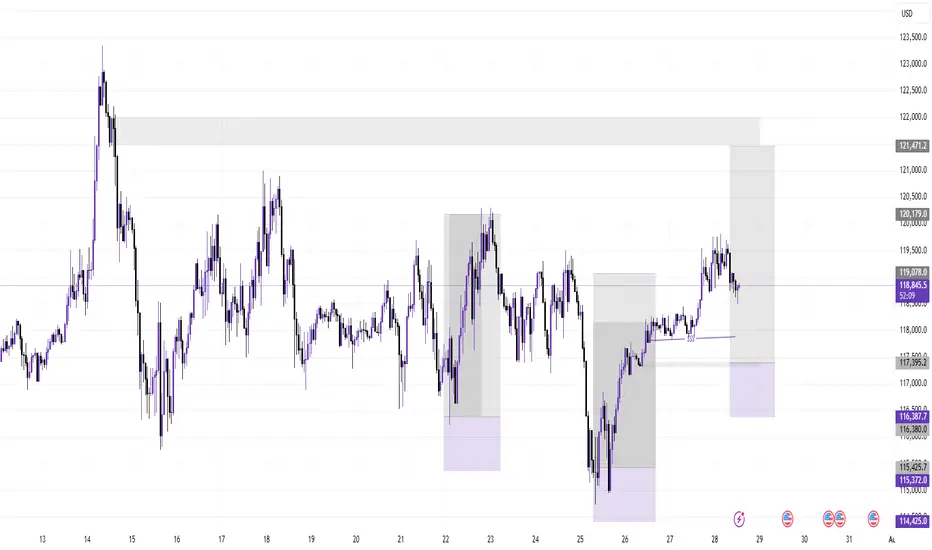
Has Bitcoin become a "SAFE" asset ? These charts show that......
After we heard the US Federal Reserve hold rates yesterday, Markets Fell some.
And Bitcoin joined them for a couple of hours but Look now.
While the $ falls, the S&P Falls, GOLD is the traditional haven of safety and we can see how it Rose in Value over the last 12 hours
The $ has Fallen over the last 8 hours
S&P Stalled for the last 24 hours
And the STRONGEST positive moves over the last 12 hours were from BITCOIN rising, though it is taking a breather for the moment.
SO, has it become a SAFE HAVEN ?
Put it like this. Bitcoin has NOT lost value like it used to when under pressure.
We have yet to see what would happen once it reaches its cycle Top. Will it retreat as it has historicaly...
But for now, it does seem to be a strong store of Value and remains with potential and likelihood of further rises.
The TOTAL CRYPTO MARKET CAP chart below
This shows us that the investor market seems Very confident in the Crypto Market,,Just going from strength to strength.
The TOTAL 2 Market Cap chart shows us something very interesting.
The TOTAL2 chart is the Total Market Cap MINUS BITCOIN
Compare the 2 charts and you will see how the TOTAL chart has risen way over its previous cycle ATH but the TOTAL2 is currently being rejected off its previous ATH line.
This clearly shows us that BITCOIN is the strength in the Crypto Market.
It is the same story on the TOTAL3 chart ( TOTAL minus BTC & ETH )
It is the same on the OTHERS chart ( Top 125 coins minus top 10 by market Cap )
BITCOIN CARRIES THE MARKET
These are early days but the Future of Bitcoin does seem VERY good
So far this cycle, the largest retrace was -31%
This drop was NOT a sharp Drop over a short period of time. It was an expected and controlled drop over 112 days.
But the zoomed out version of that chart tells us something VERY GOOD
PA has risen above and Tested and held that line of resistance that had rejected PA at Cycle Top ATH in 2017 and 2021.
That is a HUGE move and we wait to see if we Hold and move higher away from this line.
SO, Is Bitcoin a Safe Haven ?
It is certainly looking more and more like it.
PA is secure, has held position well and is in Price discovery...slowly and with caution...but always moving forward.
The traditional 4 yeat Cycle would end in late Q4 this year and so we have to wait and see what happens then.
But Bitcoin PA has moved into New ground on so many fronts now.
The traditinal BEAR market may not appear, in which case, YES, Bitcoin could become a New SAFE HAVEN
Buy Bitcoin
Hold Bitcoin

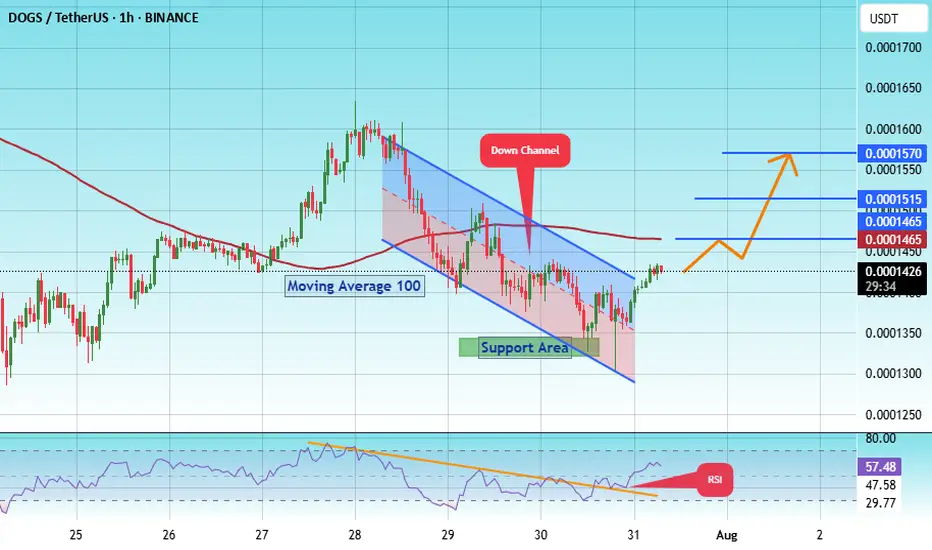
#DOGS/USDT#DOGS
The price is moving within a descending channel on the 1-hour frame, adhering well to it, and is poised to break it strongly upwards and retest it.
We have support from the lower boundary of the descending channel, at 0.0001432.
We have a downtrend on the RSI indicator that is about to break and retest, supporting the upward trend.
There is a key support area in green at 0.0001402, which represents a strong basis for the upward trend.
Don't forget one simple thing: ease and capital.
When you reach the first target, save some money and then change your stop-loss order to an entry order.
For inquiries, please leave a comment.
We have a trend of stability above the Moving Average 100.
Entry price: 0.0001460
First target: 0.0001538
Second target: 0.0001500
Third target: 0.0001581
Don't forget one simple thing: ease and capital.
When you reach the first target, save some money and then change your stop-loss order to an entry order.
For inquiries, please leave a comment.
Thank you.

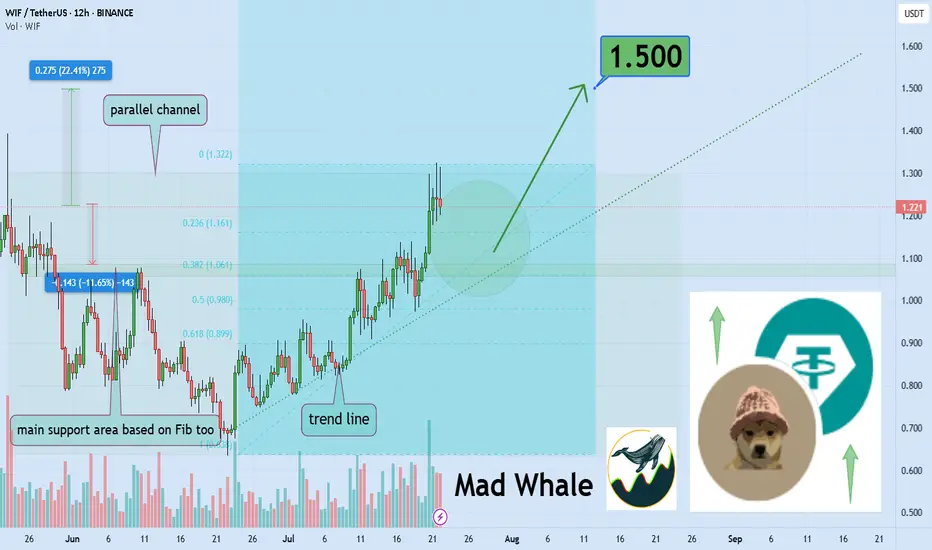
Dogwifhat Poised For 22% Growth Toward $1.50Hello✌
Let’s analyze Dogwifhat’s upcoming price potential 📈.
📈 BINANCE:WIFUSDT is currently sitting near a strong daily support and trendline. At the same time, the Fibonacci Level support lines up closely with this key level. This convergence suggests a potential upside of about 22%, aiming for a target price of $1.50. 🔥
✨We put love into every post!
Your support inspires us 💛 Drop a comment we’d love to hear from you! Thanks , Mad Whale
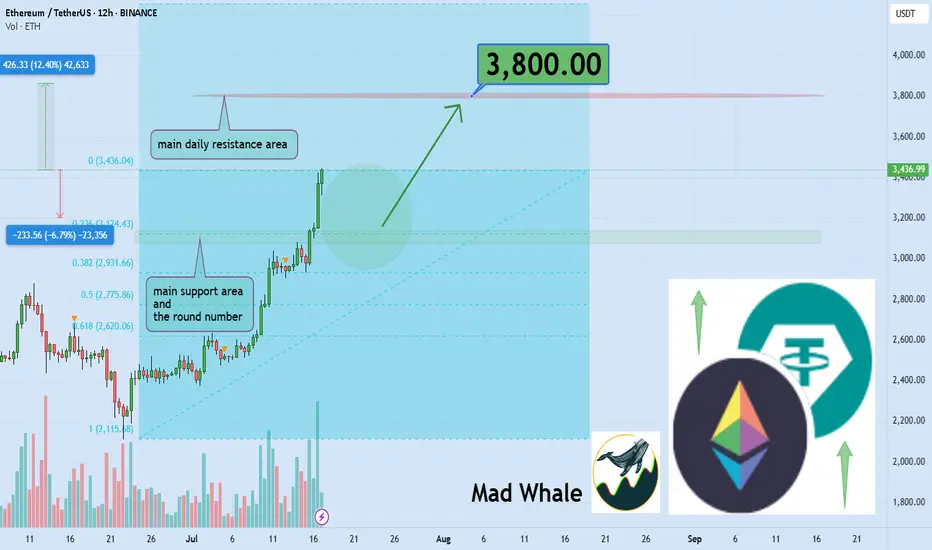
Crypto Exploded, I Missed it, What should I Buy Now?!The market suddenly exploded… green candles after green candles. Yesterday, you were hesitating to look at the chart, today everyone on social media is posting their profits. So what now? Did you miss out? It’s not too late. The main question now is: What should I buy to catch up?
If you read this analysis till the end, not only will you learn some practical TradingView tools, but you’ll also gain insight into how to act like a professional trader after big pumps not like a reactive follower.
Hello✌
Spend 3 minutes ⏰ reading this educational material.
🎯 Analytical Insight on Ethereum:
BINANCE:ETHUSDT is currently holding near the daily support and the key psychological level at $3,000, which also matches the 0.23 Fibonacci retracement. A potential upside of at least 12% is expected, targeting $3,800 close to a major daily resistance zone. Keep an eye on these levels for possible trade setups 📊⚡.
Now , let's dive into the educational section,
🧠 FOMO: The Enemy That Devours Your Profits
If you feel like you missed the boat now, don’t panic. Everyone has felt that, even top traders. It’s called "FOMO." Jumping into the market without analysis and just on emotions can burn you badly. Instead of regretting, sit calmly, analyze, and wait for the right setup. The market always offers new chances you just need to know how to hunt them.
🔍 What to Buy Now? Logic Over Emotion
There are three types of coins still offering opportunity:
Coins that haven’t broken their previous highs yet
Like a compressed spring, they can jump higher with a small push.
Altcoins lagging behind Bitcoin
When BTC pumps, alts usually follow afterward.
Coins with strong upcoming fundamental news
Networks with upcoming updates or special events that generate excitement.
Don’t forget on-chain analysis. See where money is flowing.
🌟 Look for New Stars and Strong, Established Coins
After a pump, there are two ways to hunt:
🔹 New Stars
Altcoins that are just coming out of their correction phase and haven’t had their main pump yet.
🔸 Strong and Established Coins
Assets that have shown resilience, have strong fundamentals, and tend to pump again after corrections.
Balance your portfolio with both to lower risk and maximize profit potential.
🧰 TradingView Tools to Hunt Opportunities After a Pump
To avoid missing out in the second phase of the market explosion, you must use TradingView’s analytical tools correctly. Here are three key tools you should know right now:
Volume Profile
Helps you understand where most trading volume occurred. Smart money usually buys and sells heavily at these points.
RSI (Relative Strength Index)
Tells you when the market is overbought. When it drops back to the 40 to 50 range after a peak, that could be a good re-entry point.
Fibonacci Retracement
A tool to find attractive correction zones after a pump. Especially useful if you combine multiple timeframes.
⚖️ Stop Loss Is Necessary, But Take Profit Is More Important
Always place a stop loss in the market. But many forget to set a take profit in bullish markets.
Having a take profit level ensures you lock in gains when the market hits your target and avoid greed.
Key point: Even if you expect huge pumps, take some profit on time to avoid losing it all during corrections.
🪙 The Next Pump Is Just Around the Corner
Instead of jumping into a pump mid-way, focus on spotting setups just forming. Watch for consolidation candles, rising volume, and reactions to classic zones. That’s where you can enter professionally, even before everyone knows what’s coming.
🛠 Game Plan for the Trader Who Fell Behind
Pick three coins that haven’t pumped yet
Test the tools mentioned on them
Set alerts for logical entry signals
Enter with risk management, not emotion
Most importantly analyze, don’t just follow
📌 Summary and Final Advice
If you missed the market pump, don’t worry; crypto markets always offer opportunities you just need to be prepared. A combination of analysis, professional tools, and smart choices between new and established assets can help you not only catch the next pump but ride it ahead of everyone else.
✨ Need a little love!
We pour love into every post your support keeps us inspired! 💛 Don’t be shy, we’d love to hear from you on comments. Big thanks , Mad Whale 🐋
📜Please make sure to do your own research before investing, and review the disclaimer provided at the end of each post.
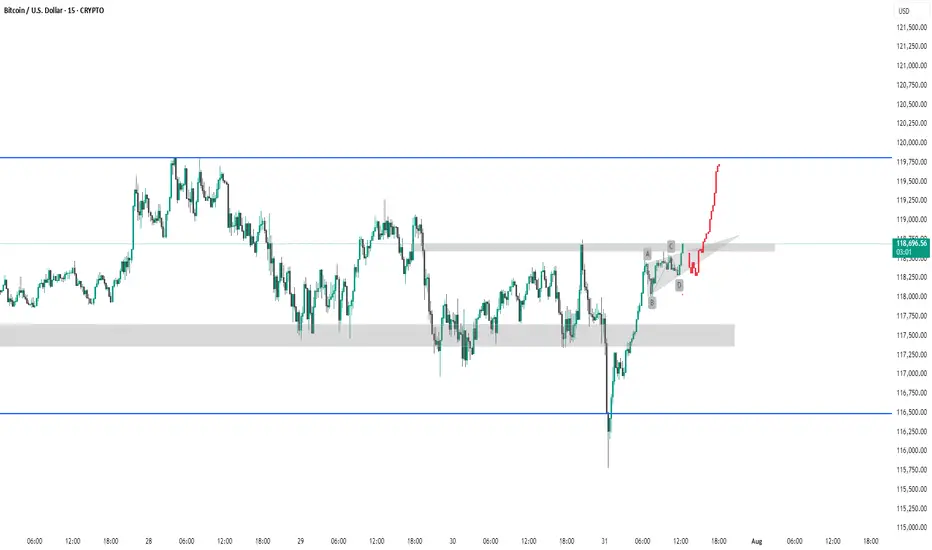
BTC #This is a 15-minute Bitcoin (BTC/USD) chart showingThis is a 15-minute Bitcoin (BTC/USD) chart showing a potential bullish breakout scenario. Price has broken above a key resistance zone (gray shaded area) and is forming a possible bullish continuation pattern (ABCD structure). The red projection indicates a bullish price target towards the 119,750–120,000 USD resistance area (blue line). Confirmation of breakout and sustained momentum above the gray zone would validate the bullish outlook.
thanking you
Lingrid | DOGEUSDT Pullback and Continuation OpportunityBINANCE:DOGEUSDT is currently testing the intersection of its upward channel support and a critical horizontal zone near 0.21378, after a steep corrective decline from the 0.28628 resistance area. The recent price action formed a rounded pullback, suggesting potential accumulation near trendline confluence. A bullish bounce here could trigger a strong rally toward 0.26350 as shown by the projected upward path. Failure to hold the 0.21000 area would expose the pair to deeper downside toward the 0.15706 support.
📌 Key Levels
Buy zone: 0.21000–0.21700
Buy trigger: Break and close above 0.23000
Target: 0.26350
Invalidation: Break below 0.21000
⚠️ Risks
Breakdown of ascending trendline support
Weak volume on upward breakout
Broader market weakness impacting altcoins
If this idea resonates with you or you have your own opinion, traders, hit the comments. I’m excited to read your thoughts!

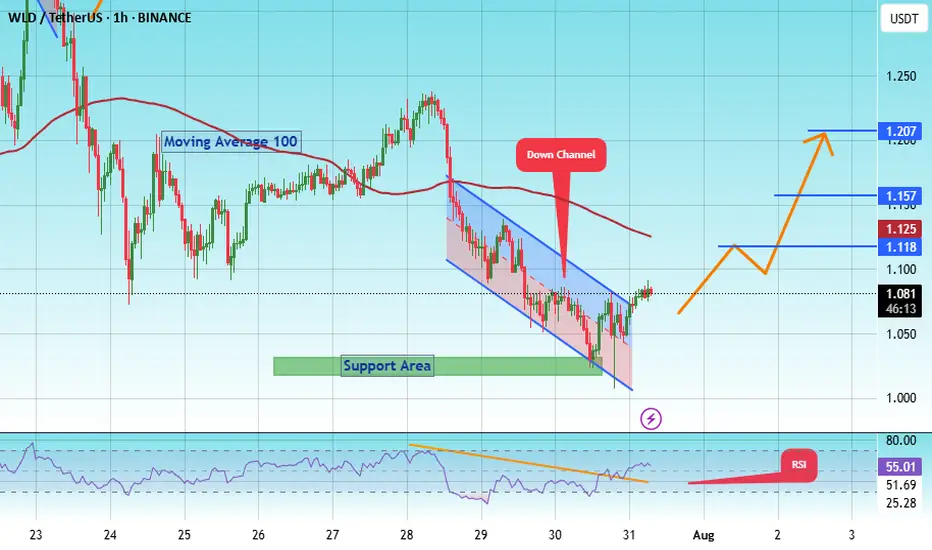
#WLD/USDT Approaching Breakout After Long-Term Downtrend !#WLD
The price is moving within an ascending channel on the 1-hour frame, adhering well to it, and is on its way to breaking strongly upwards and retesting it.
We have support from the lower boundary of the ascending channel, at 1.00.
We have a downtrend on the RSI indicator that is about to break and retest, supporting the upside.
There is a major support area in green at 1.02, which represents a strong basis for the upside.
Don't forget a simple thing: ease and capital.
When you reach the first target, save some money and then change your stop-loss order to an entry order.
For inquiries, please leave a comment.
We have a trend to hold above the 100 Moving Average.
Entry price: 1.08.
First target: 1.12.
Second target: 1.157.
Third target: 1.20.
Don't forget a simple thing: ease and capital.
When you reach your first target, save some money and then change your stop-loss order to an entry order.
For inquiries, please leave a comment.
Thank you.
SolusdtHi snipers. On the one-day timeframe, the price is fluctuating in an ascending channel. It has now reached the middle line of the channel and the 103-day moving average support line is below it, which will help the price to move up again and reach the channel ceiling. If this support is broken, the price is likely to fall to the channel floor. This analysis is just a possibility. It is not a trading recommendation.


Waiting Patiently for this bias on BTCUSDWaiting for BTC to come clear the liquidity as shown in my chart setup, then I'm entering for a BUY following the overall trend.
#BTCUSD Short term buying LevelsBINANCE:BTCUSD Short term looks bullish and heading towards 132000$, Any panic is a buy at equal legs
