LtcLtc lproject looks promising
Solid owners who define the true value of crypto
I don’t see any reason this turns bearish anytime soon
Crypto market

BTC this other snicky guyit is amazing as the meassures remains the same
The buy it is not ready the buy is in 113.500
either from 121000 or from 122000 it will fall, Im in the internalk buy right now and also will be selling from 121.000 and 122.000 too
GG

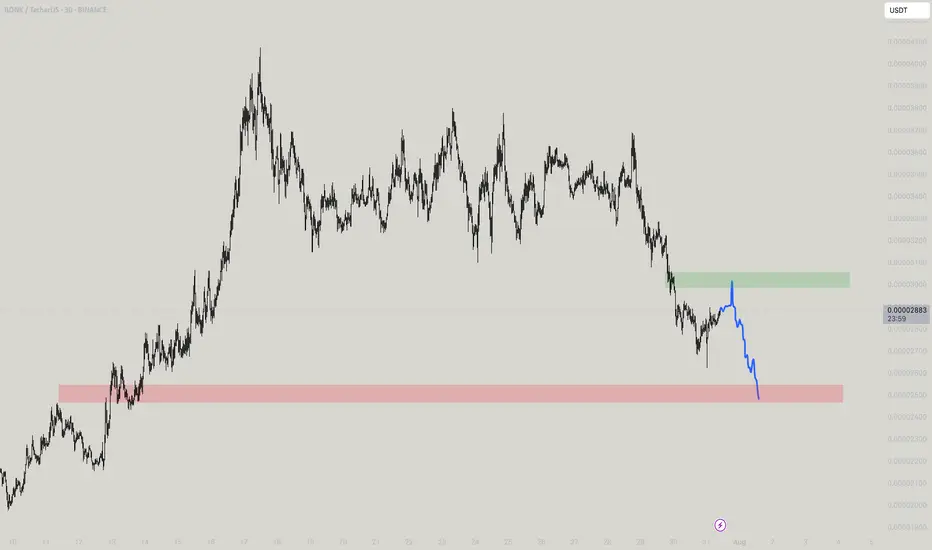
Boink - I Bonk You!I bonk you!!!! Don't you think buying here aint good? But selling here might be? Or just dont get too bulish with bonk
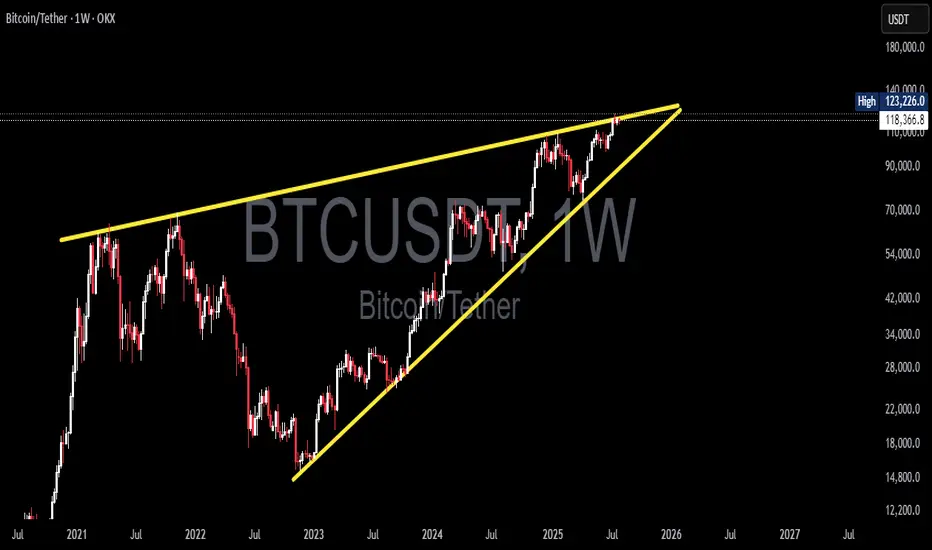
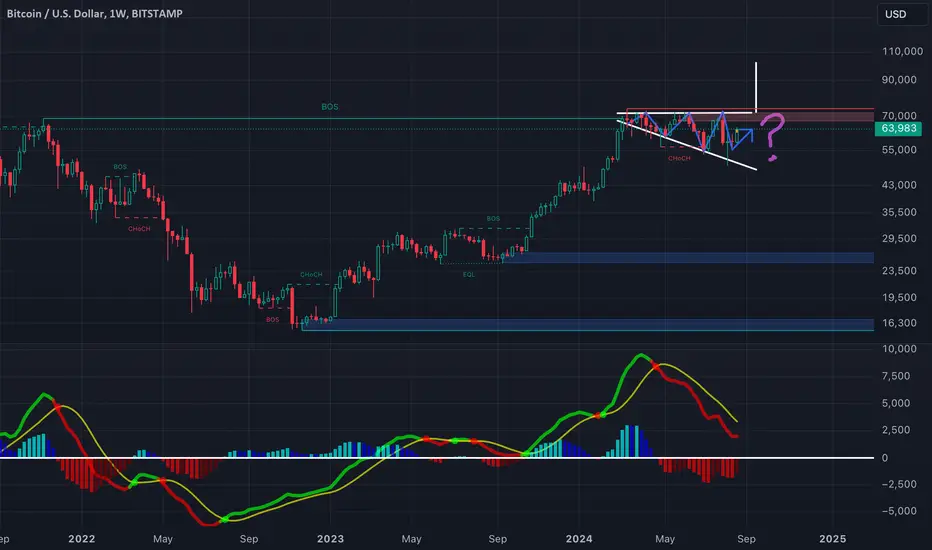
Bitcoin at a Decisive Moment! Rising Wedge Formed — Breakout?🧠 In-Depth Technical Analysis (BTCUSDT – Weekly Timeframe)
Bitcoin is currently trading within a large Rising Wedge pattern, formed over the long term from late 2022 to mid-2025. This structure is typically a bearish reversal formation, although it can also lead to a breakout in strong bull markets.
The wedge is defined by:
Consistently higher lows on the lower trendline
A gradually rising upper resistance line that currently caps price around $123K–$125K
Decreasing volume, indicating consolidation and energy buildup near the apex
This wedge reflects a period of euphoric price action post-2022 bear market accumulation, with price now testing the top of a historically significant resistance zone.
---
📊 Key Price Levels:
🔹 Current Price: ≈ $118,436
🔹 Recent Weekly High: $123,226
🔹 Critical Resistance (Wedge Top): $123,000–$125,000
🔹 Dynamic Support: Rising wedge base (~$90,000–$95,000)
---
🐂 Bullish Scenario: “Historic Breakout Incoming”
If BTC successfully breaks above the wedge’s upper resistance and closes a weekly candle above $125K with strong volume, it would signal a confirmed breakout from the long-term wedge structure.
📈 Upside Targets:
🎯 Target 1: $140,000
🎯 Target 2: $155,000+ (based on Fibonacci extension and macro targets)
🚀 A breakout of this magnitude may trigger a new parabolic rally, especially if accompanied by:
Increased institutional adoption
Spot ETF inflows
Favorable macroeconomic shifts (e.g., rate cuts)
---
🐻 Bearish Scenario: “False Breakout or Breakdown Risk”
If Bitcoin fails to break out and faces strong rejection from the resistance zone (possibly a false breakout), the rising wedge formation may break down — leading to a steep correction.
📉 A breakdown from this structure often leads to sharp drops due to:
Overextension of the current trend
Distribution phase by smart money
🎯 Downside Targets:
Support 1: $95,000–$90,000
Support 2: $76,000
Major Support: $54,000 (historical demand & EMA zones)
---
🔍 Optional Indicators for Chart Confirmation:
Weekly RSI: Watch for bearish divergence
Volume Profile: Can highlight distribution or accumulation zones
EMA 21/50: Ideal for identifying dynamic support levels in retracements
---
📌 Conclusion:
Bitcoin is at a crucial inflection point within this multi-year Rising Wedge. A confirmed breakout could lead to new all-time highs, while a breakdown may trigger a broad correction. Traders should prepare for high volatility, wait for clear confirmation signals, and manage risk wisely in this pivotal zone.
#Bitcoin #BTCUSDT #RisingWedge #BTCBreakout #TechnicalAnalysis #CryptoMarket #PriceAction #BearishReversal #CryptoSignal #ChartPattern #BitcoinAnalysis #Cryptocurrency
Will BTC ever reach 130k?Yes in your dreams, I am joking, it can but not now, blue shows what fall can trigger when massive selloff happens, and here it looks the smaller momentum to happen soon!

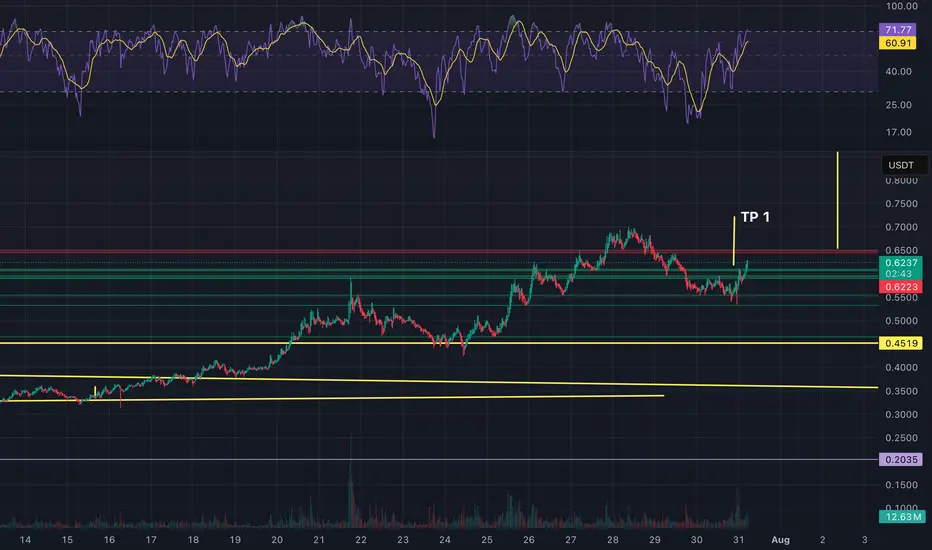
ETHUSDT - SCalp your day!Small scalps, extreme targets on yellow mid targets on the green, Keep in mind that a temp spike can happen for a fall, to a great extent, maybe?

BTC Testing Resistance Within Lower Timeframe Channel
⚠️ CRYPTOCAP:BTC is setting up a key short-term play, with structure tightening on the intraday charts.
📉 4H: Trading inside a clean descending channel, with sellers still capping moves
⏱️ 1H: Price is nudging against trendline resistance — an active breakout attempt is underway
If this breakout confirms, we could see short-term bullish momentum take over 🔼
But a rejection here may push BTC back toward the channel’s lower boundary 🔽
👀 This setup is packed with potential — quick reactions are likely either way.
Are you expecting a breakout or another fade from resistance?
Not financial advice.

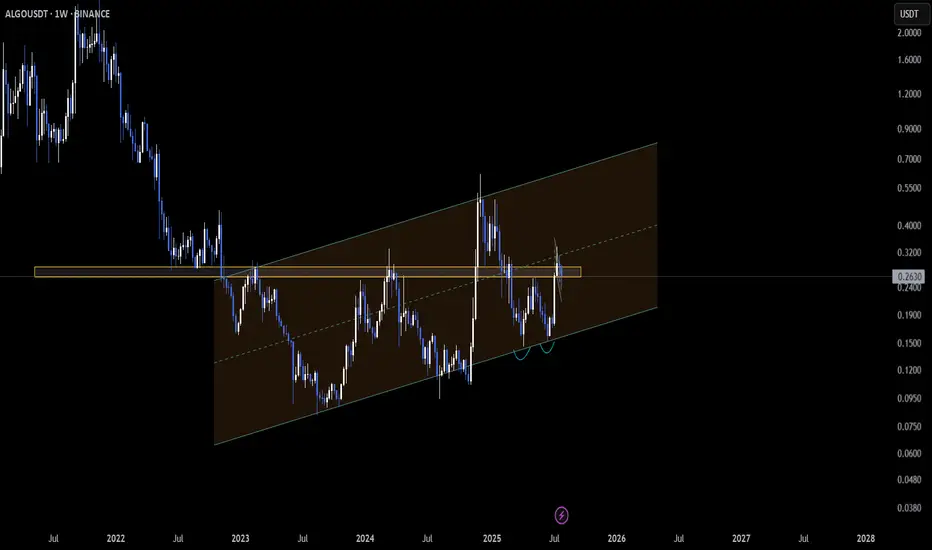
ALGO Multi-Timeframe Squeeze Near Critical Support🚨 EURONEXT:ALGO is compressing across the charts, and it's reaching a major inflection point.
📉 2H: Navigating inside a descending channel, with lower highs pressing down
📆 Daily: Price is hovering at a historically strong support zone
📅 Weekly: Still holding within a broader ascending channel
Buyers are defending key ground, but pressure is mounting. A bounce here could spark a quick reversal 🔼 — failure to hold might accelerate downside momentum 🔽
These multi-timeframe squeezes don’t stay quiet for long.
👀 Which way are you leaning — bounce incoming or support breakdown?
Not financial advice.
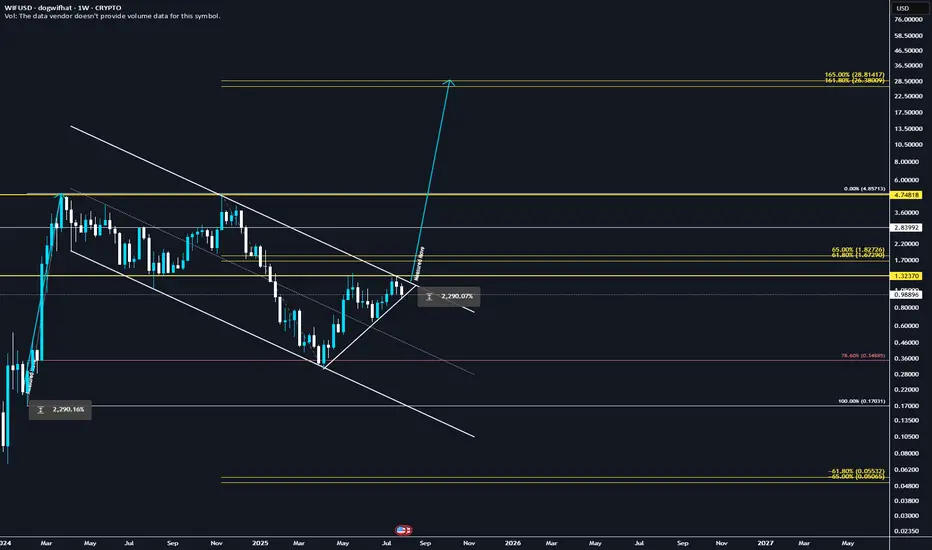
They're lying! WIF will explode to 28.8$ ✅ Golden Pocket Extension: $28.80 aligns with the 1.618–1.65 fib extension (golden pocket zone) from the last major impulse.
✅ Measured Move: Breakout from the prior downward consolidation projects to ~$28.80 when using the height of the range added to the breakout point.
✅ Confluence = High Probability: Both fib extension and measured move target the same zone, increasing confidence.
✅ Momentum + Meme Rotation: If broader meme coin rotation continues, WIF has narrative + volatility fuel.
Title: GODSUSDT.P | Fibonacci Breakdown After Pump – Bearish RetGODSUSDT.P experienced a sharp upward pump followed by a strong rejection near the 0.1960 level (0.00% Fib). After failing to sustain the high, the price retraced and is currently consolidating near the 50% Fibonacci level (0.1528) on the 15m chart.
🔻 Bearish Bias Confirmed:
• MACD Histogram shows increasing bearish momentum.
• Price is struggling to reclaim 0.1563 resistance zone.
• If 0.1528 breaks, look for continuation to Fib targets:
• 61.8% (0.1427)
• 78.6% (0.1282)
• Final support near 100% - 110% zone (0.109 – 0.1015).
📊 Trade Plan:
Short entries below 0.1528 with SL above 0.1563. Targeting key Fib zones for profit booking.
⚠️ Not financial advice. Always do your own research and manage your risk accordingly.

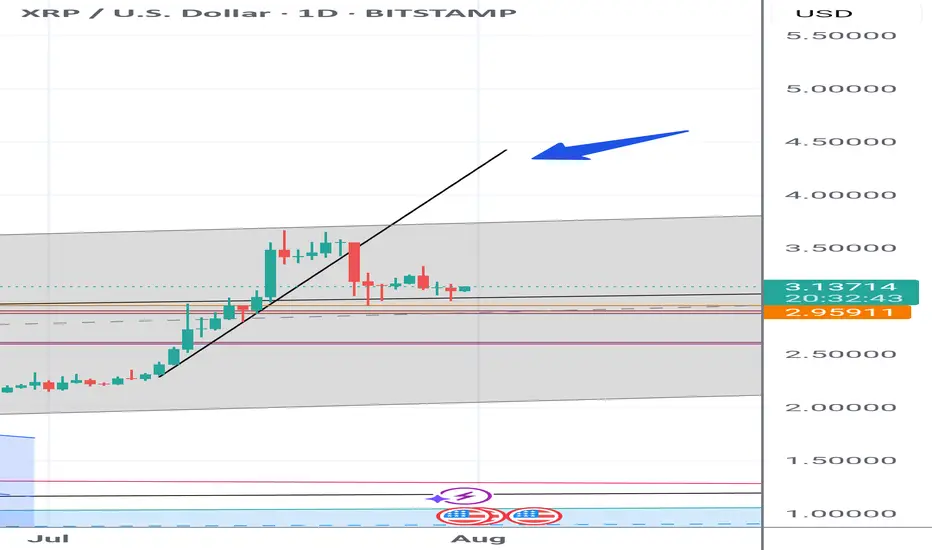
XRP UpdateJust simple analysis, base on breakout line. Hope it will retrace to the blue arrow.
Anyways, do you own analysis and research as well.
☺️
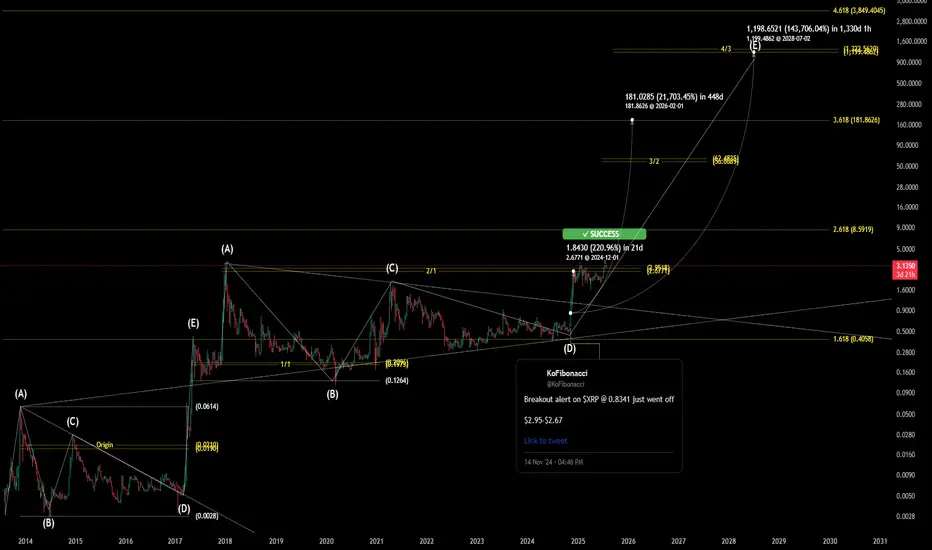
$XRP Historical Golden Ratio - Weekly Timeframe The Historical Golden Ratio (HGR) is the Fibonacci-based market analysis methodology that I created in 2020 (but really discovered). It identifies critical price inflection points by applying Fibonacci in a very unique and fundamental way. It may appear complex from the outside to new and even experienced technical analysis, but under the hood is a very simple and logically built engine that only has two critical parts really. However, it reveals an underlying structure within markets that appears to be fractal-based and dictated by the Golden Ratio. For the experienced market participant, time behind the wheel will reveal that the driving force behind markets has been in plain sight all along; M = φ * H(t) * e^(k * I(t))
Long GODS - Target 17 Cents - 1:3 RRRTrading Fam,
As I continue to gain experience with my AI-created indicator, I am learning to remain patient and wait for the perfect setups. We have one here on GODS. You can see that we've returned to the bottom of a larger triangle and are using it as support. Additionally, we are within a favorable liquidity block where buyers tend to accelerate the volume. My indicator gave the BUY signal 2 weeks ago, and there has been plenty of sideways accumulation since the signal flashed. Probability suggest that GODS will pump soon.
I'll be targeting 17 cents with a SL at 10 for a 1:3 RRR.
Let's go!
Stew

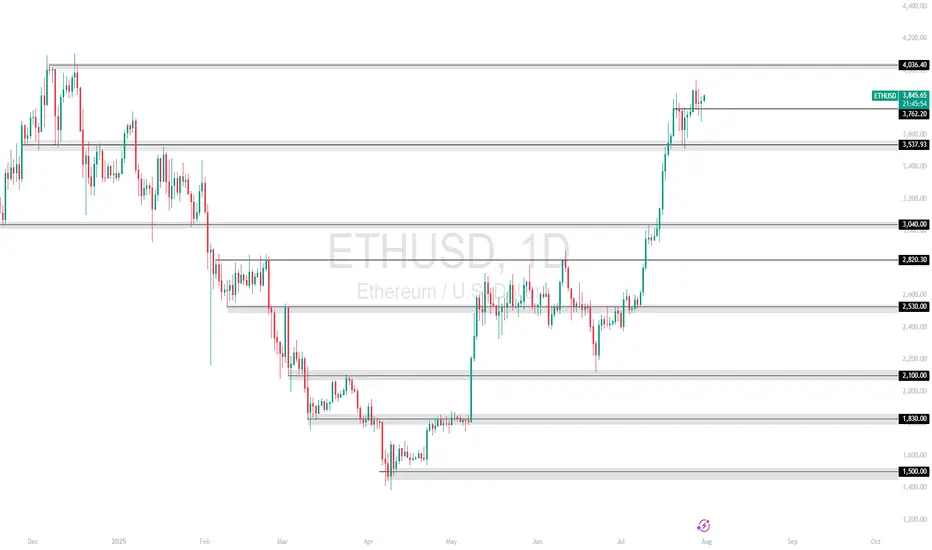
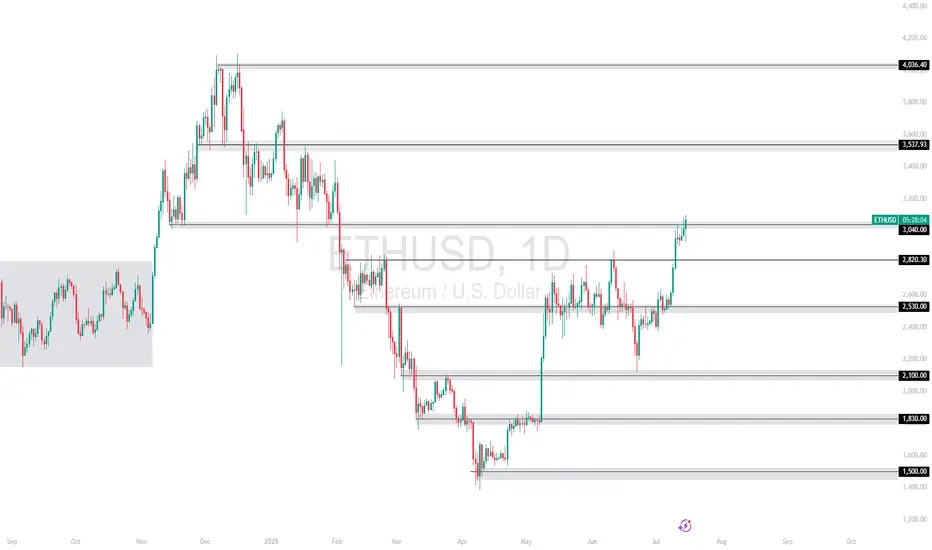
ETHUSD Key Zone Retest – Bullish Momentum Above 3,760?Price surged past the 3,537.93 and 3,762.20 zones, holding gains above both. The current daily candle shows consolidation just above the 3,760 zone after a strong impulsive move.
Support at: 3,762.20 🔽 & 3,537.93
Resistance at: 4,056.40 🔼
🔎 Bias:
🔼 Bullish: If price continues to hold above 3,762.20 and closes strongly above this zone, we may see continuation toward 4,056.40.
🔽 Bearish: A daily close back below 3,760 could open room for a deeper correction toward 3,537.93 or even 3,040.00.
📛 Disclaimer: This is not financial advice. Trade at your own risk.
ETHUSD | Breakout Watch Above $3,040Ethereum has surged above the critical $2,530 resistance zone and is now challenging $3,040, a key structure level. A daily close above this could open the path toward $3,537 and even $4,056 in the mid-term.
Support at: 2,530 / 2,100 / 1,830 🔽
Resistance at: 3,537.93 / 4,056.40 🔼
🔎 Bias:
🔼 Bullish: Holding above 2,530 confirms breakout structure; a clean break above 3,040 targets higher zones.
🔽 Bearish: Failure to stay above 3,040 may invite a retest of 2,530.
📛 Disclaimer: This is not financial advice. Trade at your own risk.
STELLAR LUMENS - DOLLAR COST AVERAGE FOR LONG TERM GAINSSTELLAR LUMENS (XLM) has taken off late 2024 from under .10 cents and now trading at .40 cents for a 400% Gain in 6 months so far, and there is much more upside to come potentially. It hit all time highs around .50 cents and now the token seems to want to test those highs in the near term 2025, we can easily see XLM approach $1.00 towards 2026 for a 100% gain and even higher longer term. Overall, XLM moves with XRP and we all know XRP is a blue chip project, it has all the funds and institutional backing, and so does XLM.
Both projects share a common creator in Jed McCaleb, however they have different focuses. Ripple, and its native token XRP, was initially designed to facilitate cross-border payments for financial institutions. Stellar, on the other hand, focuses on financial inclusion and aims to provide accessible financial services for individuals, including remittances and access to banking services.
CAN WE SAY BULLISH?! TO THE MOON!!!

A look at a CPR strategy using monthly CPRA look at a CPR strategy using monthly CPR - Using conditions to enter and move SL

#PENGUUSDT confirms a bearish impulse📉 SHORT BYBIT:PENGUUSDT.P from $0.034625
⚡ Stop loss $0.035646
🕒 Timeframe: 4H
⚡ Overview:
➡️ A Double Top pattern BYBIT:PENGUUSDT.P has formed, signaling a bearish reversal.
➡️ The price broke the $0.0355 support and is consolidating below, confirming seller strength.
➡️ Increasing sell volume confirms bearish control.
➡️ Main focus on targets in the $0.034–0.033 zone.
➡️ The POC at $0.03113 remains the ultimate bearish objective.
🎯 TP Targets:
💎 TP 1: $0.033947
💎 TP 2: $0.033369
💎 TP 3: $0.032948
BYBIT:PENGUUSDT.P Trade Recommendations:
📢 Hold short towards the TP zones.
📢 Watch for reaction around $0.0339 — partial profit-taking possible.
📢 Invalidation if price reclaims above $0.0356.
⚠️ As long as bearish pressure holds, the price is likely to continue towards TP2–TP3.
⚠️ A recovery above $0.0356 would invalidate this setup.
🚀 The signal confirms a bearish impulse — expecting further downside!

BTC/USD – 4H Short Setup AnalysisBitcoin is currently trading within a defined range under macro resistance. The chart shows price stalling below a key supply zone, with rejection from the upper Keltner Channel and diagonal resistance (yellow trendline). A local bearish divergence appears to be playing out as momentum fades.
📉 Short Position Setup:
Entry: $119,275 (supply retest)
Stop Loss: Above local high / top channel boundary
Targets:
TP1: $117,163 (38.2% Fib)
TP2: $115,858 (61.8% Fib)
TP3: $113,746 (full measured move)
Confluence:
Bearish rejection near multi-touch trendline resistance
Lower high formation after extended consolidation
Heikin Ashi candles showing loss of bullish momentum
Watch for: Breakdown of the white trendline support to confirm momentum shift. Invalidation if BTC closes strongly above $120,000.
Timeframe: 4H | Strategy: Range Reversal + Fib Confluence

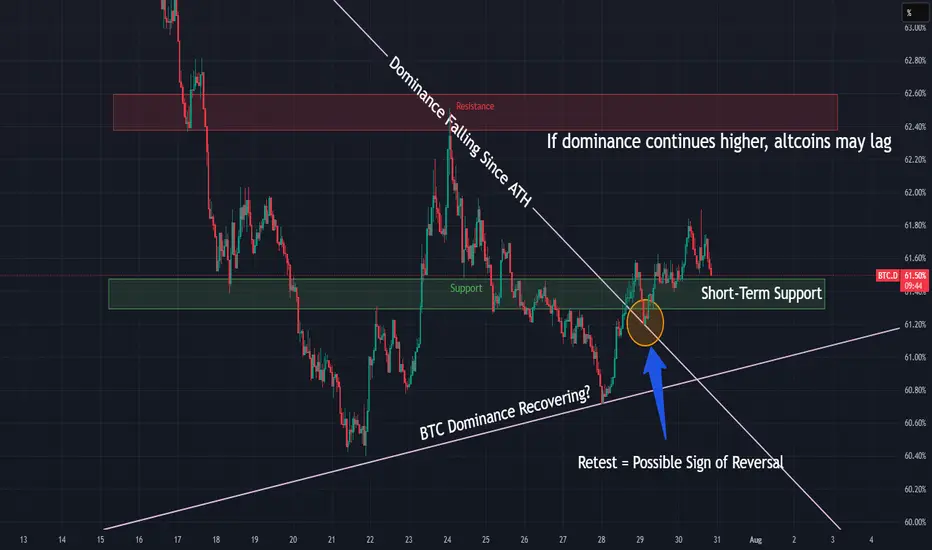
BTC Dominance Breaking Out — Rotation Incoming?BTC Dominance just broke a major downtrend and is holding above the breakout level — a possible shift in market control.
📌 If dominance continues higher, altcoins may lag
📌 Resistance zone at 62.5% could cap the move
⏱️ Timeframe: 1H
#btcd #bitcoin #altseason #dominance #marketcycle #quanttradingpro #tradingview
$BTCUSD, rally into rate cuts?BITSTAMP:BTCUSD has been coiling for some time now in a right angled descending broadening wedge.
A measured move of this cone so far would place BTC at right around ~$100k.
This aligns well with historical performance of BTC heading into a cutting cycle. If we rally into September and have a selloff following the cuts (sell the news), I wouldn't be shocked. This is a pattern that has happened in multiple years of the previous QE/QT Cycle (2016/2017, 2019/2020).
The real fireworks will be in 2025 if things go according to the FED's schedule
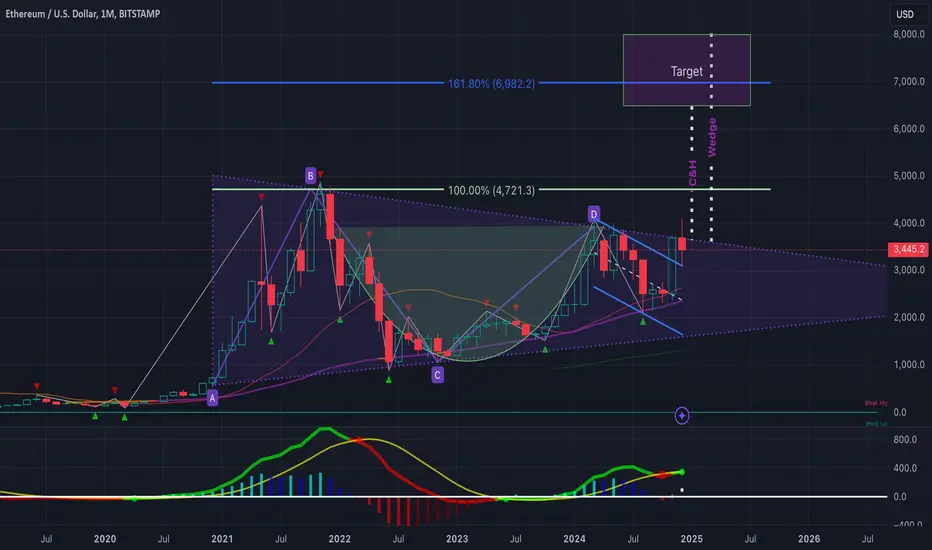
$ETH to $6.45k USD - 2024's Crescendo CRYPTOCAP:ETH is showing strong signs of an impending breakout to the $6.4k–$8k range, backed by two key technical indicators:
Cup & Handle Formation: ETH has recently broken out of a textbook cup and handle pattern, confirming the breakout with a solid retest over this past week of VOL. This is a classic bullish signal pointing to higher targets.
Bull Pennant: Since the 2021 rally, ETH has been consolidating within a massive bull pennant. This long-term structure suggests Ethereum is coiled and ready for a significant move upward.
1.618 Fib: Also layering in a Fibonacci retrace, if ETH is indeed heading for ATHs and price discovery, the 1.618 FIB is a common level that traders are very familiar with. It just so happens to be right in the middle of our target box at ~$7k!
Momentum is building— we will need to keep an eye on volume and follow-through for confirmation.
To boot, bearish sentiment for ETH is near all time highs. I think it might be time for a most-hated rally. I have a short term allocation in AMEX:ETHT to ride this momentum, NFA DYOR
EnaEna is retracing back with not so many obstacles on the way, similar to previous price action Ena is set to head to our next destinations