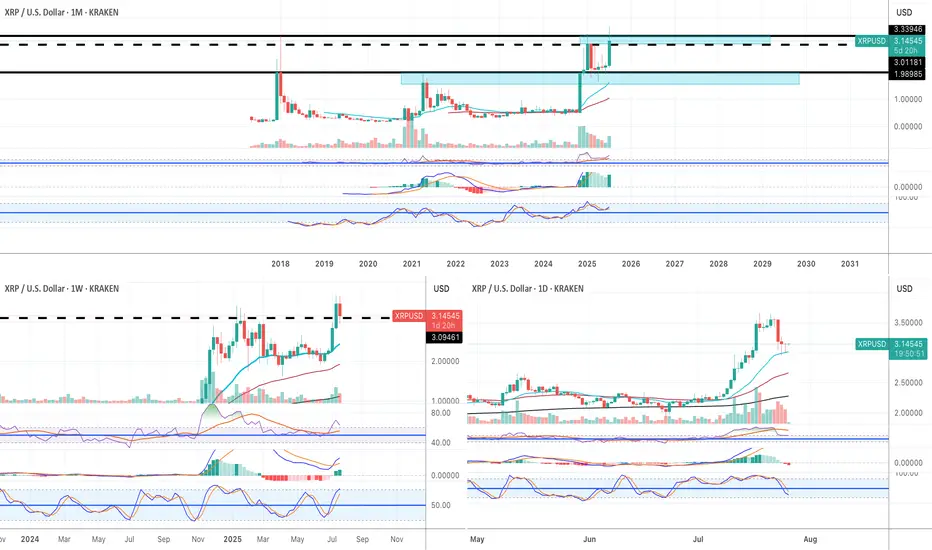
Super bullish!! (I am not a XRP fan, but still) XRP is one of those cryptocurrencies that attract cult-like followers. I am not one of them.
Fundamentally I have no idea about the long term potential of XRP. HOWEVER, purely based on technicaly analysis, it looks very bullish to me.
Monthly:
1) the price finally broke above the 2018 historical ATH.
2) All momentum indicators in the bull zone.
3) Both RSI and MACD are in the overbought territory but they can remain in the OB territory for weeks and weeks when the macro bull trend begins.
4) Stochastic lines have crossed to the upside in the bull zone.
Weekly:
1) all momentum indicators are in the bull zone.
2) The price broke above the historical ATH. It is going through pull back now, but, there is a strong buying pressure around $3.15.
Daily:
1) all momentum indicators have reached the overbought territory. The lines are now rolled to the downside, however, it is likely to be a corrective move.
2) the price is hovering above EMA21 where the recent price breakout happened on Thurs 17th July. I have been monitoring price action in lower time frames such as 5 and 15 minutes, and it looks like the price does not want to go below the previous historical high at this stage.
I am not very familiar with XRP, but purely based on the current price action, it looks very bullish. For the very first time as a trader/investor, I deployed my capital to buy XRP last Wed (just under $3.00).
I have already took some profit when it hit $3.60. But I am planning to sell 90% of my XRP when it reaches $4.50 and $5.00, and let the rest run just in case it goes to the moon😅.
Crypto market
Confluence Timing: How Precise Geometry & Magnet Zones Forecast 🌀 Confluence Timing: How Precise Geometry & Magnet Zones Forecast Flushes & Breakouts
📅 Date: July 31, 2025
🔎 Symbol: BTCUSD
📈 Timeframes: 4h, 1D, 1W
🧠 Concept Overview
What if we could predict high-impact moves not by guessing direction — but by timing structural convergence?
In this article, we present a geometric confluence model for BTC, where the intersection of diagonal structures and median zones has shown a recurring pattern of magnetism — leading to flushes, rebounds, or volatile breaks.
---
🔍 The Setup: Current Structure (as of 118.3k USD)
We are inside a compression structure, with:
Descending triangle resistance (upper yellow line, near 119k–120k)
Rising base support (lower yellow diagonal, anchored from ~114.5k)
Volatility median created from historical channels (parallel projection)
EMA Compression (8/13/21) on the Daily, showing dynamic tightness (~1.9 %)
→ Intersection timing of these structures projected a confluence window within 6h, confirmed by price clustering near apex.
---
🧪 Historical Backtest (Past 3 Years)
We analyzed similar confluence points using the same logic (RSI intact, EMAs tight, price near diagonal apex):
Event Date Timeframe Structure Result Movement
Oct 2023 1D Falling wedge & EMA cross Rebound +6.3% in 24h
Jan 2024 4h Triangle tip near POC Flush –4.5% in 6h
Mar 2025 1D Channel + RSI divergence Breakout +8.1% in 2 days
🧾 Average move from apex reaction zone:
Up: +6.8 %
Down: –4.2 %
Reaction window: within 6–12h of intersection
---
📊 Indicators in Play
EMA Cluster Contraction: 8/13/21 are within 1.9 % on Daily — historically leads to move within 12–24h
RSI(14) Stable + Fast RSI Rebound: Supports bullish continuation
Volume has dropped pre-break, classic behavior before resolution
Heatmap above shows major absorption at 119.0–119.4k
---
📌 Forecast Expectation
⏳ Timing: Apex cross within 6h
📈 If breakout: Target 122.8k → 124.4k → projected 127.6k
📉 If fakeout or flush: Bounce likely near 116.3k → watch for reclaim
📉 Short-term bear warning: Only if RSI breaks below 50 and EMAs get crossed to downside with volume spike.
---
📍 Actionable Notes
Long bias remains valid as long as structure holds and RSI remains above midline
A flush below 117.2k could trigger short-term breakdown, but buy-the-dip zones are active at 116.3k
Next major long opportunity: If price reclaims post-flush zone or breaks out above 119.8k with confirmation
Confluence model now active: future alerts will warn 4–6h before similar apex intersections
---
🧭 Conclusion
This is not just pattern trading. It’s time-sensitive geometry-based confluence tracking, with proven historical accuracy and structural logic.

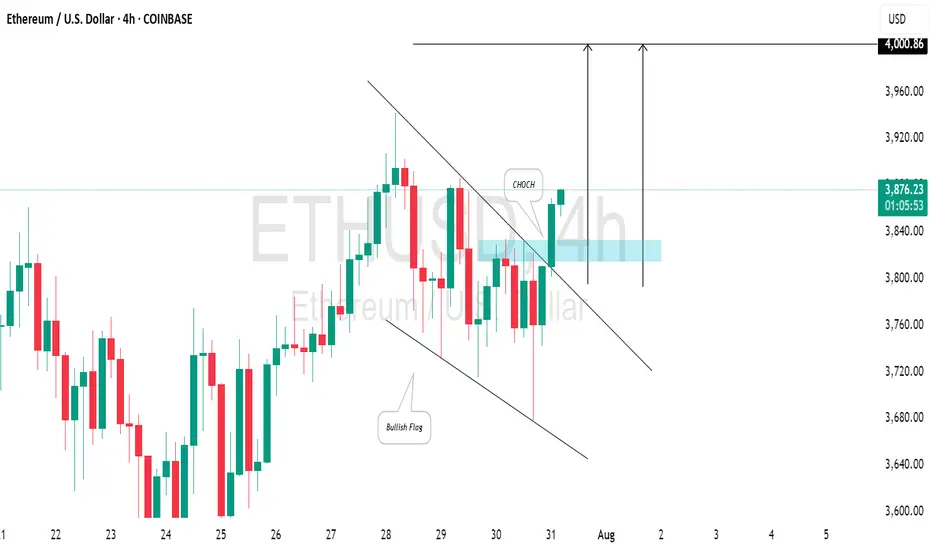
ETHEREUM (ETHUSD): Strong Bullish SignalsI spotted 2 important price action confirmations on 📈ETHEREUM:
The price has surpassed a resistance line of a bullish flag and established a confirmed change of character (CHoCH) on the 4-hour chart.
I believe the market will maintain a bullish trend, with the next resistance at the 4000 level.
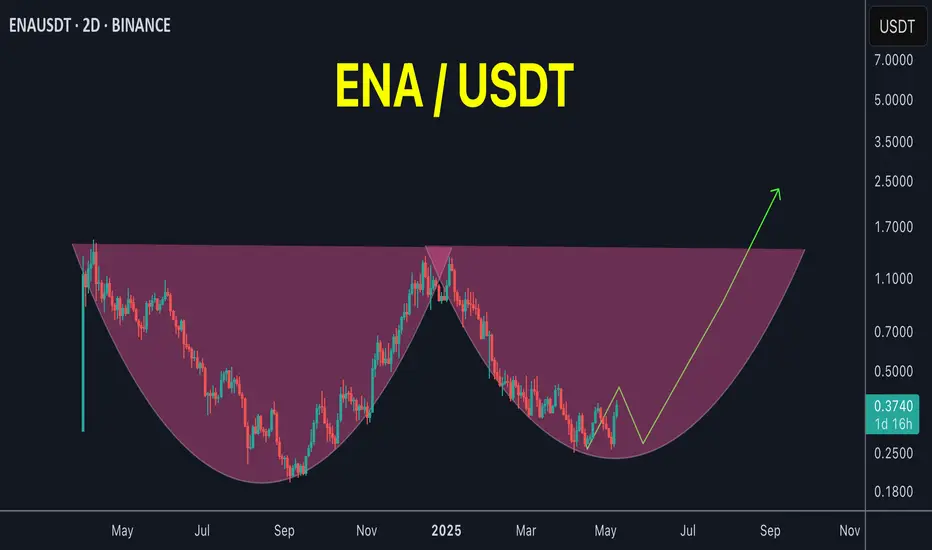
ENA / USDT#ENA / USDT
Iam expecting big returns from ETH and its related coins in this season
This chart is also looking good
Another Potential round bottom pattern under formation
Keep an eye
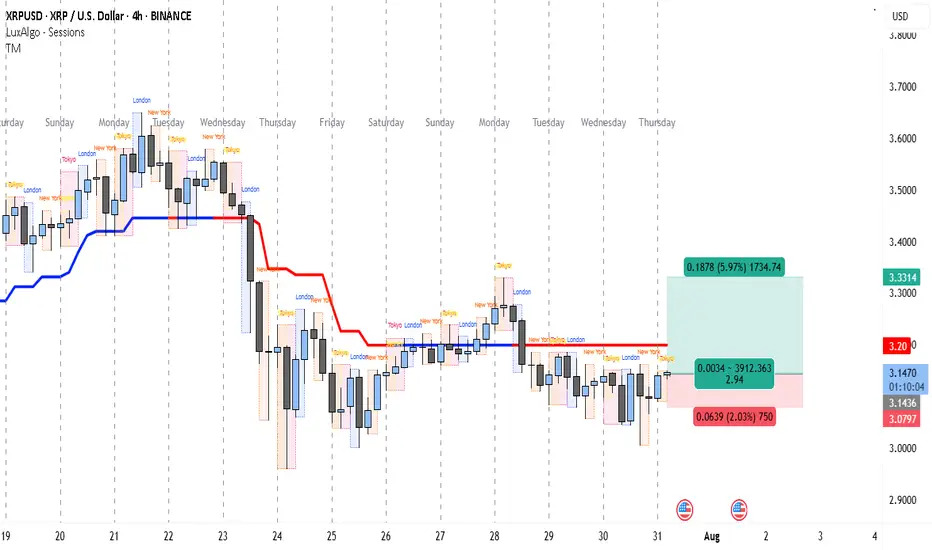
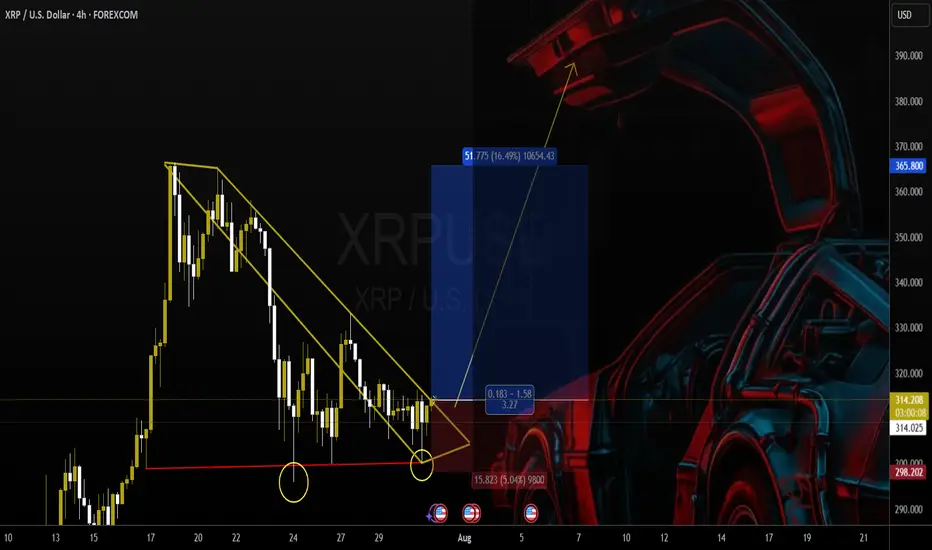
XRP’s 1:3 R:R Setup Could Pay Off FastThe 4-hour chart for XRP/USD indicates a market that has been under selling pressure since the sharp drop around July 23rd, where price broke down from the 3.40+ range. Since then, XRP has been struggling to reclaim higher levels, with the red trend indicator line (likely a moving average or trend-follow tool) acting as a persistent dynamic resistance.
After bottoming near the 3.05 zone on July 25th, the price moved into a sideways consolidation, repeatedly testing both the lower range (around 3.08) and upper range (around 3.20). This tight range suggests accumulation or distribution ahead of a bigger move.
Currently, the chart shows a potential long setup triggered around 3.1450, with a stop loss just below 3.0797 and a take profit target at 3.3314. This setup aims to capture a breakout from the consolidation zone toward the previous resistance area just below 3.35. The risk-to-reward ratio is favorable (close to 1:3), making it an attractive trade for short-term swing traders.
The target level aligns with the price area before the breakdown on July 23rd, where sellers previously gained control. Breaking through that level could signal a short-term trend reversal. However, the price still needs to clear the 3.20 resistance with a strong candle close to confirm bullish momentum.
Trade Setup
• Entry: 3.1450 (current level, inside consolidation support)
• Stop Loss: 3.0797 (below recent swing low)
• Take Profit: 3.3314 (prior resistance zone)
• Risk-to-Reward Ratio: ~1:2.94
• Trade Bias: Short-term long aiming for breakout from consolidation
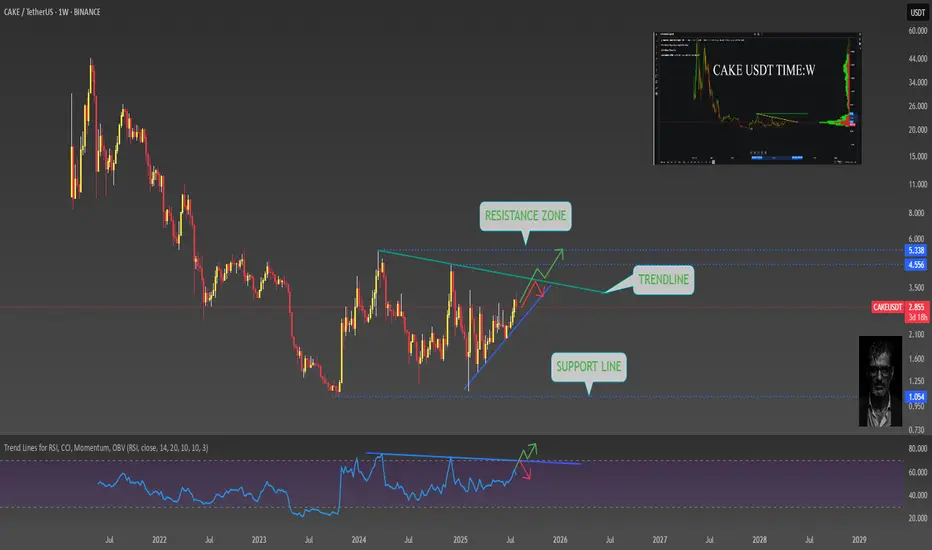
CAKE USDT :WThe CAKEUSDT currency is in a good position on the weekly timeframe near long-term dynamic resistance. Considering the RSI and trading volume, the probability of breaking this resistance is high.
Bitcoin, Ethereum & Market Indexes
🔻 🚀 Bitcoin, Ethereum & Market Indexes 🔍
💎 HWC (1D) – MWC (4H) – LWC (1H) Cycle Analysis
⭕️ Structural Review: TOTAL, TOTAL2, TOTAL3, BTC.D, USDT.D
🔥 analysis Coins: BTC, ETH
📉 Strategy: Dow Theory + Fundamentals + Market Sentiment
🔥 Daily Market Analysis – July 31st 🔥
💎 Summary of Key News & Strategy:
✔️ Interest rates were officially held steady at 4.5% – as widely expected. However, Powell’s comments added slight bearish pressure to the market in the short term ❗️
✔️ It’s important to note: recent market growth happened with the same rate in place. So any positive economic news from the U.S. from now until September could trigger a Bitcoin pump 🚀
✔️ One major bullish catalyst: MicroStrategy purchased 21,000 BTC – a strong institutional support signal 💎
✔️ With the BTC monthly candle closing in a few hours, keep risk low and proceed with caution ❗️
✔️ if Volume is picking up in BTC and altcoin momentum is building. This opens up a strategic opportunity to enter long positions even before key breakouts in TOTAL, TOTAL2, and TOTAL3 🔥
♦️ BTC/USDT
Support 1: 115,000
Support 2: 111,000
Resistance: 120,000
Despite 2 days of bearish pressure, the overall BTC structure remains bullish
If the 120,000 level breaks with strong volume, we can use a stop-buy strategy to enter a long. Sellers managed to push down to 115,700, but buyers defended the level well.
⭕️ This volume near support can serve as early confirmation to enter altcoins.
🔥 Break of 120,000 is critical for sustained altcoin rallies.
♦️ BTC Dominance (BTC.D)
Watch for a breakout above 60.44 – if that happens, you should already be in altcoin positions 🔥
It still hasn’t broken the 62–62.36 zone, which remains supportive for altcoin strength ✅
♦️ TOTAL Market Cap
If we see signs of breaking 3.92, we should already be positioned 🔥
Key support: 3.71 – as long as the market holds above it, the long scenario remains valid 💎
♦️ TOTAL2
Open position should happen before a confirmed break of 1.54 ❗️
Waiting until after could lead to late and risky entries. Stay alert and responsive ✅
♦️ TOTAL3
Same logic – position before the 1.08 breakout. Entry afterward will be harder due to sharp candle and volatility ⭕️
♦️ USDT Dominance (USDT.D)
Currently attempting to break 4.40 but has not succeeded ❌ – this is good for buyers.
We should have long positions before any potential drop below 4.13 🔥
♦️ ETH / USDT
Buyers successfully defended the 3,750 support zone 💎
Given strong institutional interest, ETH has high bullish potential.
A break above 4,000 with powerful candles could kickstart the next bull run 🚀
✅ Early Entry Trigger: 3,858 – but only if ETH dips below this level first and returns back to it.
This gives us a tighter stop-loss and better risk/reward setup.
❌ If ETH blasts through 3,858 with a sharp candle, avoid chasing the move.
⭕️ Additional confirmations:
• ETH/BTC should break 0.3277 to confirm ETH strength
• ETH.D should break 12.16 for final validation
Most likely, ETH.D and ETH/BTC will give early confirmation before ETH/USDT breaks 3,858 ✔️
💥 If you found this helpful, don’t forget to FOLLOW and smash that 🚀 button for more daily insights! 💎

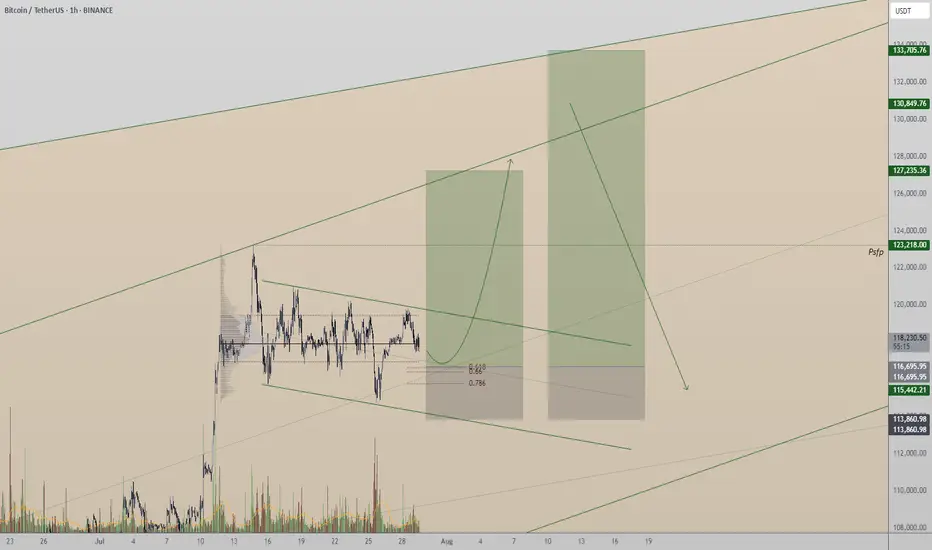
BTC intra?
Hi,
This price 118700 is stubborn.
Next time test again.. We shall buy a ticket for upsides.
Watch it.. could be flying if the top is broken again
Do nothin if price isn't into it
All the best
Not a guru.

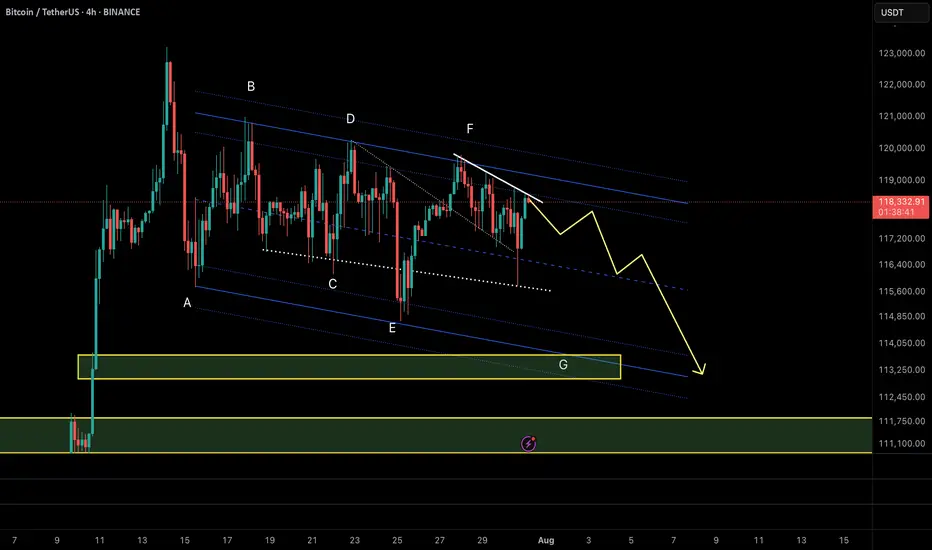
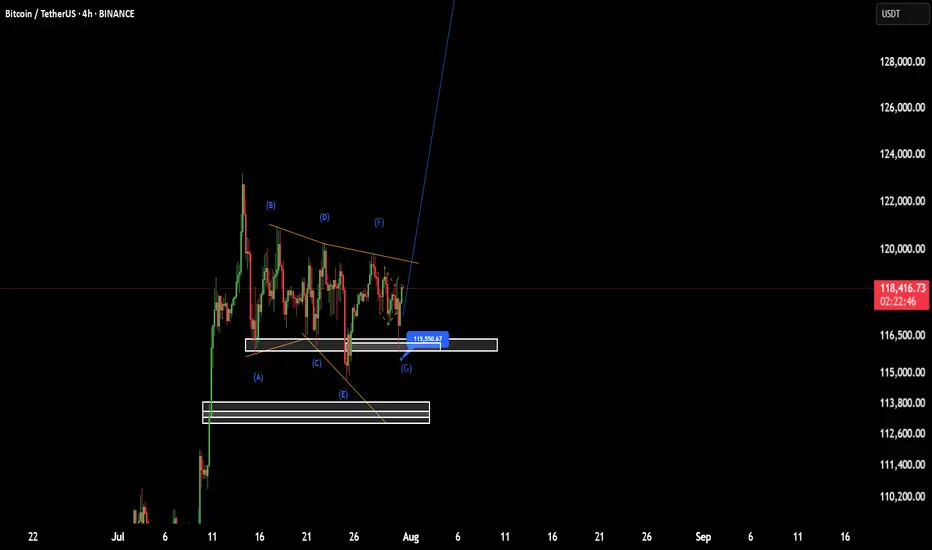
BTCUSDT – Diametric G-Leg Underway?⏱ Timeframe: 4H / 1H
🔍 Method: NeoWave + Smart Money Concepts (SMC)
📍Posted by: CryptoPilot
⸻
🧠 NeoWave Progression Update
As outlined in our previous analysis, we are tracking a potential Contracting Diametric structure (A–G) originating from the March 2025 highs.
🚨 The G-Leg may now be actively unfolding.
Here’s what just happened:
• Price rejected sharply from the supply zone near 119,000–119,500, exactly where Wave F was expected to end.
• After a drop to 115,780 (minor trendline), price bounced, but failed to make a new high, stalling at 118,700, forming a lower high → classic signature of a developing G-Leg.
• This G-wave likely aims to break below Wave E low, seeking imbalance fills and structural resets.
⸻
📊 Smart Money Confluence (SMC / ICT)
• 🟥 Bearish Market Structure confirmed via MSS on 1H: Lower Highs + Internal BOS
• 🟨 Buy-side Liquidity above 120k was already swept
• 🔻 Price failed to reclaim OB block around 119.5k
• 🧩 FVGs remain open between 114.5k–113k, acting as magnet zones
• 📉 Expectation: Price may now break the ascending minor trendline and accelerate toward the major structure low
📌 Primary Scenario:
• Wave G of Diametric in motion
• Potential structure: Zigzag or Complex Combination
• Expectation: Bearish continuation to break below 113k
📌 Alternative Scenario:
• If price closes above 120.5k, diametric structure may be invalidated
• Watch for triangle/flat development instead
⸻
⚠️ Risk Management Note:
Price action near 118.7k–119.5k is crucial. Reclaiming that zone with strength changes the bias. Until then, sellers remain in control.
💬 Final Thought:
We’re tracking the final stages of a multi-month complex correction. The rejection at supply, combined with SMC signals and NeoWave symmetry, suggests sellers may push price into deeper demand zones soon.
⸻
📌 Follow CryptoPilot for advanced wave structure updates, market geometry insights, and ICT-style smart money traps.
💬 Share your views or alternate wave counts in the comments!
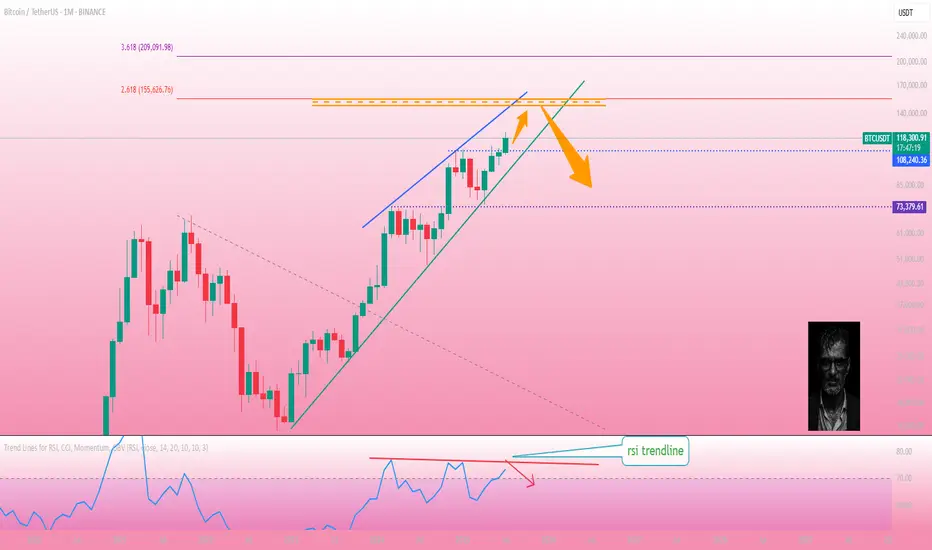
Bitcoin on a monthly time frameBitcoin on the monthly time frame.
If the monthly candle closes in this way, the price is expected to move to the 618 Fibonacci area. According to the trend line in RSI, we will enter a correction phase after the price rises.
Short Breakdown of Cardano (ADAUSDT) weekly/daily technicalsLooked over this for a friend. Rowland I would love your feedback in the comments 🫡
I will see my biggest expectation is for this to make it's way into the weekly imbalance range below the weekly Mother Candle we are existing within. The entire crypto market seems to want to revisit some key lows to correct some inefficiently delivered rally ranges (meaning too many pending orders left behind due to price not coming back to grab them, happens when HUGE money places--attempts to place/fill--bulk orders).
We are getting what I think is a temporary bullish correction due to taking of profits at key lows. It is my belief/observation that after correcting the newly minted bearish range (grabbing pending shorts above daily highs--turtle soup I think they call it), we will be able to drive down into the bullish imbalance weekly candle's range.
Let's see how we go! 😈

Bitcoin:Can Support at Point of Control Fuel a Move to New High?Bitcoin is currently consolidating at its local point of control, facing immediate resistance from a Fibonacci-aligned value area low. A critical reversal from here could pave the way to new all-time highs.
Bitcoin has entered a pivotal phase, trading at a key technical region that could determine its short-term direction. Over the past week, price action has hovered around the local point of control, showing signs of absorption and consolidation. With immediate resistance looming at a major confluence level, the next few daily candles may set the stage for either a breakout or a deeper retracement.
Key Technical Points:
- Local Point of Control: Bitcoin is ranging around this level, showing indecision
- Value Area Low + 0.618 Fib: Immediate resistance forms strong technical confluence
- Swing Low Critical: A break below the last swing low would invalidate bullish structure
Bitcoin’s current position around the local point of control reflects a phase of market equilibrium. This level represents the area of highest traded volume over the recent range, acting as both support and resistance at different times. The fact that price has revisited and hovered here for multiple days suggests active positioning from both bulls and bears.
Just above lies the value area low, which is in direct confluence with the 0.618 Fibonacci retracement from the recent swing high to swing low. This dual-layered resistance is significant — if Bitcoin is able to break above and reclaim this zone, it could unlock the next leg higher.
However, traders must remain cautious. The most recent swing low, formed during the last pullback, now acts as the final line of defense for bulls. A loss of this low would shift market structure to bearish and potentially initiate a correction deeper into the prior range.
So far, the lack of high-volume breakdowns suggests sellers have not yet gained control. But without a decisive bounce and follow-through above resistance, the risk of a failed reversal increases.
What to Expect in the Coming Price Action:
If Bitcoin holds above the point of control and mounts a successful challenge of the value area low, a rotation toward a new all-time high becomes increasingly likely. However, failure to defend the swing low would invalidate the setup and favor further downside. All eyes remain on the current consolidation for clues on the next major move.
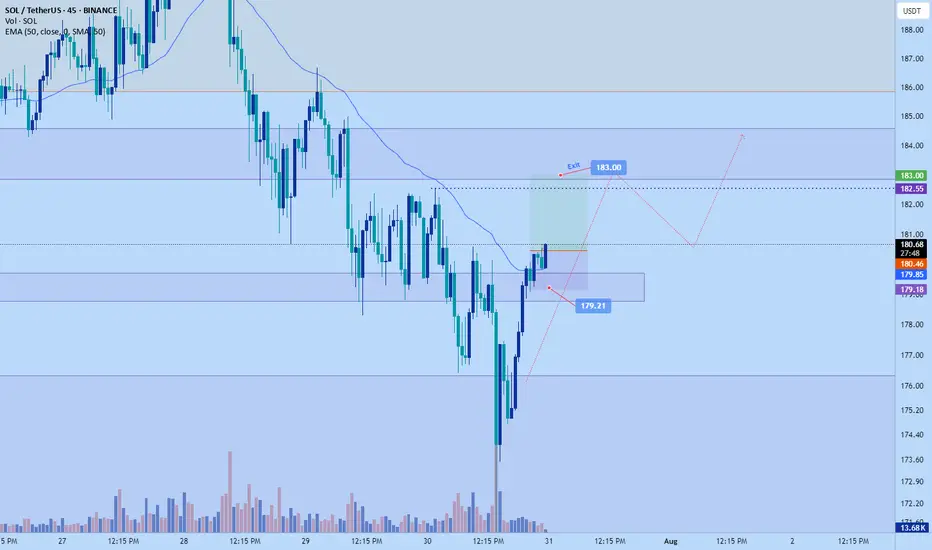
Solana scalp long to $183Just now opened a scalp long position on solana. Bulls are taking back control breaking resistance levels and no clear sign of exhaustion yet.
Sl: $179.21
Tp: $183
Roughly 2 RR
DTT strategy applied. - Direction , target and timing
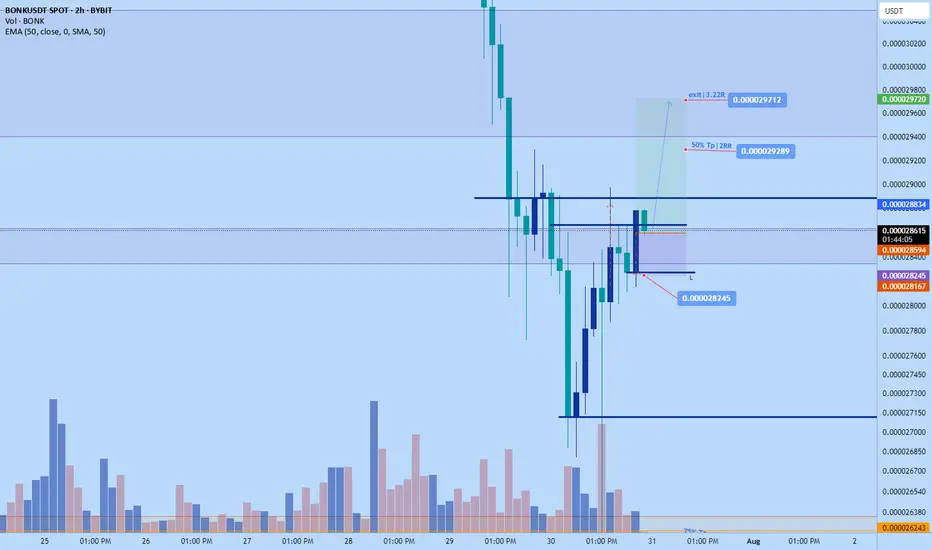
Bonk long to $0.029712just now opened up a long position on bonk. Market seems to be flipping back bullish on lower tf to continue up.
Sl: $0.028245
Time sensitive
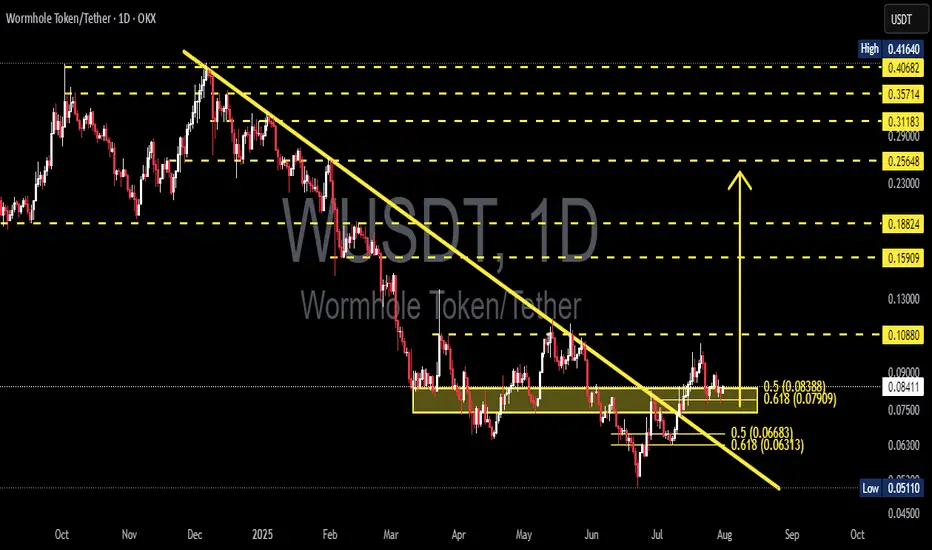
WUSDT Major Downtrend Break! Now Testing the Golden Pocket!🧩 Overview:
Wormhole Token (WUSDT) has finally broken out of a long-standing downtrend line that has been pressing the price down since February 2025. This breakout is a significant technical development and now the price is undergoing a critical retest phase — a moment that could mark the beginning of a major bullish reversal.
Price is currently consolidating around the Fibonacci 0.5–0.618 retracement zone (0.079–0.084), commonly known as the "Golden Pocket Zone" — a popular area for smart money accumulation.
---
🧠 Pattern & Structure:
📉 A long-term descending trendline was decisively broken, signaling a potential shift in market sentiment.
📦 A consolidation range is forming within a yellow support box — between 0.07909 and 0.08388, a prior resistance zone that is now being retested as support.
🔁 This is a classic breakout-retest structure, often seen before major price expansions.
---
🟢 Bullish Scenario (Reversal Potential):
If the price holds above the 0.079–0.084 support range, it sets the stage for a potential bullish continuation. Key upside targets include:
🔹 0.10880 – Previous distribution zone.
🔹 0.13000 – Psychological and structural resistance.
🔹 0.15909 – March resistance.
🔹 0.18824 – Measured move target from breakout.
🔹 0.23000–0.29000 – Expansion zone if momentum sustains.
A strong bullish candle closing above 0.09000 with increasing volume would strengthen this outlook.
---
🔴 Bearish Scenario (Failed Retest):
If the Golden Pocket fails to hold:
Price may retrace to lower supports:
🔻 0.07500 – Minor support zone.
🔻 0.06300 – Key support from June.
🔻 0.05110 – Yearly low and last line of defense. A breakdown below this level would revalidate the bearish trend.
Traders should be cautious if daily closes fall below the yellow zone with high selling volume.
---
💡 Conclusion & Strategy:
WUSDT is currently at a critical technical juncture. A confirmed breakout has occurred, but the retest phase is what will validate the strength of this move.
🎯 Swing traders may look for entries within the 0.079–0.084 range with invalidation below 0.075.
📉 Short-sellers might wait for a confirmed breakdown below this support with volume confirmation.
Momentum is building — the next move could define the mid-term trend.
---
📊 Chart Highlights:
✅ Downtrend Breakout: Confirmed
✅ Retesting Key Fibonacci Zone (0.5–0.618)
✅ Former Resistance → Becoming Support
🚨 Crucial Bullish-Bearish Decision Zone
#WUSDT #WUSDTAnalysis #WormholeToken #CryptoBreakout #GoldenPocket #PriceAction #FibonacciLevels #AltcoinReversal #TechnicalAnalysis
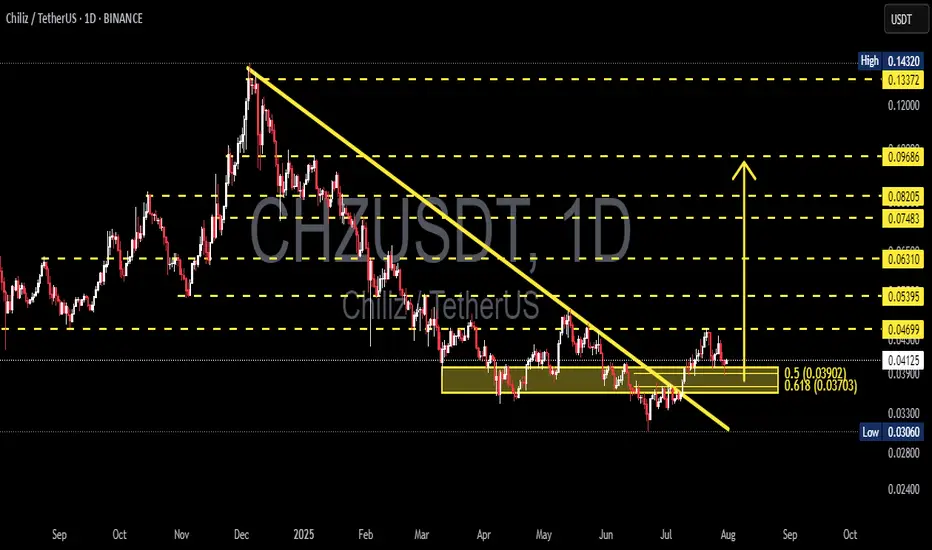
CHZUSDT Reversal Potential Breakout & Fibonacci Retest in FocusChart Analysis:
The CHZ/USDT pair on the 1D timeframe has successfully broken out of a long-term descending trendline, which had been acting as resistance since December 2024. The breakout occurred with a strong bullish candle, suggesting a potential trend reversal.
Currently, the price is performing a retest of the breakout zone, which aligns perfectly with the Fibonacci retracement levels:
0.5 at $0.03902
0.618 at $0.03703
This confluence zone is critical as it may serve as a base for a continued bullish move.
---
Pattern Identified:
Descending Triangle Breakout → Signaling the end of a distribution phase and the potential start of accumulation.
Bullish Retest Zone → Price is testing the previous resistance turned support + Fibonacci confluence.
---
Bullish Scenario:
✅ If price holds above the $0.037–$0.039 support area and forms a bullish rejection candle, potential upside targets include:
$0.04699 (minor resistance)
$0.05395
$0.06310
$0.07483
Up to psychological resistance at $0.09686
---
Bearish Scenario:
❌ If price breaks below the $0.03703 level, further downside could be seen toward:
$0.03306 (local support)
And possibly the recent low at $0.03060
However, as long as the price stays above the 0.618 Fibonacci, the bias remains bullish.
---
Conclusion:
CHZ/USDT is at a critical decision point. A successful retest of the breakout zone combined with Fibonacci support could provide a strong accumulation opportunity for buyers. Watch closely for bullish confirmation candles in the yellow zone before entering.
#CHZ #CHZUSDT #CryptoBreakout #FibonacciLevels #TechnicalAnalysis #AltcoinWatch #TrendReversal #CryptoTrading #TradingViewAnalysis
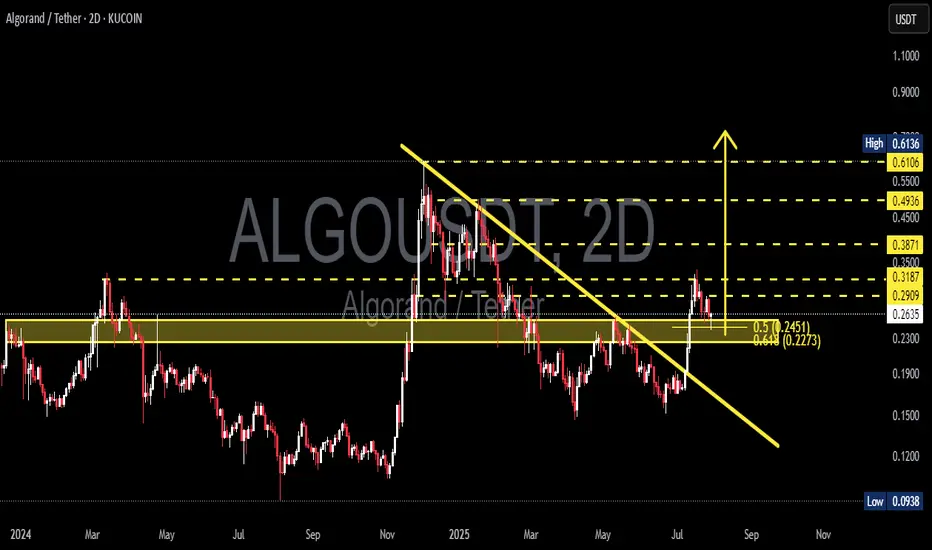
ALGOUSDT Break Downtrend – Reversal in Progress or Just a Retest📊 Technical Analysis Overview:
The Algorand (ALGO) / Tether (USDT) pair has shown a notable technical development by successfully breaking above a medium-term descending trendline that has acted as resistance since early 2025.
---
🔍 Pattern & Structure:
A clean breakout above the descending trendline (yellow sloped line) indicates a potential shift in trend from bearish to bullish.
Price is currently undergoing a retest of the breakout zone, aligning with the Fibonacci retracement levels 0.5 ($0.2451) and 0.618 ($0.2273).
The yellow horizontal zone ($0.25–$0.29) has been a significant support/resistance flip zone, showing strong historical reaction throughout 2024 and early 2025.
A higher high and higher low structure is starting to form — an early signal of a potential bullish reversal.
---
📈 Bullish Scenario:
If the price holds the support zone between $0.2451 and $0.2273, we could see a continuation of the upward move toward the following resistance levels:
$0.2909 (current minor resistance)
$0.3187
$0.3500
$0.3871
Mid-term targets: $0.4936 and $0.6106
A daily or 2D candle close above $0.3187 with strong volume would confirm a bullish continuation.
---
📉 Bearish Scenario:
On the other hand, failure to hold above the $0.2451–$0.2273 support zone could lead to a renewed bearish move with potential targets at:
$0.1900 (weekly historical support)
$0.1500
Extreme support: $0.0938 (2024 cycle low)
A break below $0.2273 would invalidate the breakout and may signal a bull trap.
---
📌 Summary:
ALGO is at a key inflection point. The current pullback could be a healthy correction after a breakout or a failed retest. Watch for price action and volume reaction near $0.2451–$0.2273 to confirm the next move.
#ALGO #Algorand #ALGOUSDT #CryptoAnalysis #TechnicalAnalysis #Breakout #BullishReversal #Fibonacci #SupportResistance #Altcoins #CryptoSetup #PriceAction
XRP Long!The setup looks solid! On the Daily timeframe, we’re likely seeing the formation of the final leg up. If this structure holds, we could be eyeing new all-time highs in the coming days to weeks. All indicators are aligned for a strong move ahead. Stay tuned for potential breakouts!
my analysis is not based on this i was just bored but moreso its based fundamentally on EMAS, and potential shifts I am anticipating.
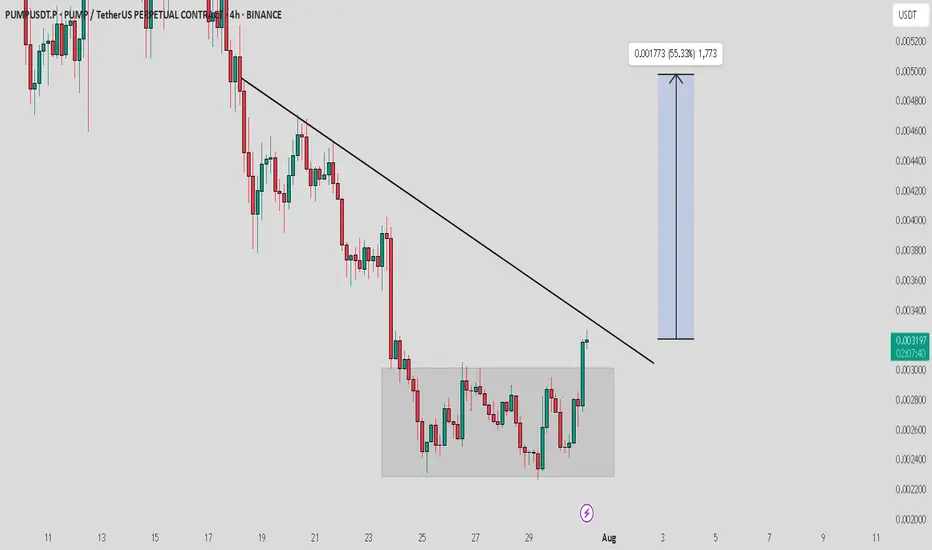
PUMP / USDT : Looking Bullish PUMP/USDT Analysis:
PUMP/USDT shows strong bullish potential after breaking out of consolidation. A retest to the box area is likely before a breakout from the trendline resistance. Once the trendline is broken, expect a major rally with a 40-50% potential upside.
Key Levels:
Support: Consolidation Box
Resistance: Trendline
Wait for confirmation of the trendline breakout before entering. Always manage risk with a stop-loss and stay patient for a clear move. The setup looks promising for a solid bullish rally!
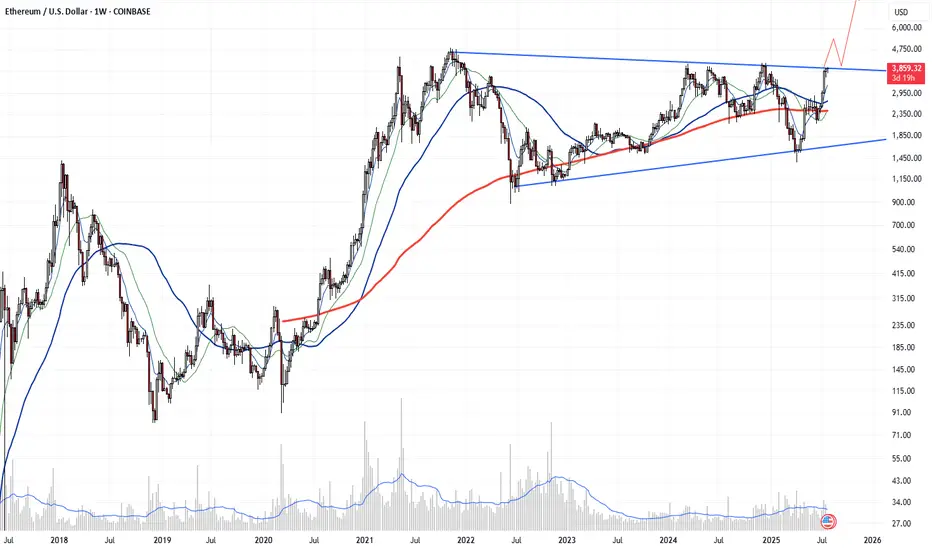
ALT season is here - this is huge, hugeETH is in an enormous symmetrical triangle on the weekly chart and its crossing upper line.
If the week finishes above 4000, nobody can stop this. Running to 6000 without stopping is almost certain.
After it needs to relax and the alt season will explode. This seems to be just a new life opportunity.
BTC(based on NEo wave)I think wave G is finished and soon it will pump to 138K.
stop loss is 115500.
attention:138K is the first target of these bullish waves.
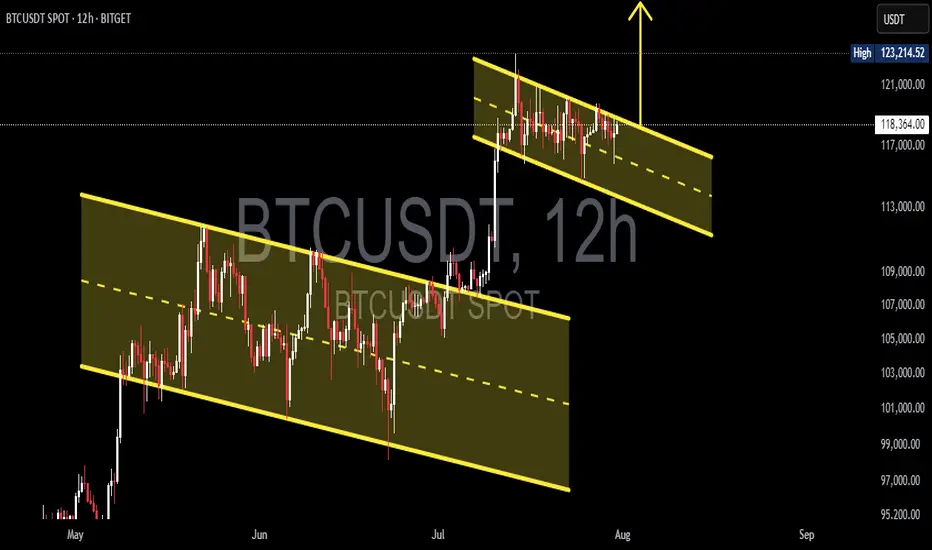
Bullish Flag Forming on BTCUSDT – Is the Next Big Move Coming?🧠 Complete and Insightful Technical Analysis:
The 12H BTCUSDT chart is currently showcasing a textbook Bullish Flag pattern, a powerful continuation structure that often precedes major upward moves.
---
🏗️ Pattern Breakdown: Bullish Flag
1. Flagpole:
The sharp breakout from around $107,000 to $123,000 marks the impulsive rally — this is the flagpole, created by strong bullish momentum.
Represents the "lift-off" phase where buyers dominate the market.
2. Flag (Consolidation Phase):
After the strong rally, price consolidates inside a downward-sloping parallel channel, forming the flag.
This pullback is healthy, characterized by declining volume, a key feature of the Bullish Flag.
Indicates temporary profit-taking before continuation.
3. Confirmation:
A breakout above the flag's upper boundary (around $123,000 – $124,000) with strong volume would confirm the pattern.
Breakout traders often use this as a high-probability entry.
---
📈 Bullish Scenario (High Probability):
If BTC breaks above the flag structure:
🎯 Measured Move Target (Based on Flagpole Height):
$123,000 + ($123,000 - $107,000) = $139,000
🚀 Potential for further upside if macro conditions and sentiment support the move, possibly reaching $135,000+ in the medium term.
Confirmation Required: A strong candle close above $123,500 with volume spike.
---
📉 Bearish Scenario (If Breakdown Occurs):
If BTC breaks down below the flag (~$117,000):
Retracement likely toward previous breakout zones at $112,000 – $109,000
Such a breakdown could turn the current structure into a fakeout or bear trap
However, this zone may present a strong re-entry opportunity for long-term bulls.
---
📚 Educational Insight for Traders:
Bullish Flags often appear during strong uptrends, acting as a pause before the next leg up.
A healthy pattern shows shrinking volume during the flag and rising volume at breakout.
Traders should monitor key horizontal resistance and volume behavior for confirmation.
---
🧭 Conclusion:
BTCUSDT is at a critical technical juncture. The formation of a clean Bullish Flag suggests the potential for a major continuation rally. Confirmation through a breakout is key — this is the time to prepare, not react.
#BTCUSDT #Bitcoin #BullishFlag #BTCBreakout #CryptoTechnicalAnalysis #CryptoTrading #PriceAction #BTCAnalysis #BitcoinPattern #CryptoEducation #BTCFlag #ContinuationPattern
LtcLtc lproject looks promising
Solid owners who define the true value of crypto
I don’t see any reason this turns bearish anytime soon
