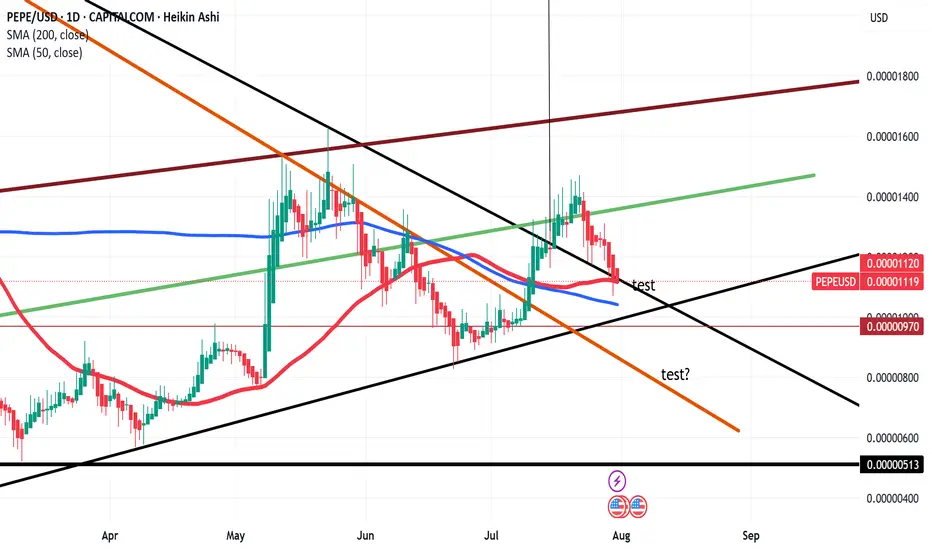
Don´t worry. It is only a question of testsFrom my point of view Pepe is only testing previous resistances. There is another major test, but I don´t think it will go there. However, because everything is possible if Pepe retraces even more, my target will be around 0,0000085. If that support is broken down... yes, I wouldn´t like to see that because maybe the steam has run out.
Nevetheless, I am still quite positive. Knowing that this is only a question of time. How much time? I don´t know. But I also don´t care much.
Now, let´s the Sp500´s dust settle down and let´s go afterwards. I am pretty sure that Pepe will go to 0,00004 in this bull cycle (minimum).
Crypto market
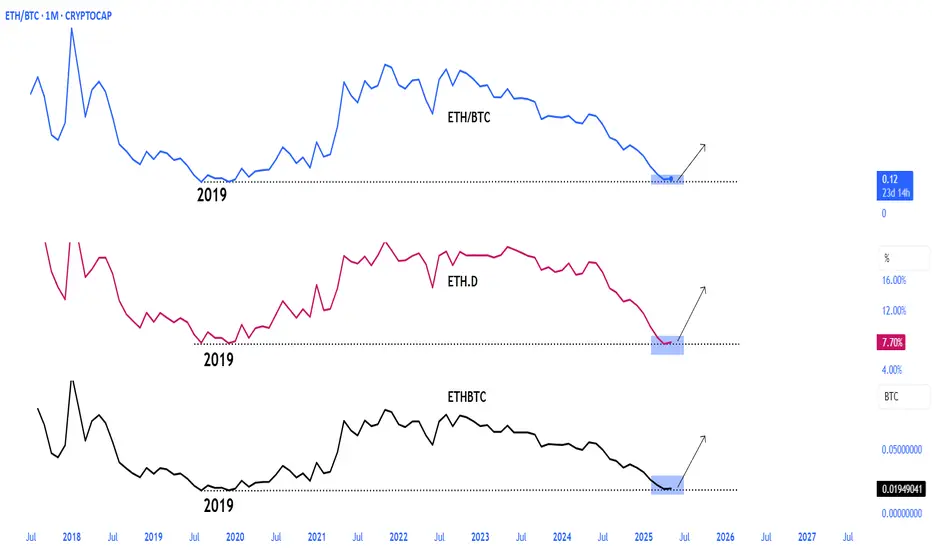
BTC.D Big Corection----is nice session for ALTs ? :PBTC Dominnace is in 1w time frame , i think the shape of chart is good for big correction .
if 1w FVG work correctly its could complete head and shoulder patter for down trend the chart.
if liquidity goes to total 2 market it can make ALTs greeeeen for some weeks.
ir is my personal idea and do not make decition on my mind.
please manage your risk and be care of some risk .:)
sincerely your
Mehdi Khamisi Zadeh

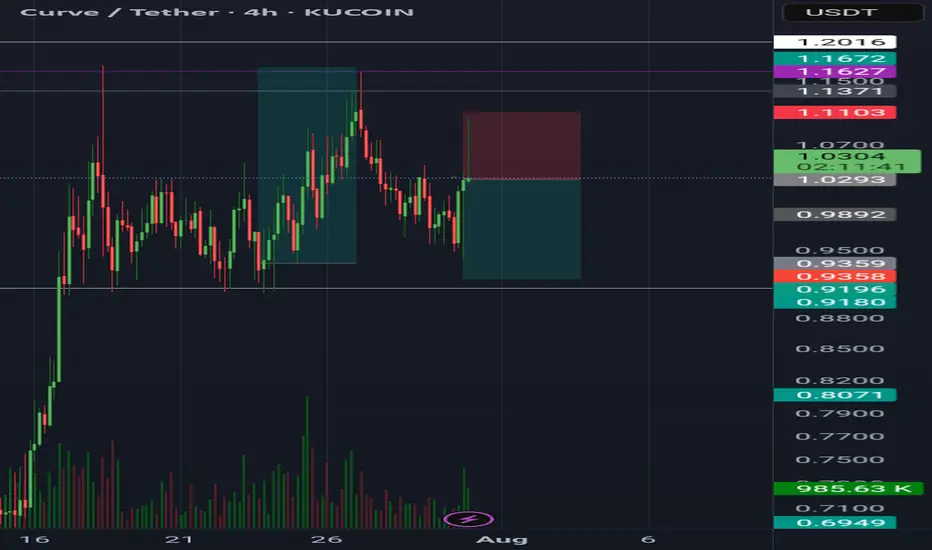
CurveCrv usdt daily analysis
Time frame 4 hours
Risk rewards ratio >1.3
Target 0.92$
Short position because of earthquake in the Russia
ETHUSD - Bearish But patternThe price completed the bearish bat harmonic pattern.
The level is additionally confirmed by another Fibo measurement and the price is at levels where usually returned.
Yet, the surging USD is a bearish factor.

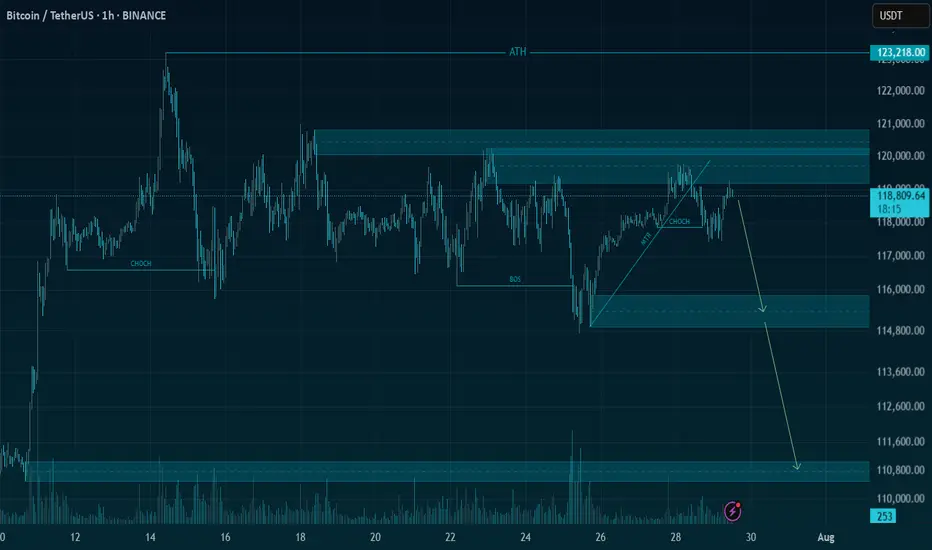
BTCUSDT | Bitcoin needs liquidity to be able to go up more🚀 Trade Setup Details:
🕯 #BTC/USDT 🔽 Sell | Short 🔽
⌛️ TimeFrame: 1H
--------------------
🛡 Risk Management:
🛡 If Your Account Balance: $1000
🛡 If Your Loss-Limit: 1%
🛡 Then Your Signal Margin: $1204.82
--------------------
☄️ En1: 118829.28 (Amount: $120.48)
☄️ En2: 119162.54 (Amount: $421.69)
☄️ En3: 119400.34 (Amount: $542.17)
☄️ En4: 119638.61 (Amount: $120.48)
--------------------
☄️ If All Entries Are Activated, Then:
☄️ Average.En: 119283.83 ($1204.82)
--------------------
☑️ TP1: 118025.43 (+1.05%) (RR:1.27)
☑️ TP2: 117427.5 (+1.56%) (RR:1.88)
☑️ TP3: 116671.89 (+2.19%) (RR:2.64)
☑️ TP4: 115717.73 (+2.99%) (RR:3.6)
☑️ TP5: 114673.35 (+3.87%) (RR:4.66)
--------------------
❌ SL: 120276.34 (-0.83%) (-$10)
--------------------
💯 Maximum.Lev: 66X
⌛️ Trading Type: Swing Trading
‼️ Signal Risk: ⚠️ High-Risk! ⚠️
🔎 Technical Analysis Breakdown:
This technical analysis is based on Price Action, Elliott waves, SMC (Smart Money Concepts), and ICT (Inner Circle Trader) concepts. All entry points, Target Points, and Stop Losses are calculated using professional mathematical formulas. As a result, you can have an optimal trade setup based on great risk management.
⚠️ Disclaimer:
Trading involves significant risk, and past performance does not guarantee future results. This analysis is for informational purposes only and should not be considered financial advice. Always conduct your research and trade responsibly.
💡 Stay Updated:
Like this technical analysis? Follow me for more in-depth insights, technical setups, and market updates. Let's trade smarter together!
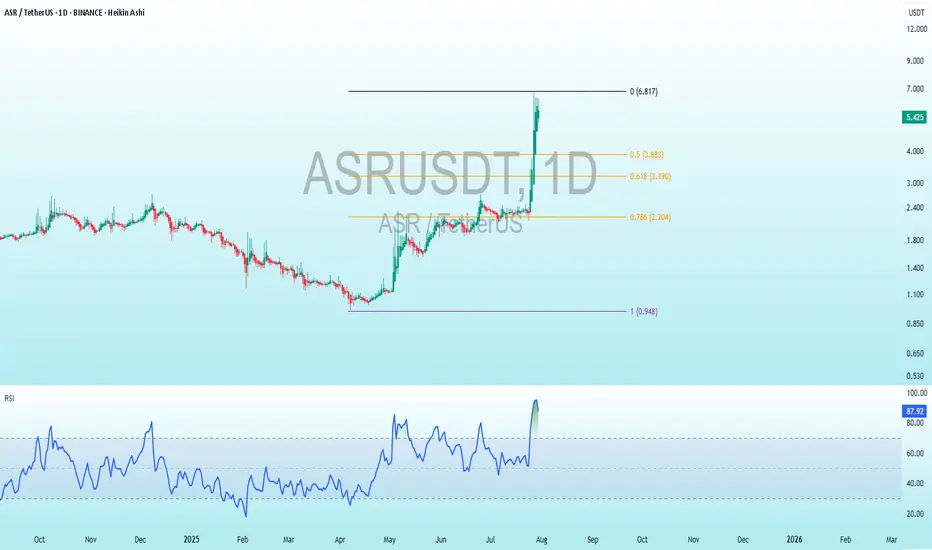
ASR Bearish DivergenceBINANCE:ASRUSDT
Trade Setup:
Target 1: 3.883 (0.5 Fibonnaci Golden Zone).
Target 2: 3.190 (0.618 Fibonnaci Golden Zone).
Target 3: 2.204 (0.786 Fibonnaci Golden Zone).
Target 4: 0.948 (1 Fibonnaci).
Stop Loss: 6.817 (0 Fibonnaci).
RSI Analysis: The RSI is showing a bullish divergence, suggesting potential bullish momentum. The current RSI is around 88.00, approaching overbuy territory, so caution is advised.
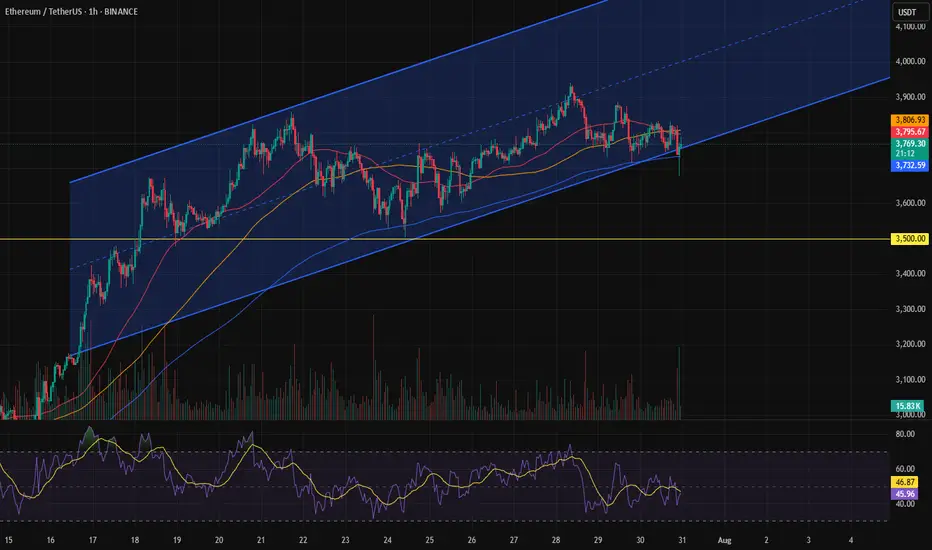
Ethereum at \$3,500 — or not?As we can see, Ethereum was moving within a channel, but toward the end, it could only reach the midline of the channel before getting rejected.
This could be a signal for a drop toward the \$3,500 area.
Otherwise, it might be a fake move, followed by a return into the channel and a move back toward the channel’s midline.

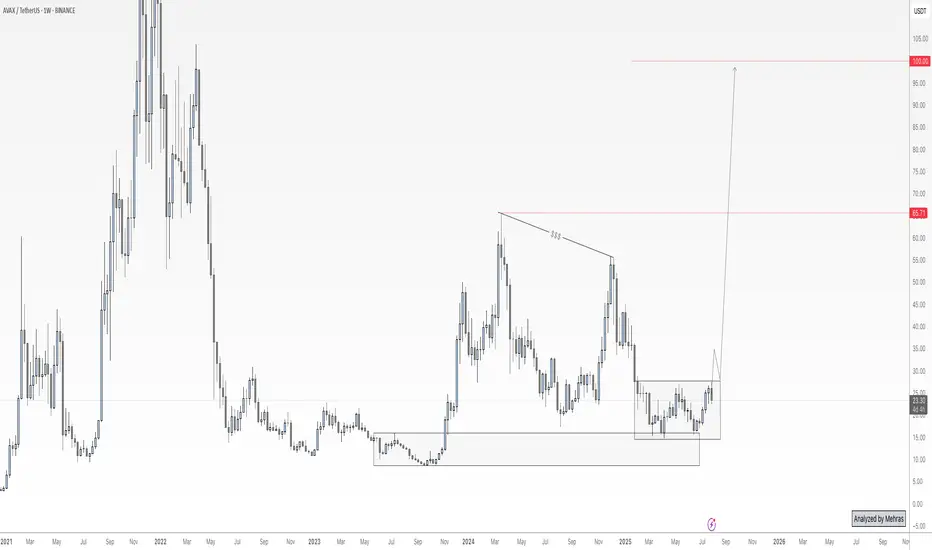
AVAX – Hidden Chance for Latecomers🔥AVAX – High-Potential Setup Amid Market Catch-Up
While many crypto assets have surged in the recent bullish wave, AVAX appears to have been left behind — and that could present a high-reward opportunity ahead.
From both a fundamental and on-chain perspective, this project shows promising signs, especially with notable activity among whale wallets. I believe AVAX has the potential for a strong long-term rally — but there’s one critical condition to watch.
Price has recently reacted to a key custom demand zone. However, for confirmation of buy-side strength, we need to see a clean breakout and daily close above the ~$28 level. If that breakout is confirmed, I’ll be looking to accumulate for a long-term hold, with a target of $65 — and possibly up to $100 if momentum continues.
That said, risk management remains my top priority. I’ll allocate no more than 3–4% of my total portfolio to this position.
Keep an eye on the $28 breakout. If the trade is triggered, I’ll provide updates here.
🔁 This analysis will be updated whenever necessary.
Disclaimer: This is not financial advice. Just my personal opinion.
ETH potential reenteryHELLO THERE)
imma post here again
lemme know in what type of content ur intrested most
Ive been trading all that time
almost 8 years atm

Bitcoin's Natural Correction and the $141K Target Based on Fibonhello dear trader and investors
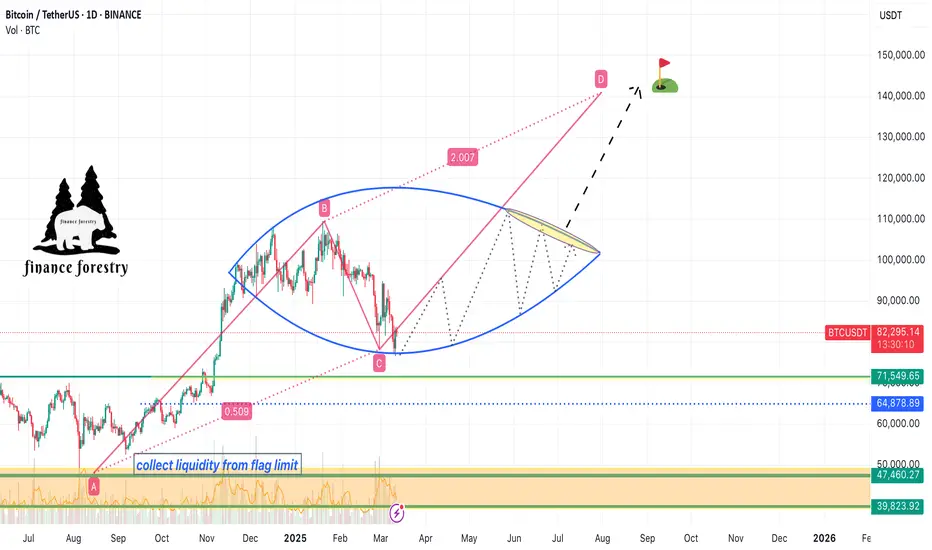
The cryptocurrency market is always accompanied by strong fluctuations and natural corrections. Bitcoin, as the market leader, requires corrections and liquidity accumulation after each significant rally to pave the way for higher price targets. In this article, we analyze Fibonacci structures and harmonic patterns to demonstrate that Bitcoin's next target could be $141K.
1. Bitcoin Corrections: A Natural Part of an Uptrend
Price corrections in bullish trends are a normal phenomenon that helps shake out weak hands and allows major players to accumulate liquidity. Historically, Bitcoin has experienced 20-30% corrections before resuming its upward trajectory. The current correction is no different and may serve as a base for the next strong move toward higher targets.
2. The $141K Target Based on Fibonacci
Fibonacci levels are among the most reliable tools for predicting price targets. Assuming Bitcoin's recent high was around FWB:73K and the ongoing pullback is a healthy retracement, we can use harmonic AB=CD pattern to project potential upside targets. Based on these levels, Bitcoin could reach $141K in the next bullish phase.
Confirmation Through Harmonic Patterns
Harmonic patterns like Butterfly and Gartley suggest that the current correction is forming a potential reversal structure. If this correction completes within the PRZ (Potential Reversal Zone), Bitcoin could see a strong continuation of its uptrend. The Fibonacci ratios in these harmonic structures indicate that the final price target for this bullish wave could be around $141K.
Volume and Liquidity: Key Drivers for the Rally
Bitcoin needs increased volume and liquidity inflows to reach higher levels. On-chain data shows that trading volumes are rising and large investors (whales) are accumulating rather than selling. This behavior typically precedes a strong bullish move.
Bitcoin's current correction is entirely natural, and technical structures suggest that it could be laying the foundation for a new bullish wave. Based on Fibonacci and harmonic pattern analysis, Bitcoin's next major target is around $141K. Traders and investors should consider these levels in their analysis and avoid emotional decisions during market corrections
good luck
mehdi
ETH: Buyers Show Their HandETH on the 4H
The Fed noise is gone, now it’s just pure market intent.
Price wicked below the 0.236 Fib, but buyers stepped in fast, showing strength at that level.
A small bullish divergence is forming on the RSI. If ETH holds above the Fib, that signal could gain momentum.
Always take profits and manage risk.
Interaction is welcome.

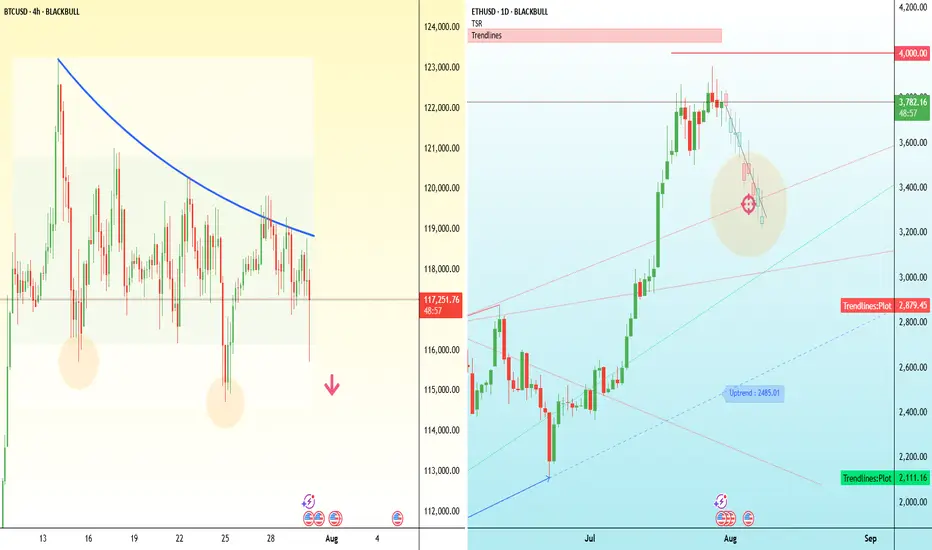
Major test for crypto bulls - BTC and ETH Bitcoin has dipped below $118,000, putting pressure on the bullish structure that’s held for the past two weeks.
The attempted breakout above $121,000 has failed, and price is now breaking down through the middle of the consolidation range, threatening short-term higher lows. On the 4H chart, this move resembles a failed breakout with a potential double-top near $121,000.
If Bitcoin can’t reclaim $116,000 quickly, the next downside levels to watch are $114,000 and $110,000.
Ethereum, meanwhile, has stalled just below $3,800 after a strong rally this month. Price action has flattened out over the past few days, with several failed attempts to push through that level. The key upside trigger remains $4,000.
But if $3,700 gives way, ETH may slide back to the $3,450–$3,300 region, where previous resistance and the rising trendline converge.
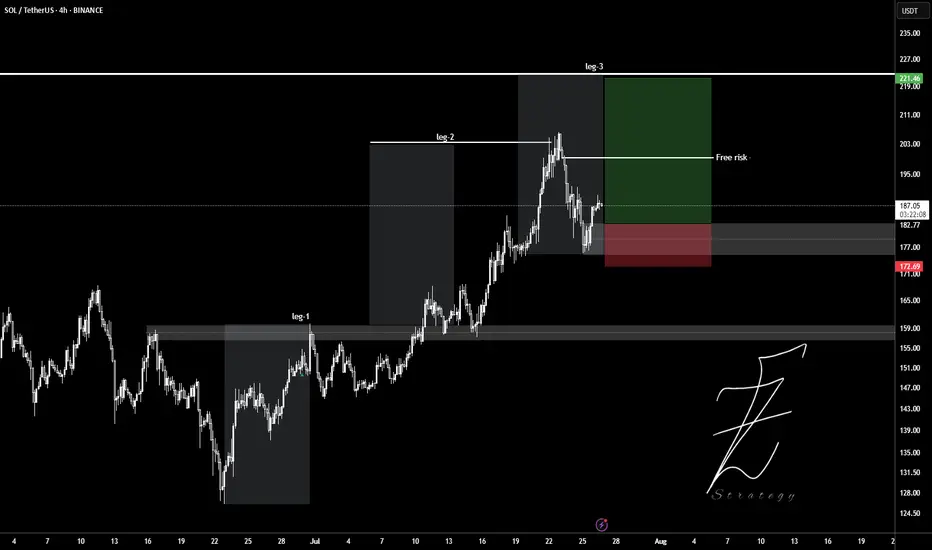
SOLUSDTWait for pollback to 180$ level and ready to get buy position.
Target set in leg2 and leg3.
Entry: 182
Stop: 177
Tp: 190 - 200 - 210 - 220
Please control Risk management.
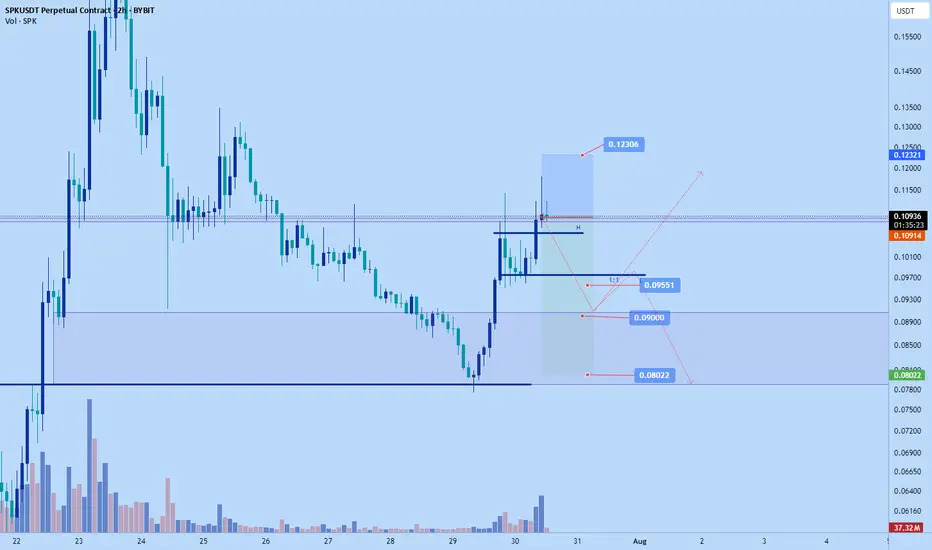
SPK casual scalp short $0.09551 or lowerCasual spk short. Not according to trade plan. Reduced size and wide sl. Anticipating a correction down soon.
BITCOIN → Correction within a downward channel. 112K or 125K?BINANCE:BTCUSDT is consolidating. However, a local downward trading range is forming relative to the current setup. What is the probability of a correction continuing to 112K or growth to 125K?
Daily structure: a local correctional channel within a global bullish trend. We have cascading resistance at 119.2, 119.6, 120, and 120.8. It will be quite difficult to break through this zone on the first attempt, but MM can use it to form traps and collect liquidity.
At the bottom, everything is simpler — a breakdown of the local bullish structure, the formation of an intermediate minimum, below which there is a void down to 112K.
Yesterday, relative to 115-116K, mm staged a massacre (trap) on both sides of the market.
Liquidity collection, return to the range, and growth. The reaction to the false breakdown of support is quite strong. Since the opening of the session, Bitcoin has been heading towards resistance, but there may not be enough potential to break through the upper resistance conglomerate, so I expect to see a pullback or decline to 116-115-114.
Resistance levels: 119.2, 120.1, 120.85
Support levels: 116.37, 115.67, 112
Technically and fundamentally, I do not see any drivers that could support the market (I am talking about Bitcoin, since the driver for altcoins is the decline in Bitcoin's dominance). It is possible that this may appear later. In the current situation, I am considering a false breakout and correction, as the market has not yet finished consolidating or correcting, and the current downward trading range may be extended.
PS: As the price moves towards resistance, it is necessary to monitor the reaction. The market itself will show what it is preparing for...
Best regards, R. Linda!

Has gold bottomed out on July 30?
Key Influencing Factors
Negative Factors:
A stronger US dollar: A rebound in the US dollar index is suppressing gold prices.
Recovering risk appetite: Market demand for safe-haven assets is weakening.
Rising real interest rates: Expectations of Fed policy are impacting the cost of holding gold.
US-EU trade agreement: Easing geopolitical tensions will weaken gold's safe-haven appeal.
Potentially bullish variables:
Federal Reserve policy signals: A dovish statement on Wednesday could boost gold prices.
Geopolitical risks: Uncertainties such as the Sino-US trade negotiations and the situation in the Middle East remain.
Technical Analysis
Trend Analysis:
Short-term weakness (four consecutive negative daily candlestick patterns), but the broader bullish trend remains.
Key support level: 3300-3285 (falling below or falling to 3250); resistance level: 3330-3345 (breaking through may end the pullback).
Key Levels:
Downward Support: 3310-3300 (short-term), 3285 (strong support). Upper resistance: 3335-3345 (trend reversal expected after a breakout).
Trading Strategy
Short-term Trading:
Long positions primarily at low levels: Try a light buy position in the 3300-3310 area, with a stop-loss below 3285 and a target of 3330-3345.
Short selling at high levels is auxiliary: If it rebounds to 3335-3345 and is under pressure, you can short sell with a stop loss above 3350 and a target of 3310-3300.
Follow up on the breakout: If it breaks through 3345 strongly, you can chase long positions; if it falls below 3285, be wary of a rebound after a false break.
Medium- to Long-term Strategy:
Watch for potential bottoming opportunities near 3285. If it stabilizes, place long positions in batches, betting on dovish signals from the Federal Reserve or escalating geopolitical risks.
Risk Warning: Data-sensitive period: This week's Federal Reserve decision and economic data may trigger significant volatility, so position management is crucial. US Dollar Trends: The US dollar and gold prices show a significant negative correlation, so the US Dollar Index should be monitored closely.
Risk of false break: There may be a trap below 3300, which needs to be confirmed in combination with the K-line pattern.
Summary: Gold is under short-term pressure, but the medium- to long-term bullish outlook remains unchanged. Focus on the effectiveness of support in the 3300-3285 area and the direction of the Federal Reserve's policy. We recommend a flexible approach, using key breakthroughs as a guide for directional analysis, and cautiously holding positions before data releases.


Btcusd techinical analysis.Btcusd techinical analysis next move posibale at h1 time frame not finchinal advice.

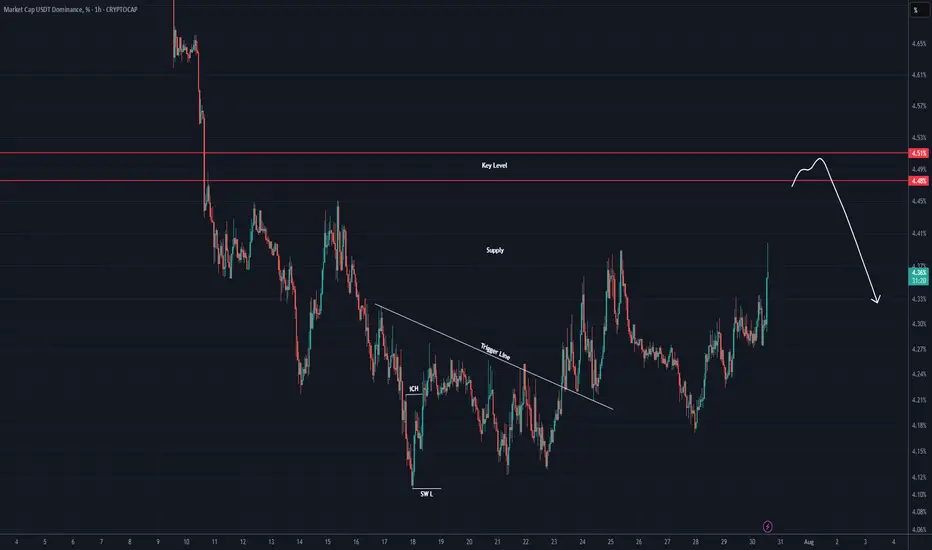
USDT DOMINANCE New Update (4H)First of all you should know that "USDT Dominance" is always moving inverse of BTCUSDT
We have a key level on the chart that This key level has been lost, and there hasn't been a pullback to it yet. It seems that the candles intend to make a pullback to this level. Upon this pullback, we expect a rejection to the downside.
Let's see what happens.
For risk management, please don't forget stop loss and capital management
Comment if you have any questions
Thank You