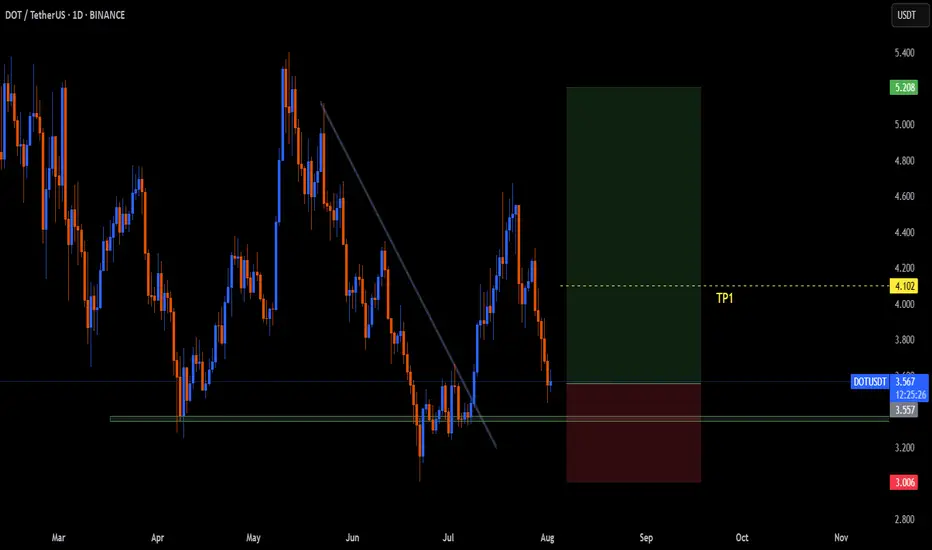
Polkadot · Trading at Bottom Prices · Bullish Scenario ExplainedThe same levels, the same prices, the same support zone. Polkadot is still trading at bottom prices. From the bottom the market tends to grow.
Good morning my fellow Cryptocurrency trader, I hope you are having a wonderful day. Notice the brown lines on the chart. We have the 7-April low, the June 22 low and also the low in March and yesterday, 1 August. This is a bottom range and this is the buy zone.
Polkadot (DOTUSDT) has been trading near this range since February 2025, six months ago. This is a very long—and strong—consolidation period. This much accumulation is surely the preparation for a major market change, a change of trend. A new uptrend. An event that has not happened since 2021.
I think the most important part is to truly understand that a bullish wave develops only from low prices. Notice the peak from December 2024. As soon as prices are high, the market seeks balance and starts to decline. But, when prices are low, an accumulation period develops and afterward a wave of growth. That is what I see happening right now across the market and with this chart. It already happened to hundreds of projects, literally. They all had the same chart.
These projects grew in late 2024, November-December. Then they went into correction in early 2025 until recently. The current low as witnessed on DOTUSDT led to massive growth. Some of these pairs are trading at new all-time highs while others have grown 500% or more. Those trading at the bottom are still early and next in line to move when the market does.
We will be bullish within days, as soon as Bitcoin ends its retrace. I shared in another publication why I believe Bitcoin will recover in the coming days.
Thank you for reading.
Namaste.
Crypto market

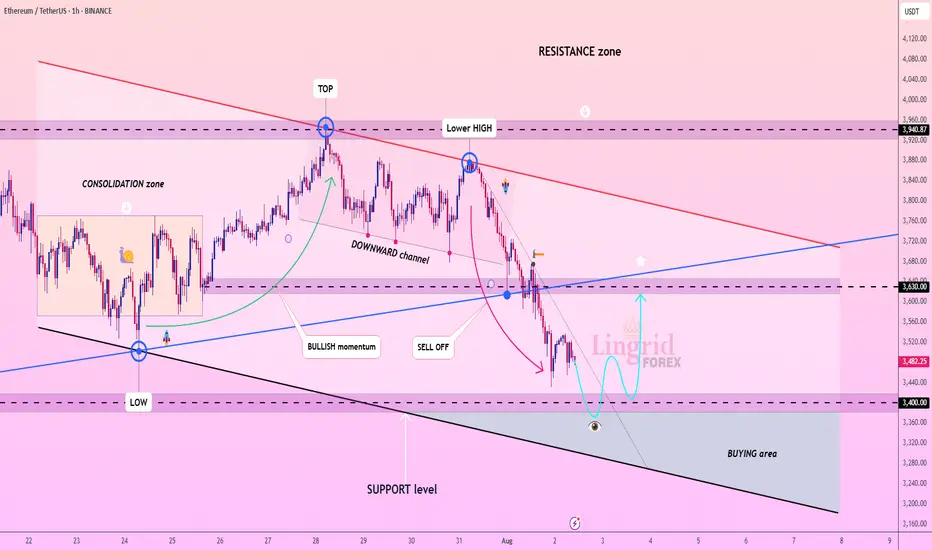
Lingrid | ETHUSDT Short-Term Move: Buying Opportunity at SupportThe price perfectly fulfilled my last idea . BINANCE:ETHUSDT is attempting a bounce after dipping into the lower boundary of its channel near the $3,400 support level. Price action has followed a descending structure with lower highs inside a broad downward channel. As long as the $3,400 zone holds, a rebound toward the mid-range resistance at $3,630 remains viable. Current positioning inside the "BUYING area" suggests momentum may flip bullish if a reversal structure forms.
📉 Key Levels
Buy trigger: Break above $3,630
Buy zone: $3,250 – $3,400
Target: $3,630 – $3,720
Invalidation: Break below $3,250
💡 Risks
Momentum still favors sellers from the recent sell-off
Failure to reclaim mid-range resistance could cap upside
Broader trend remains within a bearish channel structure
If this idea resonates with you or you have your own opinion, traders, hit the comments. I’m excited to read your thoughts!
BTCUSD Short Setup – 4H Bitcoin has broken below a key dynamic support zone, and current price action signals a potential continuation to the downside. This short entry is supported by multiple technical confluences:
🔻 Bearish Confluences:
Fibonacci Retracement Rejection: Price rejected the 61.8% Fib retracement zone near $114,978, confirming a potential local top.
Trend Structure: Clear lower high, lower low structure forming on 4H – momentum favors sellers.
EMA Cloud Pressure: Price is decisively below the multi-band EMA cloud, showing sustained bearish pressure and trend bias.
Volume Profile Gap: Price is entering a low-volume node between $113.8k and $112k, increasing likelihood of a sharp move down.
Bearish Candlestick Pattern: A strong bearish engulfing candle formed after the retracement – a classic reversal confirmation.
🎯 Fibonacci-Based Targets:
TP1 – $11205 (38.2%): Initial demand zone and minor support.
TP2 – $11024 (61.8%): Mid-extension level, aligns with prior consolidation.
TP3 – $10731 (100%): Full measured move target if the downtrend accelerates.
SL: Placed just above the recent swing high at $11678, protecting against false breakouts.

btc consolidation and downentire bull market has been big impulse move up then consolidation and slightly more down than would be expected with typical bull flag
BTCUSDT – Key Support Holding! Next Targets if 115,827 BreaksBitcoin is currently holding above a crucial support zone around 115,220. After a recent drop to the 114,979 area, buyers stepped in strongly, preventing further downside.
📊 If price stabilizes above 115,220 and successfully breaks through the resistance at 115,827, I expect bullish continuation towards the following targets:
🎯 Target 1: 117,900
🎯 Target 2: 119,076
These zones acted as strong resistances previously, and breaking through them could open the path to further upside.
⚠️ However, if BTC closes below 114,500, we may see a bearish breakdown with potential downside towards 108,000 – 106,000 range.
📌 Personally, I hope Bitcoin holds this support as it’s a key level to maintain bullish momentum.
Let’s see how the market reacts in the next few candles! BINANCE:BTCUSDT

Deep Dive Into Bollinger Bands 🗓This article explores the Bollinger Bands indicator—a powerful volatility tool used by traders worldwide. You'll learn how it works, how to calculate it, and how to use it to detect potential breakouts, trend reversals, and overbought or oversold conditions in the market.
📚 Introduction to Bollinger Bands
In the fast-paced world of trading, understanding market volatility is key to making informed decisions. Bollinger Bands, developed by John Bollinger in the 1980s, offer a visual and statistical method to measure this volatility. Unlike simple moving averages, which only tell you the trend, Bollinger Bands expand and contract based on recent price action, helping traders spot overbought, oversold, or consolidation phases.
These bands dynamically adjust to market conditions, making them one of the most popular indicators for trend-following, mean-reversion, and breakout strategies. Whether you’re trading crypto, stocks, or forex, Bollinger Bands can help you identify high-probability setups by combining trend direction with volatility.
📚 How Bollinger Bands Are Calculated
Bollinger Bands consist of three lines:
Middle Band – This is a simple moving average (SMA) of the price, typically over 20 periods.
Upper Band – The middle band plus two standard deviations.
Lower Band – The middle band minus two standard deviations.
Middle Band = SMA(n)
Upper Band = SMA(n) + (k × σₙ)
Lower Band = SMA(n) - (k × σₙ)
Where σₙ is the standard deviation of the price for n periods and k is the multiplier, typically set to 2, which captures ~95% of price action under normal distribution. The middle band shows the average price over the last 20 candles. The upper and lower bands adjust based on how volatile the price has been — expanding in high volatility and contracting in low volatility.
🤖 For those traders who want to implement Bollinger Bands into algorithmic strategy we provide formula it's calculation in Pine Script:
basis = ta.sma(src, length) // Middle Band (SMA)
dev = mult * ta.stdev(src, length) // Standard Deviation × Multiplier
upper = basis + dev // Upper Band
lower = basis - dev // Lower Band
📚 How to Use MACD in Trading Strategies
⚡️Bollinger Band Squeeze (Volatility Contraction and Expansion)
The idea is pretty simple, а squeeze indicates low volatility and often precedes a breakout. The squeeze is the situation when the Upper Band and Lower Band contract, and BB width is at a local minimum. In this case you shall be prepared for the high volatility after the period of low volatility. This strategy doesn’t predict direction — it prepares you for volatility.
Long setup:
Price is in long-term uptrend, you can use 200 EMA as a major trend approximation - price shall be above it.
Bollinger Bands is narrow in comparison to the previous period. Price usually is in sideways.
Open long trade when candle shows a breakout and closes above the Upper Band.
Set a trailing stop-loss at the Middle Band.
Short setup:
Price is in long-term downtrend, you can use 200 EMA as a major trend approximation - price shall be below it.
Bollinger Bands is narrow in comparison to the previous period. Price usually is in sideways.
Open short trade when candle shows a breakdown and closes below the Lower Band.
Set a trailing stop-loss at the Middle Band
📈Long Trading Strategy Example
1. Price candle shall be closed above 200-period EMA. In our example we have BITMART:BTCUSDT.P 4h time frame.
2. Bollinger Bands shall be narrow in comparison with the previous periods.
3. Open long trade when candle closes above the Upper Band.
4. Close trade when price touched the Middle Band.
📉Short trading strategy example
1. Price candle shall be closed below 200-period EMA. In our example we have BITMART:BTCUSDT.P 4h time frame.
2. Bollinger Bands shall be narrow in comparison with the previous periods.
3. Open short trade when candle closes below the Lower Band.
4. Close trade when price touched the Middle Band.
⚡️Mean Reversion (Rebound from the Bands)
This is the most common approach to use Bollinger Bands. The idea is also very simple, we just want to open long if price touches Lower Band and short if price reaches Upper Band. Price tends to revert to the mean (Middle Band), especially in range-bound markets. It's very important to trade in the direction of the major trend to reduce the probability of the large move against you.
Long setup:
Price is in long-term uptrend, you can use 200 EMA as a major trend approximation - price shall be above it.
Open long trade when price touches the Lower Band.
Set the initial stop-loss at the fixed percentage below entry price. Choose this percentage number with your personal risk/money management, you shall be comfortable to lose this amount of money in case of stop-loss hit.
If price reached Middle Band set stop-loss at breakeven.
Close trade when price reached the Upper Band.
Short setup:
Price is in long-term downtrend, you can use 200 EMA as a major trend approximation - price shall be below it.
Open short trade when price touches the Upper Band.
Set the initial stop-loss at the fixed percentage above entry price. Choose this percentage number with your personal risk/money management, you shall be comfortable to lose this amount of money in case of stop-loss hit.
If price reached Middle Band set stop-loss at breakeven.
Close trade when price reached the Lower Band.
🧪 Important: the most common approach to close trades is the Middle Band touch, this is classic mean reversion. We experimented multiple times with different approached and revealed that usually it's better to take profit at the Upper/Lower band for long/short trades and use Middle Band only for setting stop-loss at breakeven. This approach provides better risk to reward ratio.
📈Long Trading Strategy Example
1. Price candle shall be closed above 200-period EMA. In our example we have BITMART:BTCUSDT.P 4h time frame.
2. Open long trade the Lower Band.
3. Put Initial stop-loss 2% below the entry price.
4. When price reached Middle band place stop-loss at the breakeven.
5. Close long trade at the Upper Band.
📉Short trading strategy example
1. Price candle shall be closed below 200-period EMA. In our example we have BITMART:BTCUSDT.P 4h time frame.
2. Open short trade the Upper Band.
3. Put Initial stop-loss 2% above the entry price.
4. When price reached Middle band place stop-loss at the breakeven.
5. Close short trade at the Lower Band.
🧪 Important tip: notice that initial stop-loss is needed only to avoid disaster in case of price moves strongly against you. This percentage shall give enough space to avoid its reaching too often. Mean reversion strategy provides fast trades with the small average gain, so you shall maintain the high win rate (perfectly above 70%). You have to choose stop-loss based on particular asset volatility.
⚡️Combined Approach: Mean Reversion + Trend Following
Skyrexio made multiple researches about Bollinger Bands strategies and we found that we can receive better gains in combination of different approaches. Mean reversion gives you great entry with discount but you don't need to exit that early. Use the trading stop and allow to gain profit while market is moving in your direction.
This approach you can find in our advanced strategy Bollinger Bands Enhanced Strategy which we shared in 2024. Click on the link to read about it and understand how you can combine best features of this popular indicator.
📚 Conclusion
Bollinger Bands are more than just a volatility indicator — they provide a flexible framework for understanding price dynamics and market conditions. By visualizing the relationship between price and standard deviation around a moving average, traders can gain valuable insights into whether an asset is consolidating, trending, or preparing for a breakout.
The real strength of Bollinger Bands lies in their versatility. They can adapt to different trading styles — whether you’re a short-term scalper, a swing trader, or a long-term position holder. From identifying squeeze setups to riding strong trends or capturing mean reversion moves, BBs offer a strategic edge when used correctly.
However, Bollinger Bands should never be used in isolation. Like any technical tool, they work best when combined with momentum indicators like RSI or MACD, volume analysis, and price action signals. Context is key: a signal that works well in a ranging market may fail during high momentum trends.
Ultimately, Bollinger Bands help traders make more informed, disciplined decisions by clarifying where price stands relative to recent history. When paired with sound risk management and broader market awareness, they become a powerful ally in navigating market uncertainty.

BITCOIN CRASH PREDICTED! HERE’S WHAT HAPPENS NEXT! (scary)Yello Paradisers, Bitcoin crashed exactly as we predicted in the previous videos that it will happen with the highest probability.
In this video I am explaining to you what's gonna happen next.
Head and shoulders, neckline, is be breaking to the downside, we need a clear confirmation of a reclaim Our channel on high timeframe is getting breakout to the downside and confirmation was that a reclaim was already successful.
In this video I'm sharing with you Elliott Way theory on low timeframe and what needs to be done for confirmation perspective in order for us to continue to go to the downside or have a reversal to the upside.
Don't be a gambler. Don't try to get rich quick. Make sure that your trading is professionally based on proper strategies and trade tactics.

PEPE Will Turn Bullish · Strong Chart StructureThe market is one. We are all one and the same.
Crypto is one, and all the pairs move in the same way. Not in the exact same manner but the broader direction always tend to be the same.
PEPE is great because it reveals that the market isn't likely to go much lower. Since they all move together, the fact that PEPE will recover reveals that the others will recover.
PEPE grew in late 2024 together with the rest of the market. The first part of 2025 was a correction and the lows started to come-in in March and April. The first high in May, exactly the same as the rest of the market. A higher low in June and another high in July. Now a new retrace.
PEPEUSDT is trading on a very strong structure. We have a higher low from June but also from March. This makes it very unlikely that PEPE will produce a new low in this correction, which means that even now the correction is reaching its end. Volume is very low. If it isn't over then one major flash crash and the next day full green. That's how close we are from change.
Technical analysis
The market downtrend ended in March this year. From a low point PEPEUSDT switched from bearish to bullish. The trading is now happening within a bullish chart.
The main move peaked in May and the market is consolidating before additional growth. The action stays kind of sideways, mid-range, which shows that we are seeing consolidation. Consolidation always precedes a wave of growth, specially when the action is happening across marketwide support.
Namaste.

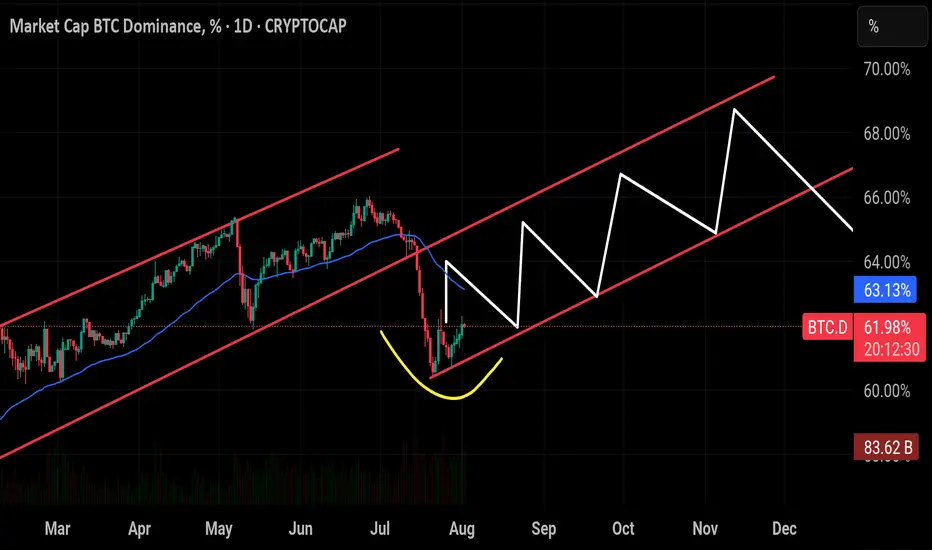
$BTC Dominance seems to be replaying its historical pattern —CRYPTOCAP:BTC Dominance seems to be replaying its historical pattern — after peaking around 66%, it’s now pulling back toward the critical 60% support zone. If the breaks below this level have triggered sharp drops toward 54%, often marking the start of strong altcoin seasons. Unless BTC.D closes back above 65%–66%, history suggests we could see another wave of altcoin outperformance in the weeks ahead. And looking at the chart structure, a breakout in BTC’s price action could align with this cycle, potentially driving Bitcoin toward a new all-time high soon.
BITCOIN Will Go Lower! Sell!
Please, check our technical outlook for BITCOIN.
Time Frame: 9h
Current Trend: Bearish
Sentiment: Overbought (based on 7-period RSI)
Forecast: Bearish
The market is trading around a solid horizontal structure 113,260.21.
The above observations make me that the market will inevitably achieve 107,826.27 level.
P.S
We determine oversold/overbought condition with RSI indicator.
When it drops below 30 - the market is considered to be oversold.
When it bounces above 70 - the market is considered to be overbought.
Disclosure: I am part of Trade Nation's Influencer program and receive a monthly fee for using their TradingView charts in my analysis.
Like and subscribe and comment my ideas if you enjoy them!

Dip before the next run? Bitcoin has recently seen a significant dip from it's all-time highs, about 7% at the time of writing. The global M2 money supply is considered a strong indicator for predicting Bitcoin's price movements. Currently, it suggests that bitcoin may continue to decline before experiencing a reversal. According to this indicator, a bullish run could begin around August 10. But of course like all indicators nothing is certain. OKX:BTCUSD
BTCUSD long setup: Targeting the next bull move.Hello IGT FOLLOWERS
Here is my BTCUSD overview, Bitcoin is showing bullish momentum after holding strong support near $112,000. A breakout above the $115000 resistance suggests buyers are regaining control. RSI is turning upward, and volume is increasing on green candles signaling demand. As long as price holds above $113,000, bulls may push toward the $117,500 target.
Key points :
Entry point : 113500
1st Target : 115000
2nd Target : 117500
Follow me for more latest updates and signals

Don’t Panic — It’s Just a Healthy Crypto Correction!While the crypto market has seen some red this week, the bigger picture remains intact. Let’s zoom out and make sense of the current correction.
🔸 TOTAL Market Cap (left chart)
The structure remains overall bullish, trading inside the red rising channel.
After a solid rally, the market is currently pulling back toward a strong demand zone – perfectly aligned with the lower trendline. This area is likely to act as a major support, from which the next bullish impulse could kick off.
🔸 USDT Dominance (right chart)
USDT.D remains overall bearish, trading inside the red falling channel.
It’s currently pushing higher toward a well-defined supply zone, which also intersects with the upper red trendline. As long as this area holds, we expect sellers to take over again — giving altcoins the space they need to bounce back.
📌 In simple terms:
The market is in a healthy correction. Don’t let short-term dips shake your long-term view. The trend is still your friend.
➡️ As always, speak with your financial advisor and do your own research before making any investment decisions.
📚 Always follow your trading plan => including entry, risk management, and trade execution.
Good luck!
All strategies are good, if managed properly.
~ Richard Nasr

Gaussian and the LMACD deep dive!As you can see LMACD is showing signs of exhaustion. Histogram has been compressing or decreasing in momentum while the price has been climbing up. This divergence wont last for too long and a change in the trend seem very likely. BTC might be entering in the bear market pretty soon and you might start seeing the histogram turning red and increasing in bearish momentum before changing the trend once we approach to the core of the Gaussian or even bellow this time. Breaking bellow the core would mean range bellow 40k as bear market bottom.
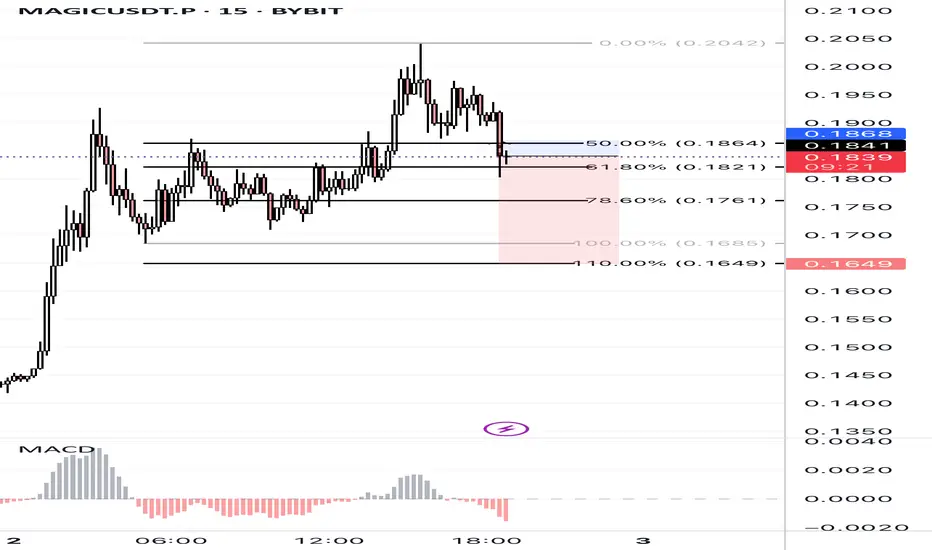
MAGICUSDT.P 15m – Short Setup at Key Fib ResistancePrice sharply rejected from the 0.2042 high and is now breaking below the 50%–61.8% Fibonacci retracement zone after a lower high. The move shows strong selling interest, aligning with MACD histogram momentum shift into the negative.
Bitcoin projection for the rest of the year. Bullish.We are in a retracement phase , i think btc will retrace deep enough to convince people that bull run is over . Once that happens it will flip to the upside and leave everyone shocked.
A retrace towards 108k-104k is possible.
Once they get tapped btc will start a new run towards a new all time high where everything will get to an end and a new besr market will start. Until then lets enjoy the rest of the year.
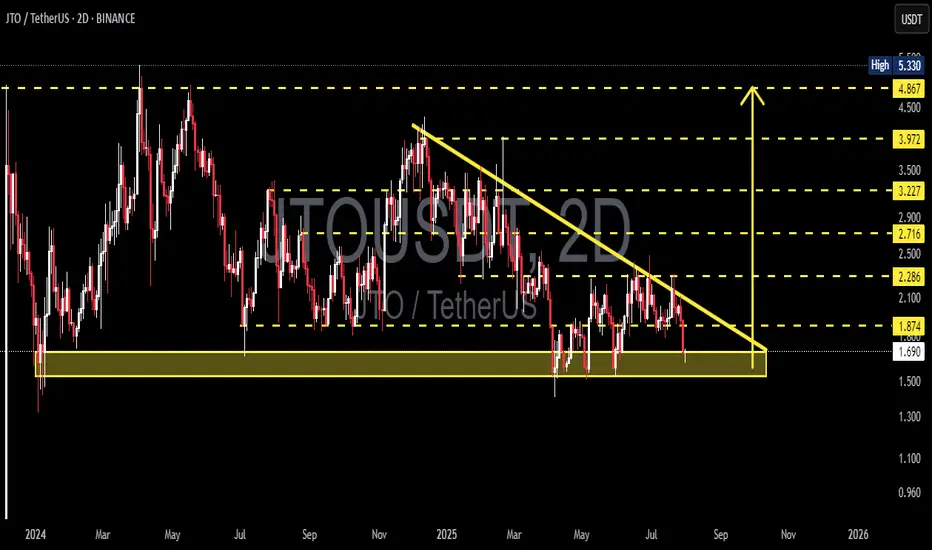
JTO/USDT at the Edge of Pressure – Breakout or Breakdown Ahead?🧠 Detailed Technical Analysis (2D Timeframe):
JTO/USDT is currently consolidating at a critical support zone within a well-defined Descending Triangle pattern that has been forming for over 6 months.
Key observations:
Price has been making lower highs, forming a downward-sloping resistance trendline.
Meanwhile, strong buying interest has held up the support zone between $1.69 and $1.87, suggesting accumulation.
This creates a classic Descending Triangle, often leading to a sharp breakout or breakdown.
---
📌 Key Levels:
Level Description
$1.69–$1.87 Major Demand Zone / Key Support
Descending Trendline Dynamic Resistance (from Lower Highs)
$2.29 First Resistance (Breakout Trigger)
$2.71 Key Mid-Term Resistance
$3.22 – $3.97 Major Upside Targets
$1.50 & $1.30 Breakdown Targets
---
📈 Bullish Scenario (Breakout):
If the price holds the support and successfully breaks the descending trendline, we could see a strong bullish reversal:
Confirmation breakout may lead to a rally toward $2.29 → $2.71 → $3.22 → up to $3.97.
Breakout strength increases if accompanied by volume surge.
Bullish Catalysts:
Positive project fundamentals.
Volume squeeze near triangle apex.
RSI/MACD divergence (if present).
---
📉 Bearish Scenario (Breakdown):
If price closes below the $1.69 zone with conviction:
Descending triangle confirms as a bearish continuation.
Target downside to $1.50 and potentially $1.30.
Could signal distribution phase by larger players.
Bearish Confirmation: Strong 2D candle close below $1.69 with high volume.
---
🧩 Pattern Breakdown – Descending Triangle:
The pattern represents price compression between lower highs and a horizontal support.
Statistically, 70% of descending triangles resolve to the downside.
However, in oversold conditions or with bullish catalysts, it may lead to a powerful short squeeze breakout.
---
🧭 Summary & Strategy Insight:
JTO/USDT is nearing a decision point. At the edge of the triangle’s apex, volatility is likely to spike — with a strong move in either direction.
💡Possible Strategy:
Conservative entry: Wait for breakout confirmation above the trendline with volume.
Aggressive entry: Speculative buy near $1.70 with tight stop loss.
Avoid heavy positions until the breakout or breakdown confirms.
---
🧲 Suggested Post Title:
> "JTO/USDT at a Crossroads – Descending Triangle Set for Explosive Move?"
A breakout is imminent. Will you be ready?
#JTOUSDT #CryptoBreakout #DescendingTriangle #AltcoinSetup #TechnicalAnalysis #CryptoStrategy #ChartPatterns
DOTUSDTThe first higher high after a downtrend indicates a potential trend reversal to the upside. It shows that buyers are starting to regain control, signaling the possibility of a new bullish trend.
Trendline Break: A break above a significant trendline further confirms the shift in sentiment from bearish to bullish. The trendline break signifies that selling pressure has weakened, and the market is poised for further upward movement.
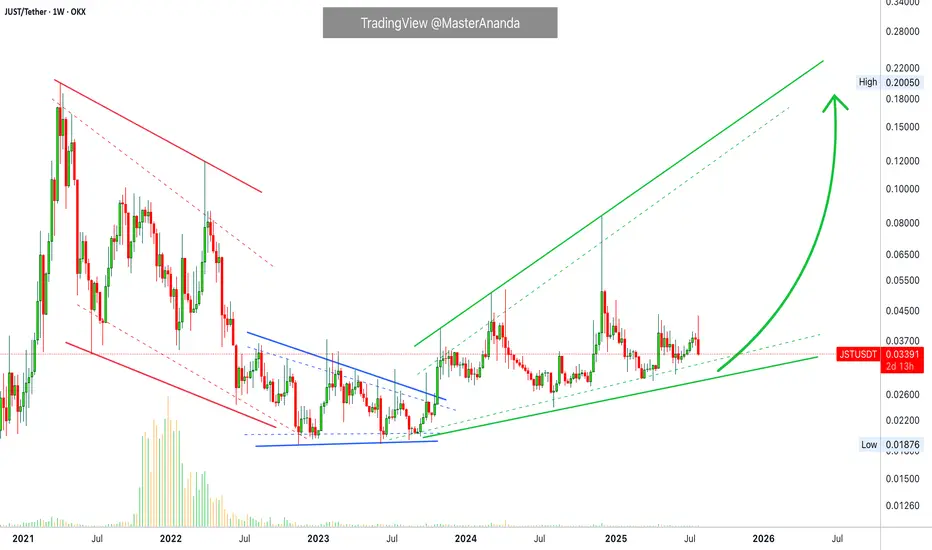
JUSDT Short-Term Retrace vs Long-Term UptrendJST is not trading at bottom prices because the low was hit November 2022, but the bigger picture still looks like a long-term consolidation pattern. Sideways for years, this precedes a major bull market.
Good morning my fellow Cryptocurrency trader, I hope you are having a wonderful day.
JSTUSDT is looking weak short-term but we know this to be part of the same process, the one that has been going on for years. Higher lows and higher highs but still no major bullish wave, it is getting closer though because the market can only consolidate for so long.
JST has been rising. The high December last year (2024) hit the highest prices since March 2022, the month when the previous bear market breakdown took place.
The red period is the bear market. Notice how it ends when the downtrend is no more and the market turns blue, sideways. After this period comes green and this is where we are now.
Within the bullish period we also have retraces and corrections. Right now we have a bearish move, short-term, within a wider bullish move, an uptrend long-term. This is the normal and classic market fluctuations; prices moving down and up, up and down, back and forth, every day.
The end of the short-term move will result in the continuation of the bigger move, the uptrend. We should expect a higher low followed by a strong higher high next. The next higher high comes in late 2025, now.
Thank you for reading.
Namaste.
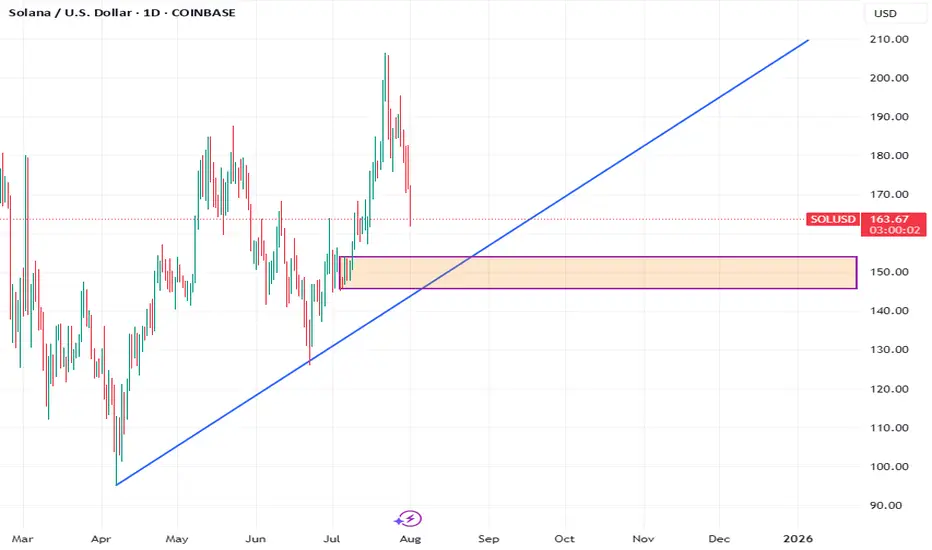
SolSolana is currently in a correction phase, and a strong demand is forming near the 151 area.
As per the rules, the market should ideally start buying from here.
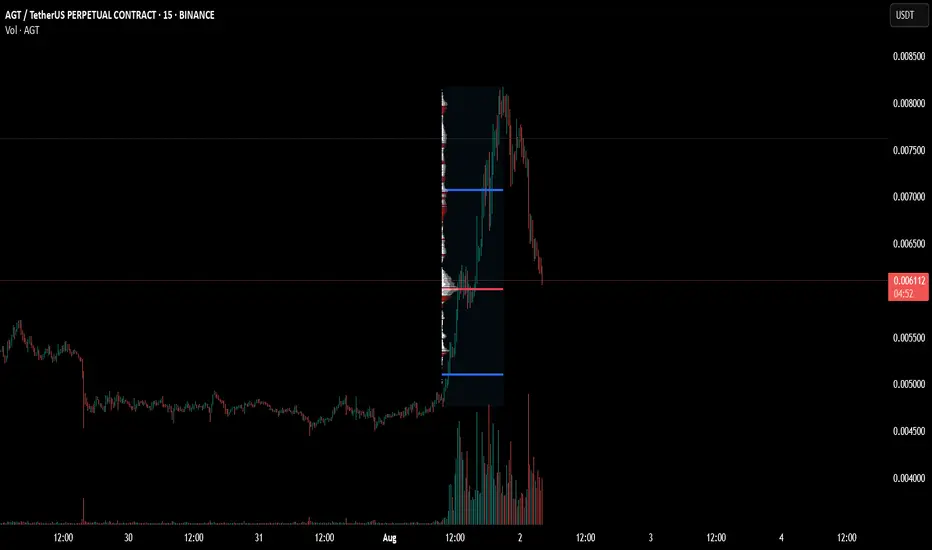
AGT Looks good hereI am long - lets follow the trend!
my chart has been "cleaned" but i have several confluences here.
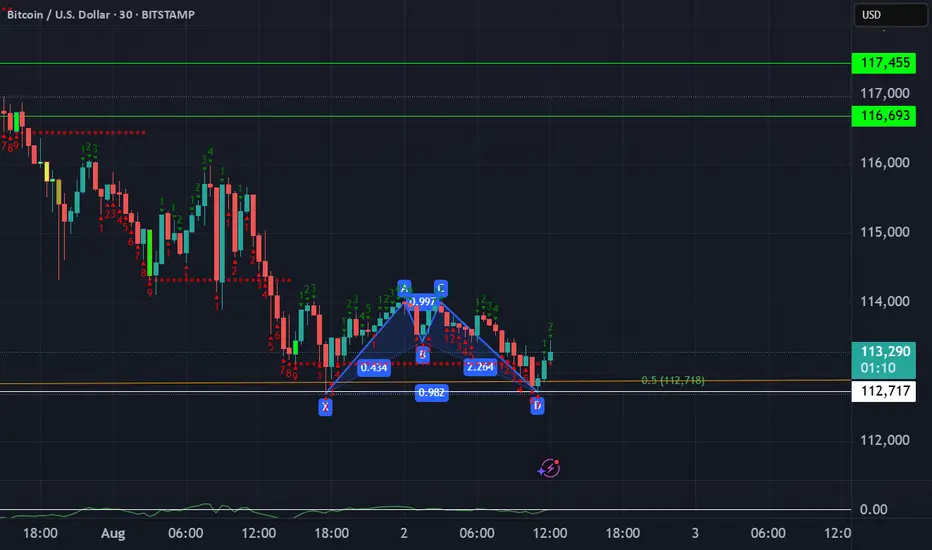
BTC Double BottomFibonacci sequence is a mathematical concept; it appears in various aspects of everyday life and nature. It's not directly used in a calculated way, but its principles are reflected in the patterns we see around us. Its key for traders to pinpoint these reversal areas to keep a positive risk/reward ratio. Bulls will target 116k if this low can be sustained.
XLM To $0.74I'm looking for XLM to continue to the downside followed by a move up. I will place a buy at the 50% fib level or in between the 50% and 61.8.
