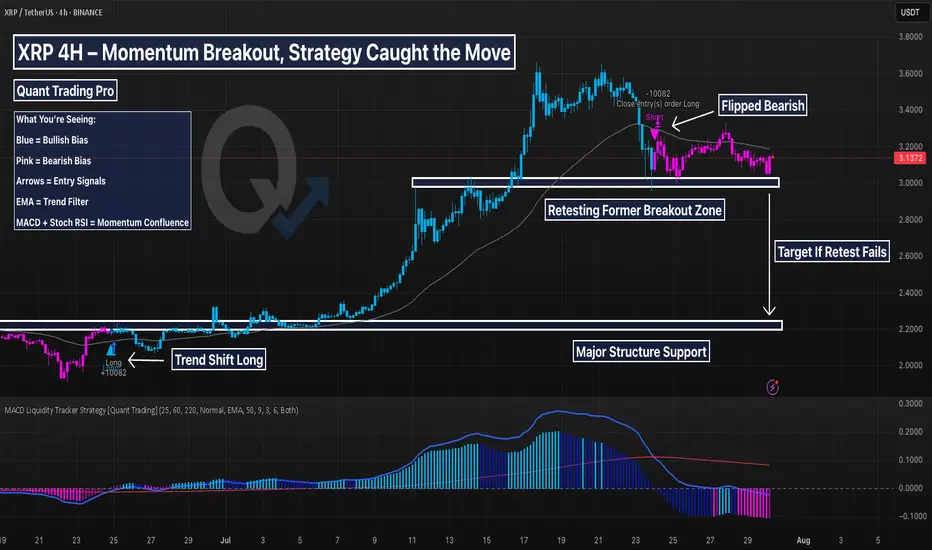
XRP 4H – This Strategy Nailed the Breakout & Tracking SupportThis XRP chart is a textbook example of the MACD Liquidity Tracker Strategy in action. After flipping bullish in late June, the system triggered a clean long and stayed in the move for over 100% before flipping bearish near the local top.
The system didn’t chase or guess — it followed clear logic:
MACD momentum confirmed
Trend aligned with EMA
State flipped blue → long triggered
Exit near top when momentum shifted
Now, XRP is in a bearish state, retesting its prior breakout zone. The MACD histogram remains below zero, and price is below the trend filter — indicating caution. But this is exactly where strategy traders prep for reversals or continuation.
🔍 Highlights:
Clean +100% trend catch
Momentum shift = smooth exit
Currently respecting support = decision zone
Still in “wait” mode — no guessing
This system shines when volatility expands. Perfect for trend traders who want clarity and control — and ideal to backtest.
Crypto market
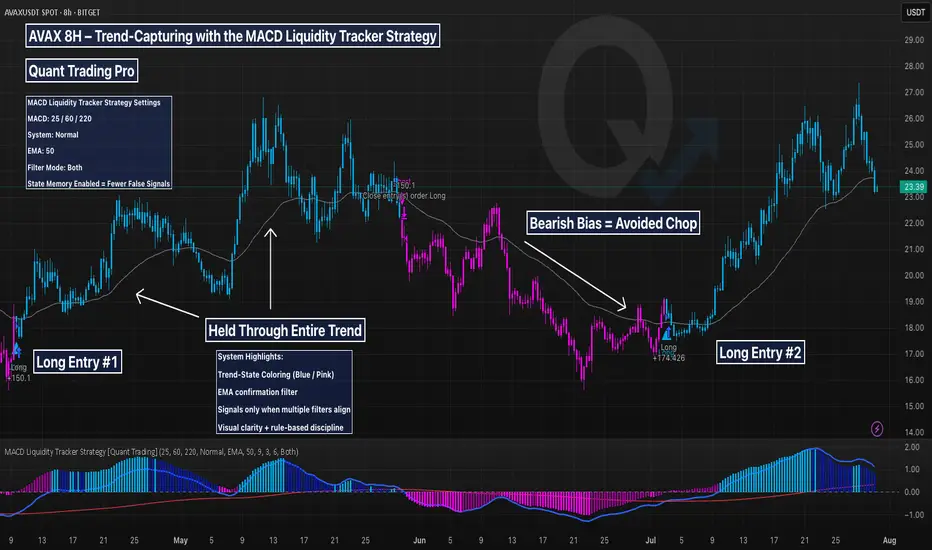
AVAX 8H – Trend-Capturing with the MACD Liquidity Tracker This AVAX 8H chart is a prime example of how the MACD Liquidity Tracker Strategy captures major trends with minimal noise. Designed for swing traders and trend followers, this system uses MACD momentum (25/60/220) and a 50-period EMA to filter entries and avoid chop.
🔍 What This Chart Shows:
A +150% long triggered in April and held cleanly through the rally
No entries during the June downtrend — thanks to bearish state filtering
A fresh +174% long in July as momentum and trend realigned
Visuals are crystal clear:
Blue candles = Bullish bias
Pink candles = Bearish bias
Arrows = Filtered entries only
MACD Histogram = Momentum strength
EMA = Trend direction
🧠 Why It Works:
Most traders struggle with second-guessing and emotional exits. This system removes the guesswork by enforcing strict momentum + trend alignment and delaying signals during unclear price action.
Ideal for crypto traders who want to follow strong trends with confidence and skip the noise in between.
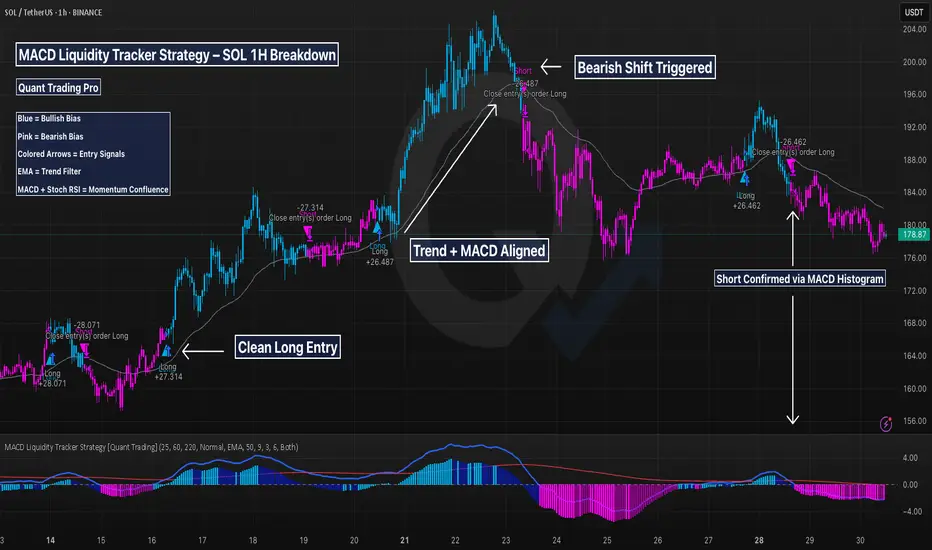
SOL 1H – How This MACD Strategy Filters Noise & Times SwingsThis chart showcases the MACD Liquidity Tracker Strategy applied to Solana’s 1H timeframe — designed to help traders capture clean trend moves while avoiding noisy whipsaws.
The system combines:
✅ MACD momentum filtering (25 / 60 / 220)
✅ 9 & 50-period moving average confirmation
✅ Stoch RSI confluence
✅ State memory logic to reduce false flips
🔍 Strategy Breakdown:
Entry Conditions:
Buys trigger when MACD histogram shifts bullish, the trend filter confirms, and momentum aligns with Stoch RSI. Shorts trigger on the inverse.
Visual Context:
Blue candles = Bullish state
Pink candles = Bearish state
Gray line = Confirmation filter (EMA)
Performance Example:
Caught two major long legs: +27.31 and +26.46
Avoided most chop through clear color-shifting logic
Recent short called the local top with MACD + trend confluence
📌 Why It Works:
The strategy focuses on structure first, signal second — letting trend context and MACD compression guide entries. Unlike traditional crossovers, this approach uses liquidity-aware thresholds to reduce noise and keep traders in the right trend longer.
🧠 Ideal For:
Swing traders on LTFs (15m–4H)
Crypto traders wanting cleaner confirmation
Anyone backtesting with QuantTradingPro or building a trend-following system
This chart shows how combining indicators into a rules-based system can help you trade with clarity — not emotion.
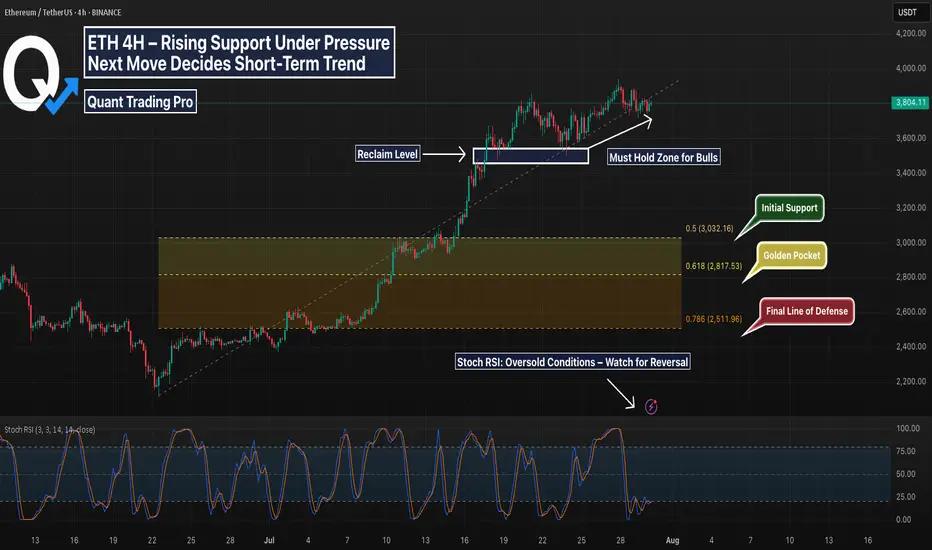
ETH 4H – Trendline Test or Trap? Golden Pocket BelowEthereum’s 4H chart shows price compressing against rising trendline support after a strong impulse move in July. While bulls have defended the key reclaim zone (white box) multiple times, momentum is fading and structure is at risk.
Price is now coiling just above the diagonal trendline — a decisive bounce here could spark continuation. However, a breakdown opens the door to deeper retracements.
Key Fib retracement levels below:
0.5 at $3,032 – Initial reaction zone
0.618 (Golden Pocket) at $2,817 – High confluence support
0.786 at $2,511 – Extreme retracement target
The Stoch RSI is deeply oversold, suggesting a bounce may be near — but confirmation is needed.
📊 Things to watch:
Reaction at trendline support
Sweep of reclaim zone followed by reclaim
Golden Pocket retest with bullish divergence
If support holds, this could be a textbook higher low. If not, expect liquidity hunts toward the fib zones. Stay nimble.
Perfect candidate for a strategy backtest or reactive plan using alerts and confirmation tools.
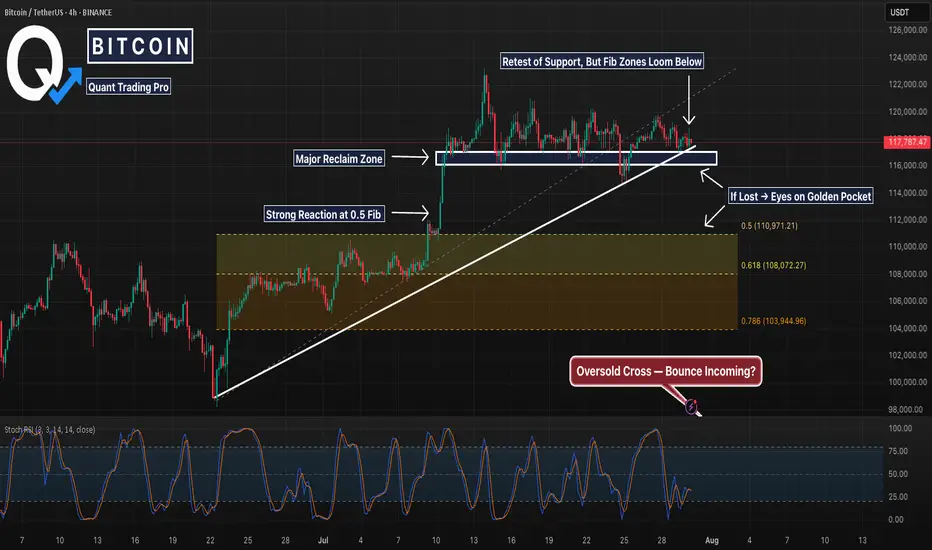
BTC 4H – Retest Holding, But Golden Pocket BelowBitcoin’s 4H chart is at a key decision point. After a strong breakout in early July, price has been consolidating just above the prior resistance zone — now acting as support. This white box represents a major reclaim level that has held multiple times, but buyers are starting to look fatigued.
Below this support lies a clean Fibonacci retracement zone:
0.5 at 110,971
0.618 (Golden Pocket) at 108,072
0.786 deeper pullback at 103,945
The structure remains intact for now, but a loss of the current level could trigger a deeper sweep into one of these fib levels — especially with momentum (Stoch RSI) resetting from oversold.
A potential bounce here keeps the uptrend alive. However, if the zone breaks, the .618 area may be the magnet.
📊 Watching for:
Strong reaction or absorption at this support
Bullish divergence forming
Sweep into golden pocket followed by reversal structure
This setup blends price action, key S/R levels, and Fib confluence — a great chart for anticipating the next move, not reacting to the last one.
TOTAL31 more day
Of nothing crazy happens
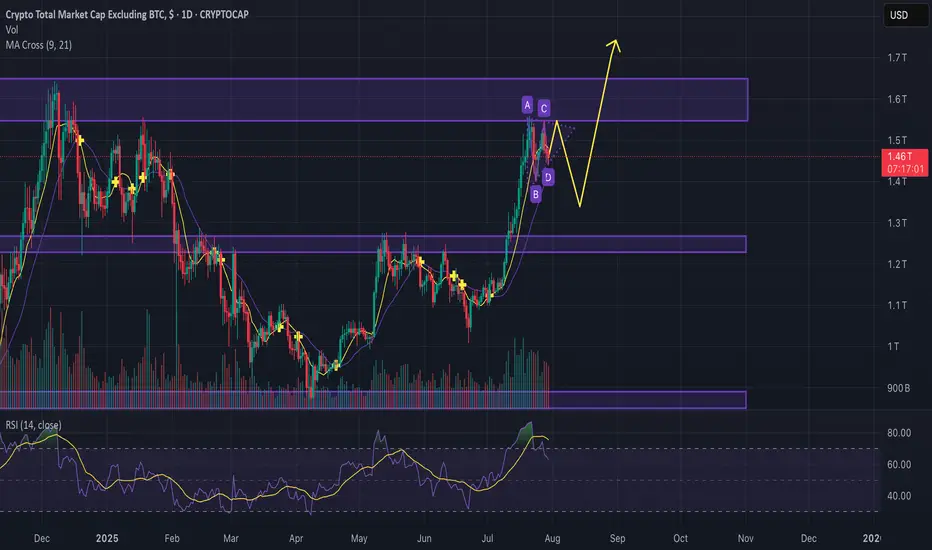
I believe the next 3 months will catch many off guard that’s looking for a bullish Q4
Alts only need 30-90days

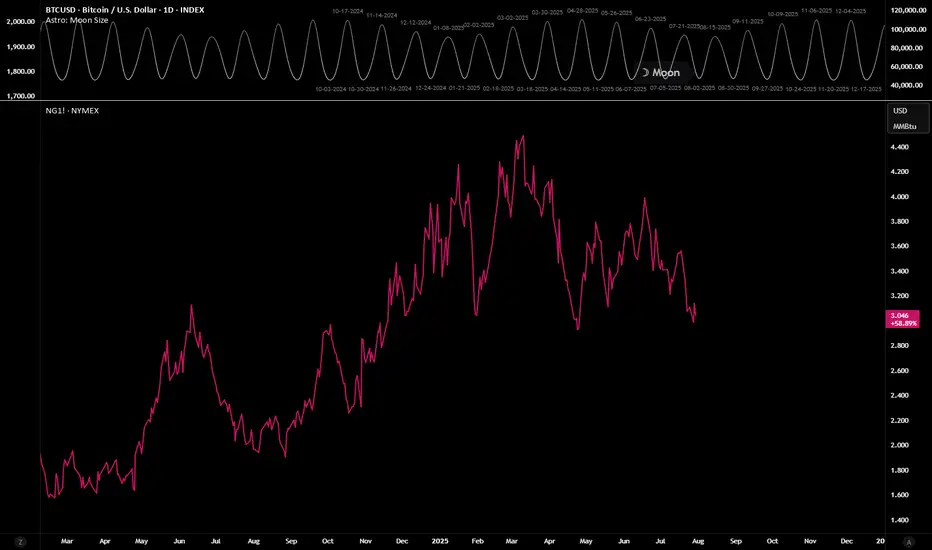
Using Astro: indicators on non-24/7 chartsWhen loading AstroLib powered Astro: indicators on non-24/7 assets like NatGas, you may notice the indicator has gaps and the plots are not smooth. A simple workaround is to pull up a BTC chart, load the indicator, merge the two panes, hide the BTC plots, and then compare the non-24/7 asset in another pane. The chart for this TradingView Idea is a template that can be used for this workaround. Just click "Grab this chart" above to make your own working copy.
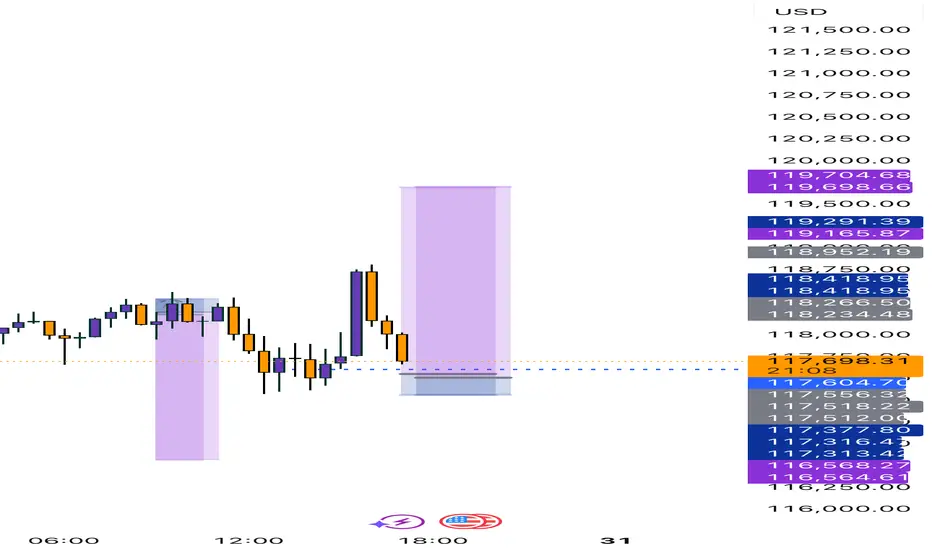
BTC FOMCOnce Again Ive the same view on BTC
There is a chance that it will go down now towards 113.500 straight so the internal buy towards 122.600 should be taken with low risk
if that level is reached the sell to 113.500 is prettyu much asured and also on 113.500 the buy to all time highs 127.500 and 133.000
GG

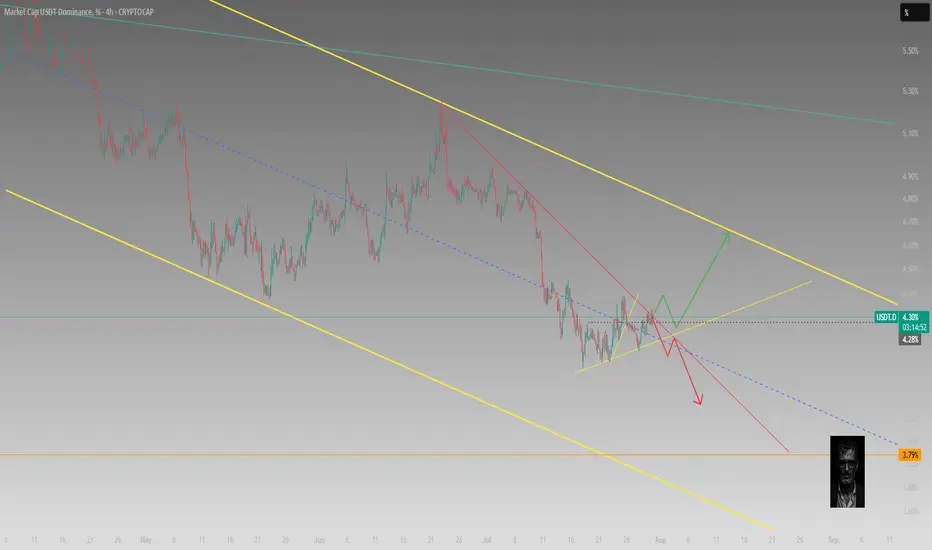
Is altcoin season over before it even started?Guys,
Gonna break down the situation on the chart to see where we can go next with the altcoins.
We see the key resistance levels and now we moving in kinda bullish pennant, but considering descending volumes we can easily test the support line and go back to the 1.25T. (maybe even lower)
After that, seems like we can try to go back and break the 1.64T resistance zone and previous ATH.
Anyway current market is going to be way more different from previous cycles, because huge institutions can feel nice only in hyper volatile, so divide your strategy between short, mid and long term investments to take profits.
Good trades and share your thoughts down to see what others think.
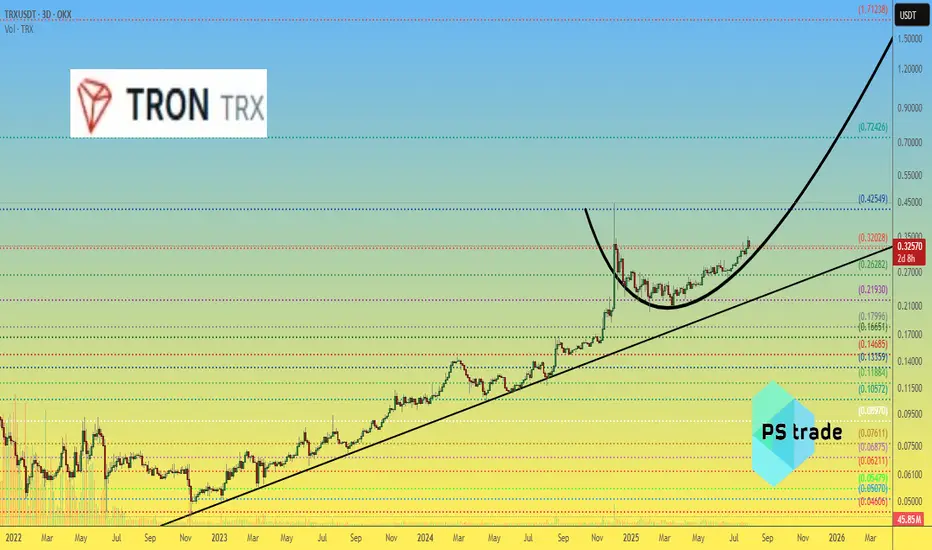
$TRX — "The Samurai Path" of Crypto? Long-term TRON outlook In a market where coins spike and crash from every tweet, CRYPTOCAP:TRX behaves like a stoic monk.
The price of OKX:TRXUSDT moves steadily, avoiding wild dumps and pumps — as if it exists in a parallel reality.
Now consider two events that would usually explode any altcoin’s chart — but not CRYPTOCAP:TRX :
📅 July 24 — Justin Sun’s TRON Inc gets listed on NASDAQ.
📅 July 28 — TRON Inc announces plans to raise $1B to buy back CRYPTOCAP:TRX and hold it on their balance sheet.
🔍 And yet… the chart remains calm. No hysteria. No euphoria.
Why?
Either CRYPTOCAP:TRX is so predictable that all news is already priced in —
or we simply don’t fully understand the inner mechanics of this ecosystem.
🧭 We call this "The Samurai Path":
Silent. Stable. Emotionless. But with serious long-term potential.
On the chart, we outlined how OKX:TRXUSDT has been moving — and what we expect next.
Because a market cap of $31B is already massive.
But $161B? That’s a statement...
📊 Can #TRON become the next “stable giant” of crypto — or will it surge when no one expects?
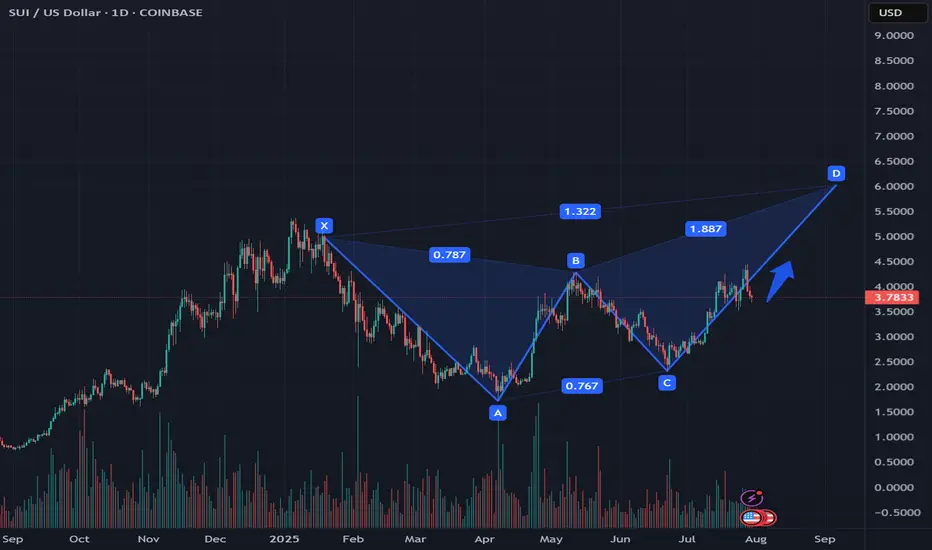
SUI Completes Butterfly Pattern: Possible Bullish Continuation According to the previous analysis, SUI successfully completed the butterfly pattern.
According to the pattern, an upward movement is expected to the nearest $3.95 zone and possibly $4.1
Also, according to the pattern, a rollback to the $3.3 zone is unlikely
This analysis is based on the technical pattern and also incorporates AI to provide more accurate results.
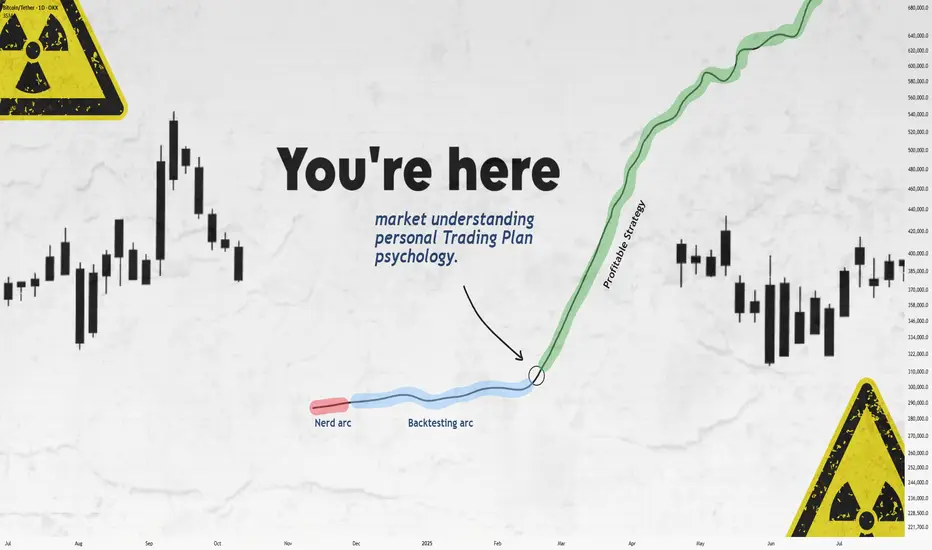
Still Losing After Backtesting? This Fixed It.Let’s get straight to it.
If you’ve gone through the "nerd arc" and the "backtesting arc" but still aren’t profitable...
What’s the fix?
In this short write-up, I’ll walk you through 3 brutal truths that made me finally see green.
Is it hard?
UH—Damn right.
But let’s go 👇
1. Market Understanding
This isn’t something you "learn" from a course.
It’s something that clicks after dozens of stop losses and live trades.
Here are a few ways I got more comfortable with it:
1. Don’t fear opening trades or hitting stop loss.
Each trade gives you data. More trades = more experience = better market feel.
What’s the requirement? Capital and risk management. Without that, you won’t even survive long enough to "get" it.
2. Journaling every single trade.
Write everything: your thoughts, screenshots, feelings — before and after.
Too lazy to do it? Left trading. Simple.
3. Be the detective.
Read the chart like a story. No, seriously.
Think of Bitcoin as a character with real moods.
Every candle tells you something.
That 5% pump? Buyers pushing up. Then bears smacked it down — candle closed red.
Now price is bleeding again.
Why?
🔍 Be the detective.
4. Analyze the market every day — even without trading.
The more you observe, the more you see. Structures. Patterns. Behavior.
Easy? Nah.
It takes discipline — like posting one story text to Insta for 1,000 days straight. Still wanna try?
2. Personal Trading Plan
Remember how I said "don’t fear opening trades"?
Well — after you’ve opened a bunch, you can start tailoring your own trading plan based on you.
This isn’t a PDF you can steal off Google.
Only after seeing how you behave in trades, you’ll know what rules make sense.
Maybe:
"I don’t trade when I’m emotionally off."
"This setup gave me the best results over 100 trades."
Just don’t copy-paste someone else’s rules.
Make a flexible structure, then let the details emerge from the market and your own experience.
Now —
Take a deep breath.
When was the last time you enjoyed your coffee?
More than a day ago?
Go make one now.
Might not get to taste it tomorrow.
Not everything in life is trading :)
3. Psychology
Ah, the final boss.
Still my weakest area, honestly.
But here are a few real things that helped:
Tip 1: WRITE.
Just write whatever you feel.
Telegram saved messages? Notebook?
Or if you're like me (🧠nerd), Notion.
Do it for 60 days straight — then feed that journal to ChatGPT and analyze yourself.
Takes time, but the patterns you'll see are... magical.
Tip 2: Money & Risk Management.
When you know your stop loss means only -0.25% of your capital…
why should you panic?
For me:
I place the SL, set a TP alert, and leave the screen.
No emotions, no fear.
Why? Because when capital is protected, so is my psychology.
Truth is, trading emotions aren’t just during the trade — they live in your head all day.
When your mental energy’s drained?
You’ll miss A+ setups.
Fall for BS ones.
Lose focus.
It’s complicated.
Because humans are complicated.
Our brains are the most tangled system known.
And somehow, out of all that noise, consciousness emerges.
A miracle.
So don’t expect to always feel calm.
Just aim to get better.
That’s it.
Thanks for sticking around.
These are just my thoughts, from one tired trader to another 🧠
I’m no expert—just sharing what’s worked (and what hasn’t).
If it helped, a boost would mean a lot.
🚫 Don’t FOMO
✅ Manage your capital
Until tomorrow —
Peace out. ✌️
BONK | Waiting for DemandNo position yet—alerts are set for the FVG and HTF demand zone below. DOGE/BONK still showing relative strength, so patience here is warranted.
Plan:
Wait for price to tag HTF area of interest (FVG/demand).
Look for LTF trigger for a long entry.
Prefer clean sweep/reclaim for confirmation.
Reasoning:
BONK has strong momentum, but entry here is late after an extended run.
Letting the setup come to me reduces risk of getting caught in a local top.
DOGE/BONK relative strength signals not to rush.

Mistake learnedIf it doesn’t break inside the timing window then it is not worth trying, it will go sideways all day or reverse
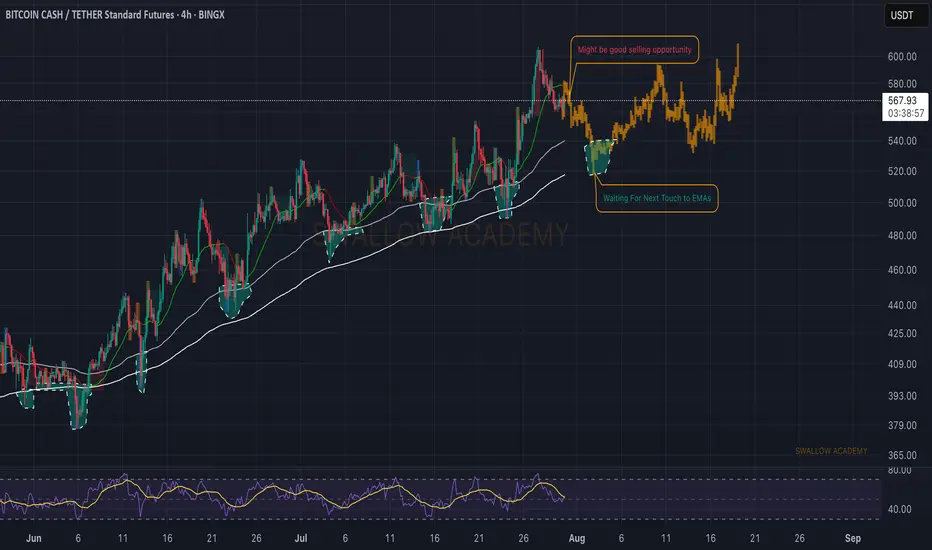
Bitcoin Cash (BCH): Looking For Touch To 200EMABCH looks overbought to us, and where we are now, we are looking for another touch to that 200 EMA, which would give us another good opportunity for long, so the plan is simple and that's what we are looking for.
Repeat of history, as they say!
Swallow Academy
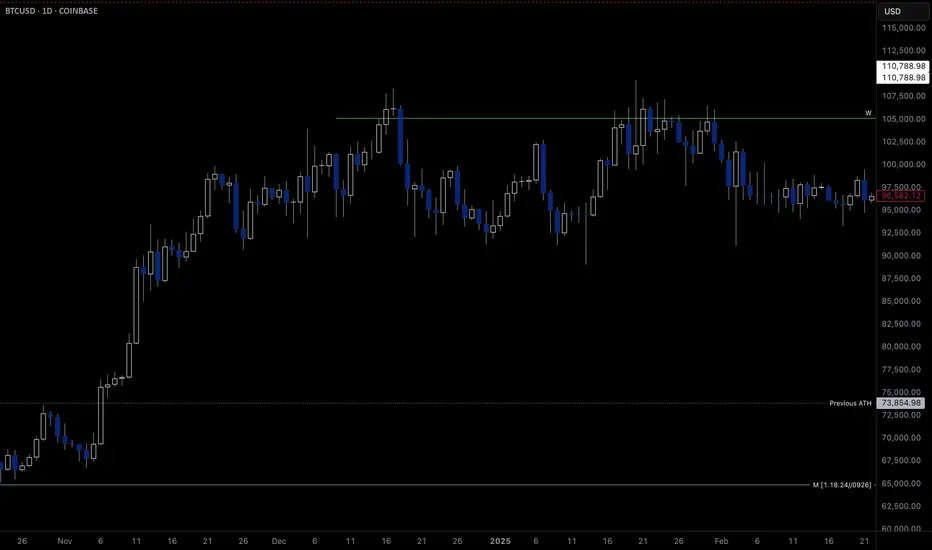
BTC-M2 / Cycle End?Do you see what I am seeing? It appears that M2 is significantly dipping at the end of September. I'd bet my BTC that will be the cycle ending. Remain vigilant!

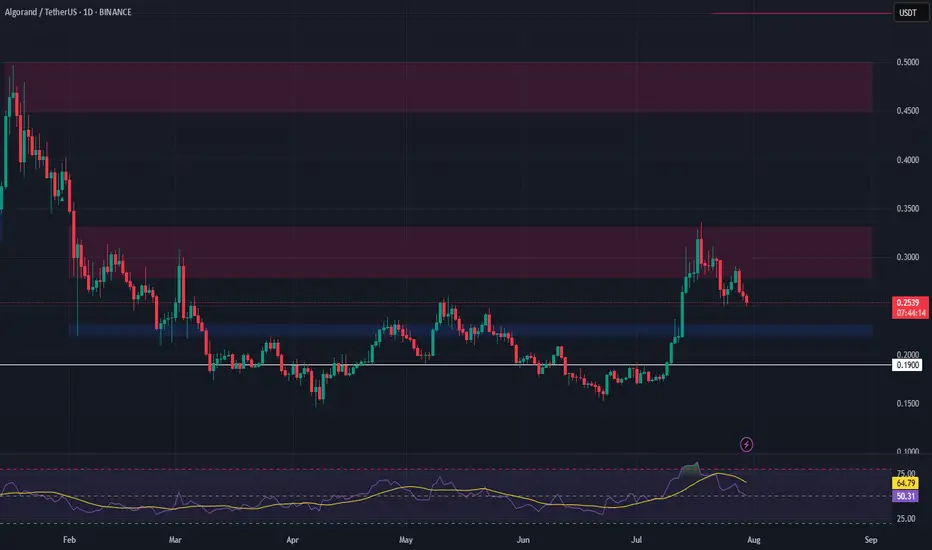
ALGO Swing Trade – Waiting for Pullback to Key SupportAfter a 100%+ surge, ALGO is now retracing and approaching a critical support zone. A dip into this area could offer a strong entry for the next leg higher.
📌 Trade Setup:
• Entry Zone: $0.22 – $0.23
• Take Profit Targets:
o 🥇 $0.28 – $0.33
o 🥈 $0.45 – $0.50
• Stop Loss: Just below $0.19
3 Key Catalysts Driving the Next ETH Bull Run
A remarkable confluence of powerful market forces is brewing in the Ethereum ecosystem, fueling increasingly bold outlooks for its future valuation. A potent combination of historical price patterns, dramatic supply dynamics, soaring institutional interest, and resilient price action is painting a picture of a digital asset potentially on the verge of a historic expansion. While a target of $20,000 may seem audacious, a granular look at the underlying mechanics reveals a compelling, multi-faceted argument for a significant upward repricing of Ethereum (ETH).
This deep dive will explore the four key pillars supporting this optimistic outlook: a striking historical price pattern that mirrors Bitcoin’s monumental 2021 surge, a critical supply shock evidenced by a mass exodus of ETH from exchanges, record-breaking institutional engagement in the futures market, and a tenacious price strength holding firm at key technical levels.
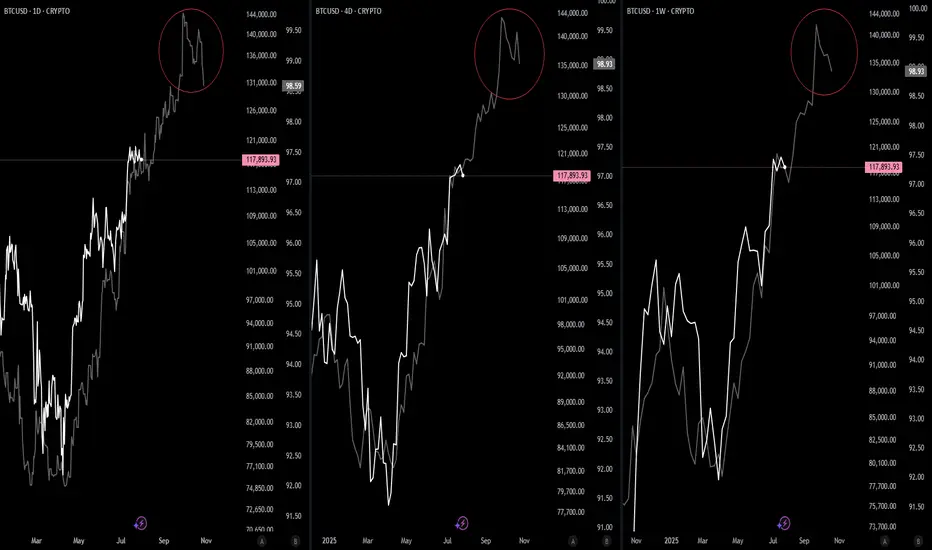
Chapter 1: The Bitcoin Fractal: Is History Rhyming?
In financial markets, history rarely repeats itself exactly, but its patterns often rhyme. Market analysts are increasingly pointing to a "fractal"—a recurring geometric pattern in price action—that suggests Ethereum's current market structure is eerily echoing that of Bitcoin's in late 2020, just before its parabolic surge in 2021.
This analysis highlights that Ethereum's chart is displaying a nearly identical pattern of accumulation, re-accumulation, and price compression that Bitcoin exhibited before its own historic breakout. During that period, Bitcoin experienced a multi-fold increase in value, shattering previous records. The parallel suggests that, much like Bitcoin did, Ethereum has emerged from a prolonged consolidation phase and is now pressing against a long-term downtrend resistance line that has defined its market structure for several years.
Should this fractal play out as it did for Bitcoin, a decisive breakout above this critical resistance could trigger a rapid, exponential move upwards. The potential for such a climb is being fueled by a perfect storm of institutional adoption and favorable market shifts.
A critical catalyst underpinning this parallel is the recent launch and explosive growth of spot Ethereum Exchange-Traded Funds (ETFs). The 2021 Bitcoin bull run was significantly propelled by growing institutional legitimacy and new, regulated investment vehicles. Similarly, Ethereum ETFs are now providing a secure and accessible gateway for a fresh wave of institutional capital. These funds have already seen staggering net inflows, with major asset management firms accumulating billions in assets, signaling deep conviction from the titans of traditional finance. This institutional stamp of approval is a powerful parallel to the forces that drove Bitcoin's last major cycle, providing the foundational capital flows needed for a sustained rally.
Chapter 2: The Great Supply Squeeze: A Mass ETH Exodus from Exchanges
One of the most compelling bullish arguments for Ethereum is rooted in fundamental on-chain economics: a dramatic and accelerating supply squeeze. The "Exchange Reserve," a metric that tracks the total amount of ETH held in the wallets of centralized exchanges, has plummeted at an astonishing rate.
In a recent one-month period alone, well over one million ETH were withdrawn from these platforms. This mass exodus of coins is a profoundly bullish indicator. When investors move their assets off exchanges, it typically signals an intention to hold for the long term in self-custodial wallets, rather than keeping them liquid and ready for a quick sale. This behavior drastically reduces the immediately available supply on the open market. Consequently, even a steady level of demand can exert significant upward pressure on the price.
This trend has pushed the total supply of Ethereum on exchanges down to its lowest level in nearly a decade. The drivers behind these massive withdrawals are multifaceted and all point toward a tightening market:
• Long-Term Conviction and Staking: A growing number of investors are locking up their ETH in staking contracts to help secure the network and earn passive yield. Others are simply moving their holdings to secure "cold storage" with a long-term investment horizon, effectively taking them off the market for the foreseeable future.
• DeFi Integration: A significant and growing portion of ETH is used as the primary form of collateral within the sprawling Decentralized Finance (DeFi) ecosystem, where it is locked into smart contracts for lending, borrowing, and other financial applications.
• ETF Accumulation: The newly launched spot ETFs are required to purchase and hold real ETH to back their shares. This direct accumulation removes vast quantities of ETH from the circulating supply that would otherwise be available to retail and institutional buyers.
This fundamental imbalance between a shrinking available supply and growing demand is creating the perfect conditions for a potential "supply shock." The sustained decline in exchange reserves, even as prices have rallied, reinforces the idea that current holders are not rushing to take profits. This indicates a strong belief in future price appreciation and adds a powerful layer of underlying support to Ethereum's macro bullish structure.
Chapter 3: The Wall of Institutional Money: Futures and Open Interest Soar
The derivatives market, often seen as the playground for more sophisticated and institutional investors, is flashing its own set of glaringly bullish signals. Open Interest (OI) in Ethereum futures—representing the total value of all outstanding futures contracts that have not been settled—has surged to unprecedented levels.
On major regulated exchanges favored by institutional investors, Ethereum futures Open Interest has recently shattered all-time highs. This represents a massive and undeniable increase in institutional participation, as asset managers, hedge funds, and other large-scale players use these regulated products to gain exposure to ETH's potential upside and to manage their risk. This is not an isolated phenomenon; across the global landscape of exchanges, the total Open Interest for Ethereum futures has climbed to record-breaking heights.
Rising Open Interest that occurs in tandem with a rising price is a classic technical confirmation of a strong and healthy trend. It demonstrates that new money is actively flowing into the market, with participants expressing confidence in future price appreciation. This influx of capital adds significant fuel to the ongoing rally. The surge in derivatives activity highlights a maturation of the market, where both institutional and retail investors are increasingly using sophisticated financial instruments to speculate on Ethereum's price trajectory.
While the high levels of leverage inherent in futures trading can introduce volatility and the risk of cascading liquidations, the primary signal is one of immense and growing institutional conviction in Ethereum's medium-to-long-term outlook. The influx of capital into both spot ETFs and the futures market creates a powerful, self-reinforcing feedback loop, enhancing liquidity, legitimizing the asset class, and attracting even more conservative capital off the sidelines.
Chapter 4: The Immediate Battleground: Price Action Shows Resilient Strength
Zooming in from the macro-outlook to the short-term technical picture, Ethereum's price action has demonstrated notable resilience, reinforcing the broader bullish thesis. After a strong rally, the price has been consolidating its gains, establishing critical support zones that traders and algorithms are watching with keen interest.
Recent price action shows Ethereum starting a fresh increase above the $3,820 and $3,880 levels. The price is trading near the crucial $3,800 mark and the 100-hourly Simple Moving Average, an indicator that often acts as a dynamic line of support during uptrends. Although there was a brief break below a key bullish trend line that had formed with support at $3,800 on the hourly chart, the ability of the price to remain supported above the broader $3,720 zone is considered vital for a bullish continuation. Should the pair remain supported above this zone in the near term, it could start a fresh increase.
The price has recently faced resistance near the $3,900 and $3,920 levels. The psychological $4,000 barrier remains the next major target. A decisive and sustained break above the $4,000 mark could open the door for a rapid advance, as it would clear the last major resistance area before a potential retest of previous all-time highs.
Technical indicators on higher timeframes remain robust. The price is in a clear long-term uptrend, trading well above its key daily moving averages. While short-term indicators may show temporary overbought conditions or moments of waning momentum, the overall market structure remains decisively bullish as long as critical support levels continue to hold.
Conclusion: A Compelling Case for a New Era of Price Discovery
The prospect of Ethereum reaching a valuation of $20,000 is a monumental forecast, but it is one built on a solid and multi-faceted foundation. The convergence of a compelling historical fractal mirroring Bitcoin's most famous bull run, a verifiable and intensifying supply shock, unprecedented institutional adoption via both spot ETFs and futures markets, and a resilient technical posture creates a powerful case for a sustained bullish continuation.
Each pillar of this argument reinforces the others. Institutional inflows from ETFs directly contribute to the supply squeeze on exchanges. The resulting upward price pressure attracts more speculative interest in the futures market, and the resilient technical picture provides the stable base from which a larger market move can be launched. While no outcome in financial markets is ever guaranteed, and the risks of volatility and sharp corrections remain ever-present, the confluence of these potent factors suggests that Ethereum may not just be knocking on the door of its old all-time high, but preparing to smash through it and enter a new and explosive era of price discovery.

Ethereum Analysis – July 30, 2025📊 Ethereum Analysis – July 30, 2025
Ethereum is currently testing a key descending trendline (blue line).
If the price breaks above this resistance and confirms with strong candlestick closures, there's a high probability that ETH will rally toward the ascending red trendline, acting as the next dynamic resistance.
🚀 A confirmed breakout could trigger a bullish continuation, opening the door for higher targets in the short term.
However, failure to hold above this level may result in a pullback or range-bound movement.
📌 Keep both the blue and red trendlines on your chart — they’re currently the most critical zones to watch for potential entries or exits.