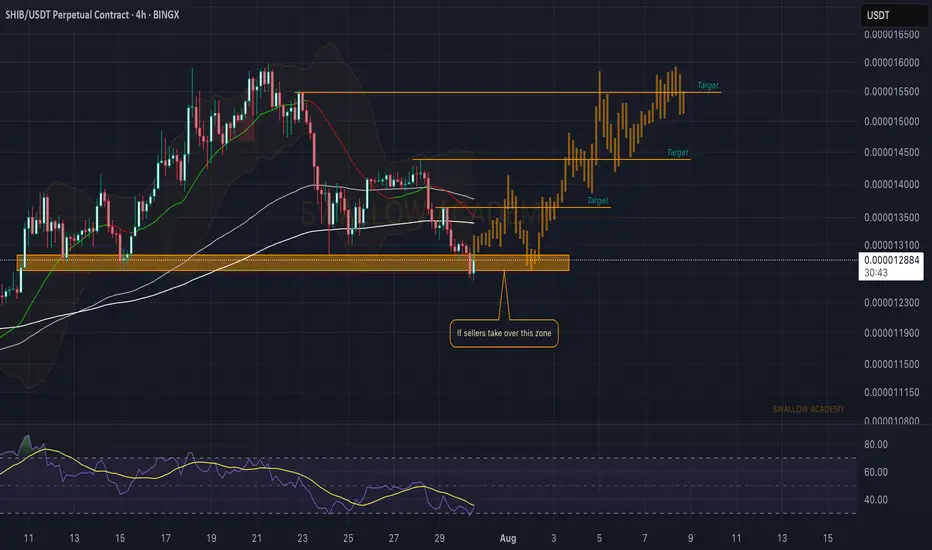
Shiba Inu (SHIB): Might Bounce From Here | Looking For PumpShiba is showing some signs of recovery, where we are seeing the buyers taking back the control near the local support zone, which would then lead to a 10% movement to upper zones (if not more).
So we look for more clarity and dominance from buyers here and once we see it, we are going to go long.
Swallow Academy
Crypto market
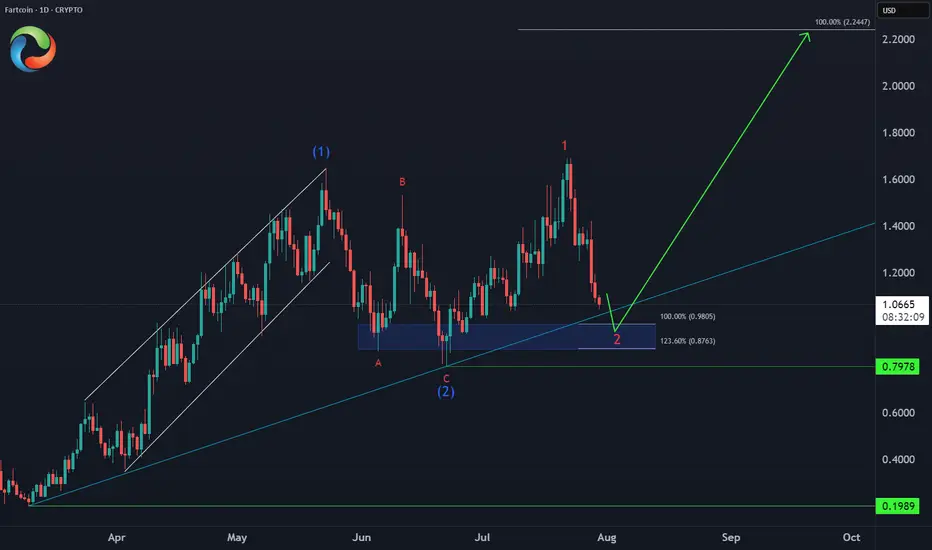
FARTCOIN Bullish Setup 📈 CRYPTO:FARTCOINUSD Entering an extreme buying area:
✅ Key support zone: $0.98-$0.87 (April trendline + equal legs)
⛔ Invalidation: $0.79
🎯 Target: $2.20 (124% upside)
This is how explosive meme setups look before liftoff.
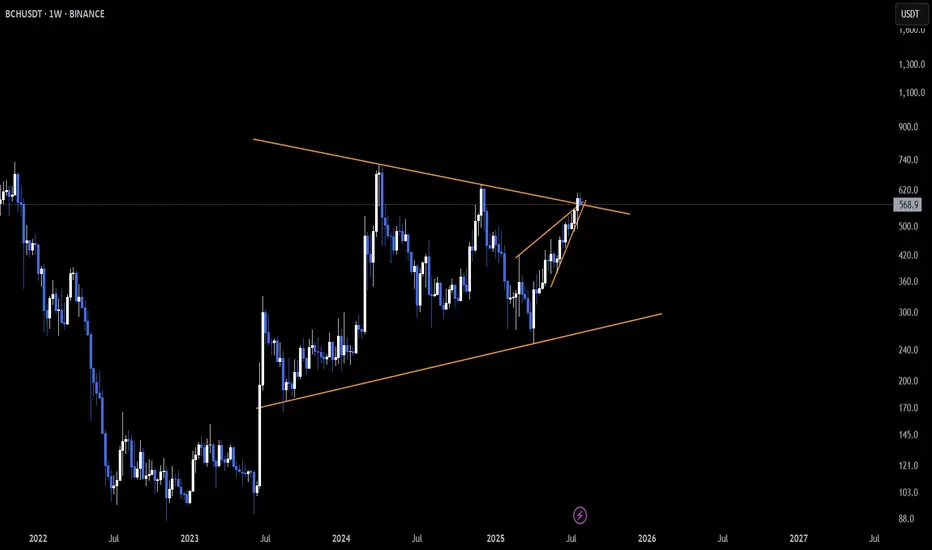
BCH Lights Up Across Multiple Timeframes A Breakout Sequence 🚨 SET:BCH is unleashing strength across all major timeframes—and it’s not subtle.
📆 Daily: Defying the norm by breaking up from a rising wedge 📈
🗓️ 3-Day: Clean breakout above a descending trendline—momentum building 🔓
📅 Weekly: Exploding out of a long-standing pennant formation 🚩
This isn’t just another pump—it’s a multi-timeframe alignment, one of the strongest confirmation signals for technical traders. Price is currently in retest mode, and if support holds, the rally could accelerate fast ⚡
🧠 Grok Insights: Breakouts confirmed on 3+ timeframes see 2.6x higher continuation probability within the next 5–10 candles. BCH’s structure hits that mark.
👀 High-alert zone — this setup is rare, clean, and potentially explosive.
Do you see continuation from here, or is this a bull trap in disguise? Let’s talk.
Not financial advice.

Etherum turns 10 in Style after the previous year of etherum struggling there is new hopes of etherum hitting new higher high. these is due to VP of the USA Vence once again showing confidence in Bitcoin.

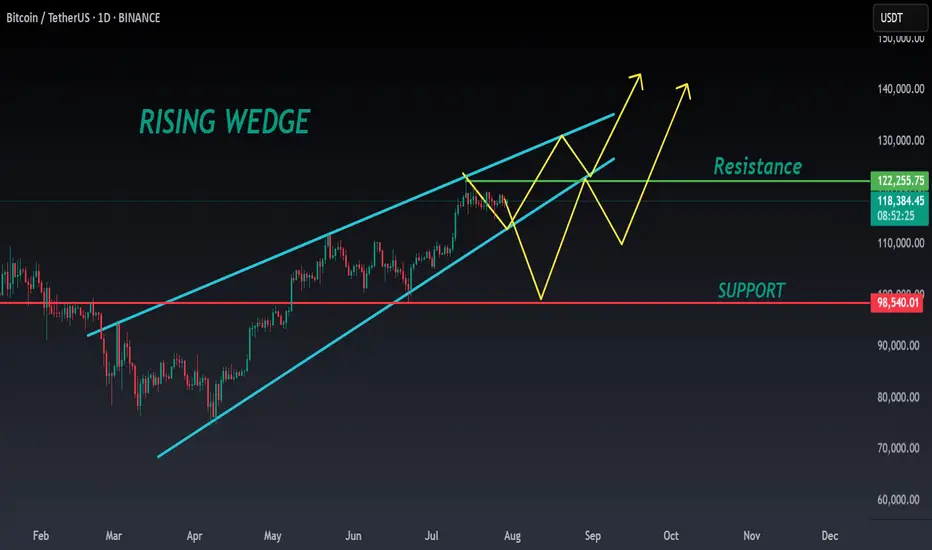
BTC ANALYSIS🔮 #BTC Analysis 💰💰
🌟🚀As we said #BTC performed same. Now, In daily chart we can see a formation "Rising Wedge Pattern in #BTC. There is a strong resistance zone and we could see a rejection from that level but if the price breaks the resistance zone then we would see a bullish move 💲💲
🔖 Current Price: $1,18,590
⁉️ What to do?
- We have marked some crucial levels in the chart. We can trade according to the chart and make some profits in #BTC. 🚀💸
#BTC #Cryptocurrency #DYOR #PotentialBreakout
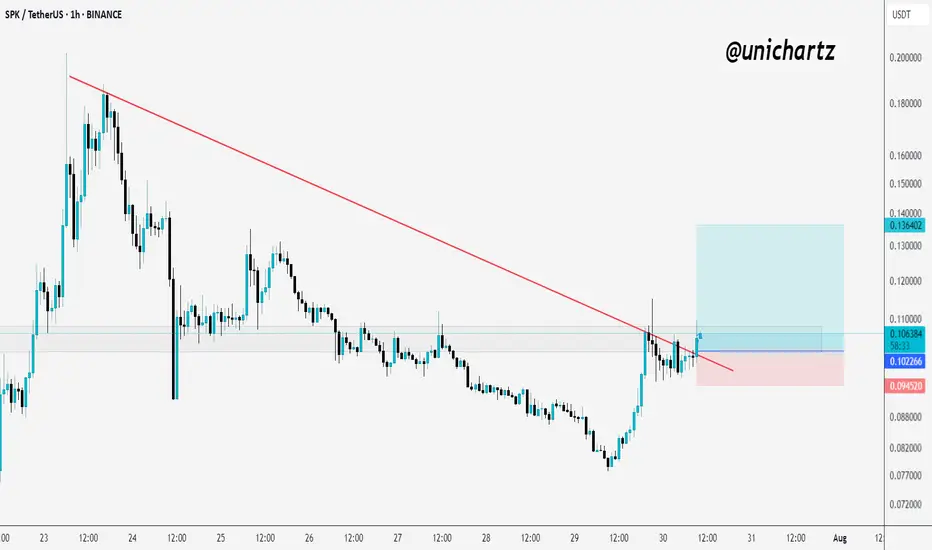
SPK Breaks Trendline – Long Setup with R:R 5.7INDEX:SPK Breaking the Downtrend – Long Setup in Play
SPK has finally broken out of its falling trendline after days of compression. Price is now testing the breakout zone with a small consolidation — a classic sign of strength building.
If momentum continues, we could see a solid upside push.
✅Trade Setup (Long):
Entry: 0.1009
Stop Loss: 0.0945
Target (TP1): 0.1364
DYOR, NFA
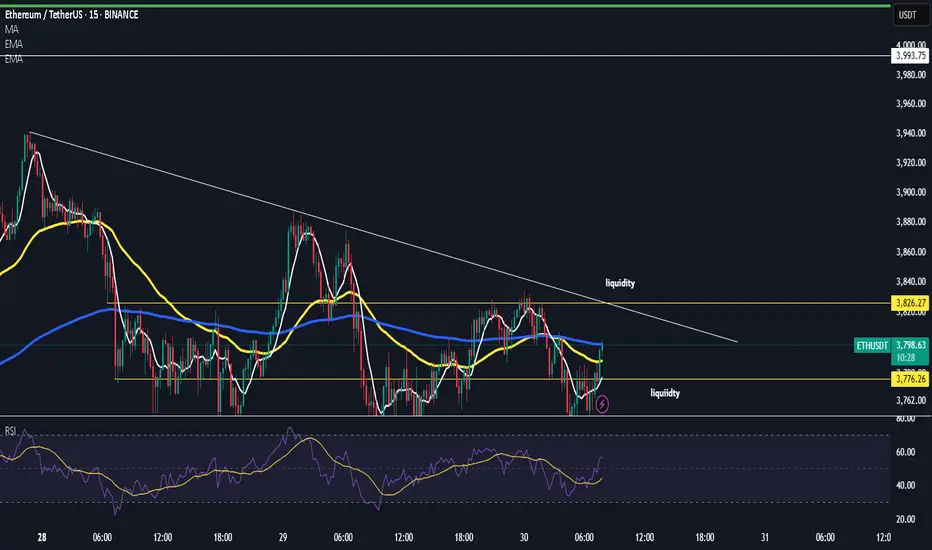
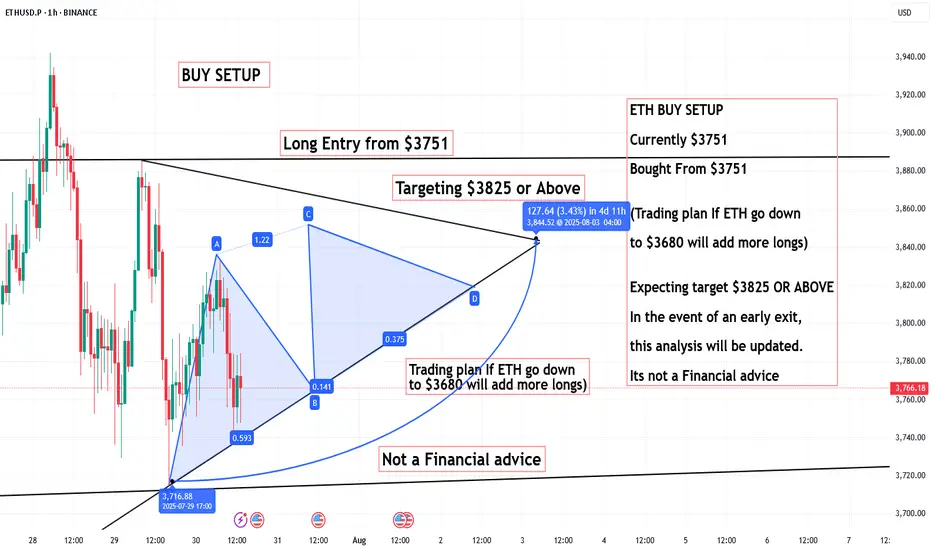
ETH BUY SETUP, Bought From $3751ETH BUY SETUP
Currently $3751
Bought From $3751
(Trading plan If ETH go down ,
to $3680 will add more longs)
Expecting target $3825 OR ABOVE
In the event of an early exit,
this analysis will be updated.
Its not a Financial advice
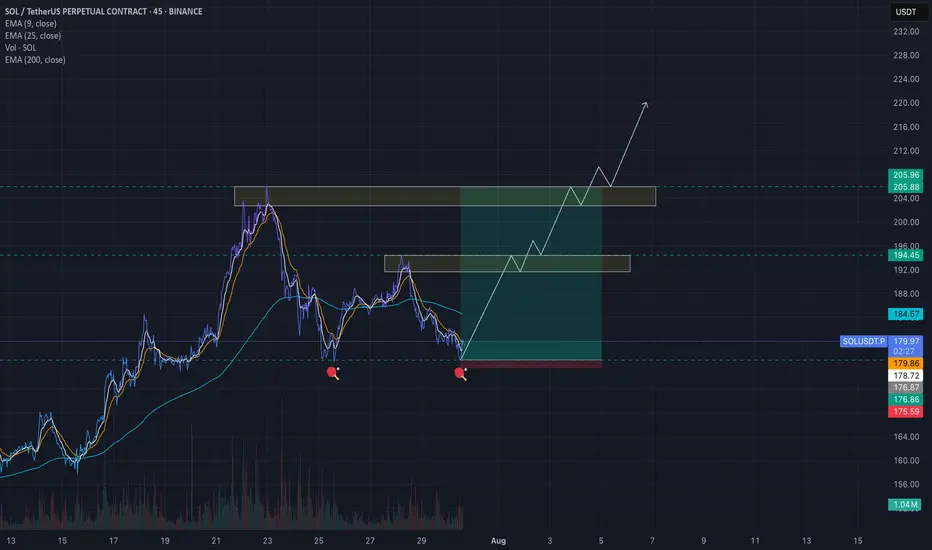
SOLANASolana showing a great bounce and strong buy back with an active escalation. Expecting to hit $200 and above this days. IMHO.
NFA - DYOR
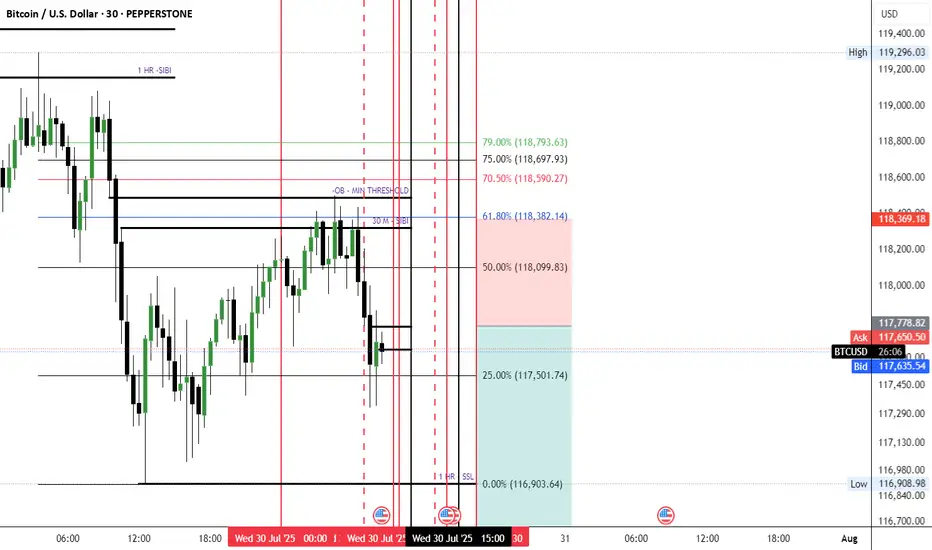
BTC BUY SETUP ,Bought From $117,700BTC BUY SETUP
Currently $117,700
Bought From $117,700
(Trading plan If BTC go down
to $116,100 will add more longs)
Expecting target $119,200 OR ABOVE
In the event of an early exit,
this analysis will be updated.
Its not a Financial advice

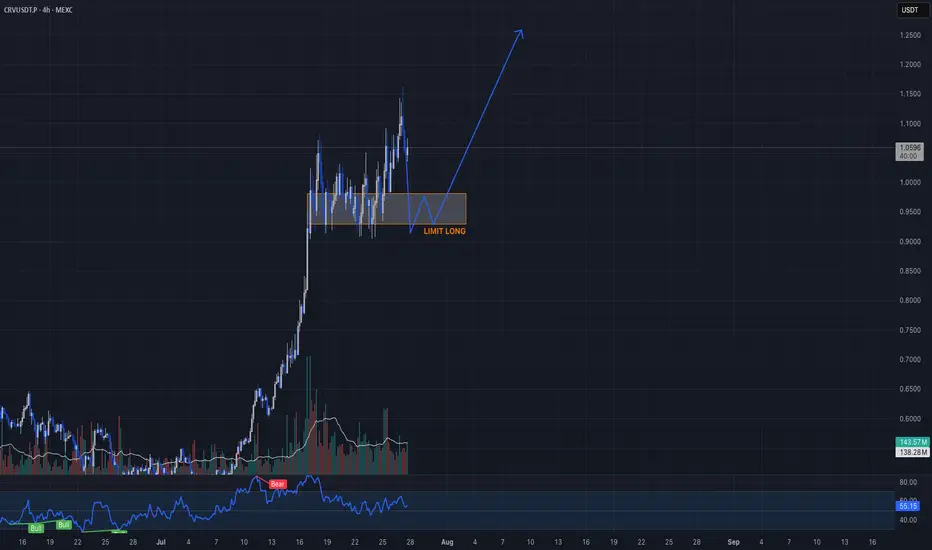
Momentum-backed long setting up on CRVUSDT.PCandle Craft fam — here’s a momentum-backed long setting up on CRVUSDT.P (12H) following a high-conviction trend shift.
Price exploded out of a multi-month base and is now consolidating in a bullish structure. We’re seeing stacked OBs between 0.93–0.98 and volume cooling off after the pump — a classic reaccumulation zone.
Here’s how we’re looking to play it smart:
⸻
🟢 LONG ENTRY PLAN:
Retest Entry (Preferred)
• Entry: 0.9815 – 0.930
• SL: 0.880
• 🎯 Targets:
▫️ TP1: 1.10
▫️ TP2: 1.22
▫️ TP3: 1.35+
Breakout Entry (Aggressive)
• Entry Trigger: Above 1.085
• SL: 0.995
• 🎯 Same targets ☝️
⸻
📊 Why This Setup Matters:
• Broke key structure on volume → now pulling back orderly
• OB stack between 0.93–0.98 = bullish base
• 12H showing HLs, no sign of reversal
• BTC stable = alt rally fuel
⸻
🧩 Candle Craft Note:
We favor precision over hype. This is a textbook continuation play with great RR and structure. Patience pays — don’t chase, let it come to you.
Let’s execute with discipline.
— Candle Craft | Signal. Structure. Execution.
CETUS at a Pivotal Point Inside Dual Daily Structures🔍 $CETUS is compressing tightly on the daily chart—coiling inside a symmetrical triangle 📐 while staying within the bounds of an ascending channel 📈. This layered structure signals growing pressure beneath the surface.
A sharp rejection from the upper trendline ❌ has shifted attention back to the lower support zone. Will it rebound from here or crack below?
⚠️ This is a high-stakes area to watch—momentum is building, and a breakout in either direction could trigger a major move.
Drop your bias below—bullish continuation or bearish snap?
Not financial advice.

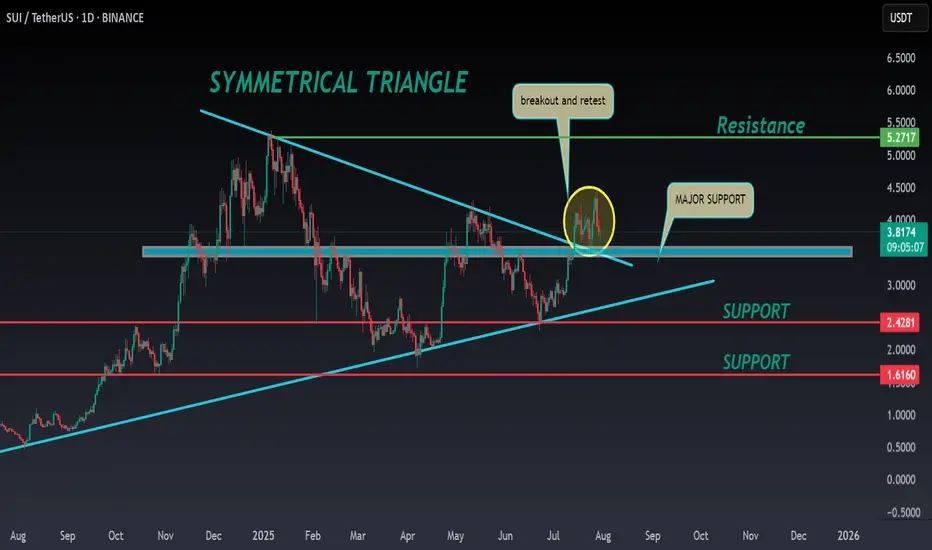
SUI ANALYSIS🔮#SUI Analysis 💰💰
#SUI is trading in a symmetrical triangle in a weekly time frame and if it breakouts with high volume then we can see a bullish momentum in #SUI. Before that we will see little bit bearish movement towards its support zone and that a bullish movement.
🔖 Current Price: $3.81
⏳ Target Price: $5.27
⁉️ What to do?
- We can trade according to the chart and make some profits in #SUI. Keep your eyes on the chart, observe trading volume and stay accustom to market moves.💲💲
🏷Remember, the crypto market is dynamic in nature and changes rapidly, so always use stop loss and take proper knowledge before investments.
#SUI #Cryptocurrency #Pump #DYOR
Ethereum (ETH): 2 Successful Trades | Targeting Now $4800Ethereum was so close to $4K that we considered it basically reading the target; now we set a new target and a new entry for us as well.
We are looking for a complete breakout to happen from the region of $4000, which then would open for us an opportunity for a bullish move towards the $4800.
Swallow Academy