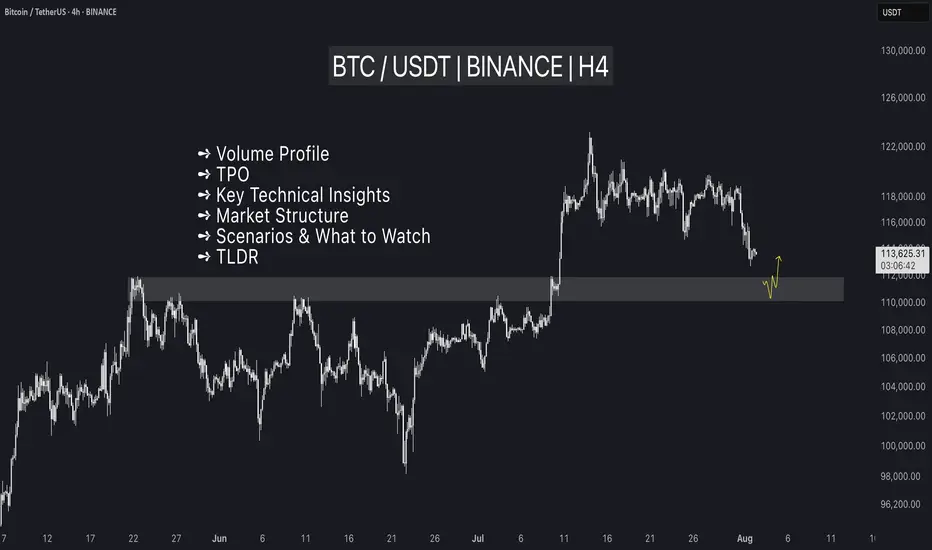
Bitcoin: Expected Cool-Off or Cause for Concern?After rallying more than 25% off the June lows, Bitcoin is finally taking a breather with a much-anticipated pullback. But as expected, the fear meter is spiking, especially across CT.
Was this cool-off really a surprise? Not quite.
The signs were there: price stalling at upper extremes, responsive sellers stepping in at perceived overextensions, and inefficient zones left behind during sharp impulsive moves.
Of course, reading it in real-time is easier said than done. Emotions always complicate execution , but that’s a separate conversation.
In this post, let’s break down the current structure in detail —using volume profile, TPO charts, and market structure analysis, to give you a clearer picture of what’s unfolding. We’ll also explore a few scenarios worth watching as the next move shapes up.
Let’s dive in!
Table of Contents
➺ Volume Profile
➺ TPO
➺ Key Technical Insights
➺ Market Structure
➺ Trade Scenarios and What to Watch
➺ TLDR
⦿ Volume Profile
Currently, we’re seeing two key zones of balance : one broad range that held for over 60 days and a tighter 21-day structure that formed at higher levels. These are classic areas of value where buyers and sellers found temporary agreement, establishing balance.
The sharp move from ~111,000 to ~122,000 was largely impulsive , with little volume built along the way, suggesting initiative buying in early July. As is often the case with such thin zones, they tend to get revisited once momentum fades. That’s exactly what we’re seeing now.
As price dips into this low-volume pocket, the key question is:
Will the market accept this zone and begin building value here, or will it reject and bounce back toward higher ground?
Looking at the Volume Range Visible Profile (VRVP) since June 7th, the nearby Value Area High (VAH) sits around ~111,000 . If current support doesn’t hold, this becomes the next major volume magnet. That said, there’s also a low-volume node (LVN) just above 111,000 , which could act as a demand pocket and trigger a responsive bounce.
In simple terms:
– Acceptance into the LVN could lead to new range formation at lower levels
– A sharp bounce off ~110,000 might reestablish the prior higher balance, or create a fresh range between the two existing areas
The next few sessions will reveal whether the market is hunting for new value or just shaking out weak hands.
⦿ TPO
Zooming into the 4H TPO chart, we can clearly see the evolving monthly profiles from May through August. And as is often the case, the market found resistance right where you’d expect: at the extremes.
The upper end of July’s profile became a battleground. Buyers attempted multiple pushes above that upper balance, but each effort was consistently faded by responsive sellers , signaling growing exhaustion at the top.
Eventually, that pressure gave way to an impulsive breakdown, driven by initiative selling. Notably, price didn’t rotate gently back into the previous range, but it sliced straight into a thin zone of prior low participation.
Now, the market is sitting at the low-volume region , and the next key battle is shaping up. Additionally, The 108,000 to 110,000 area carries weight as it served as the Value Area High (VAH) for both the May and June profiles. If buyers are going to respond, this is one of the more likely places for them to step in.
⦿ Key Technical Insights
▸ Failed Acceptance Above 21-Day Balance
Repeated attempts to hold above the short-term balance were rejected, signaling buyer fatigue and a lack of conviction at higher levels.
▸ Initiative Sellers Took Control
Once demand dried up, sellers stepped in aggressively. The thin participation during the recent rally left little structural support, allowing price to drop quickly.
▸ No Value Built Below Yet
The zone currently being tested saw minimal trading earlier. If bulls want to reclaim control, they’ll need to build value here and establish a new base.
▸ Prior Balance High as Potential Support
Price is now retesting the top of the 60+ day balance area from above, a classic setup where previous resistance can become support. This area also aligns with a known demand shelf.
▸ Deviation Below the 200 MA Cloud
Price has slipped below the 200 MA cloud and is nearing a key flip zone. A test of the 110,000 level next week wouldn’t be surprising. That area could serve as a strong support zone where a new accumulation phase begins.
⦿ Market Structure
The broader market structure points to a transition in progress. After spending over two months in balance , price broke out to the upside —only to form another short-lived range at higher levels. That, too, gave way to a swift breakdown.
This kind of “failed acceptance at higher prices” is often an early signal that the market may revisit prior zones of interest, typically areas where value was last built.
All eyes now shift to the 110,000–111,000 zone , the high of the previous 60-day balance.
We’re in a classic test-retest phase, where the market is probing for conviction . These moments often set the stage for the next significant move, either continued distribution lower, or the beginning of a re-accumulation phase.
⦿ Scenarios & What to Watch
As Bitcoin pulls back into key structural zones, several scenarios are in play. Here's what to monitor in the coming sessions:
Scenario 1: Re-Acceptance into 21-Day Balance
▸ If price reclaims and holds above ~116K, we could see a rotation back toward the upper end of the short-term balance near ~120K.
▸ This would suggest the recent breakdown was a failed auction or bear trap, not the start of a broader trend reversal.
▸ Watch for initiative buying above the demand shelf with follow-through volume.
Scenario 2: Choppy Mid-Balance Activity
▸ Price remains range-bound between ~110K and ~116K, forming a new short-term balance zone.
▸ Expect slower movement and back-and-forth behavior as the market decides its next direction.
▸ Patience is key here. Watch volume and initiative behavior to gauge strength.
Scenario 3: Rejection and Continuation Lower
▸ If price fails to hold above ~110K, there’s potential for a move down to the POC near ~104K, or even deeper toward ~100K (Value Area Low).
▸ These are low-volume zones, which rarely offer strong support unless new value is built.
▸ This would signal a continuation of the current imbalance and potentially mark a structural trend shift.
I’m primarily focused on Scenario 1 and 2 , as we appear to be in a late bull phase. A deeper pullback toward 100K increases the risk of a broader trend change, making it less attractive from a risk/reward standpoint.
⦿ TLDR
▸ Buyers failed to hold the top of the 21-day balance. Clear signs of exhaustion.
▸ Price dropped into a prior low-volume zone, which now acts as potential demand.
▸ This area has never been accepted before - either buyers step in, or we go lower.
▸ Reclaiming ~116K could fuel a move back toward 120K+.
▸ Failure to hold ~110K opens the door to 104K, maybe even 100K.
What happens next week will likely set the tone for the next major move. Watch how the market responds to acceptance vs rejection zones, and let price action confirm your bias before you act.
If you found this analysis helpful, share it with someone who trades Bitcoin. 🥰
What’s your read on the current structure? Let me know in the comments! 📉
⚠️ Disclaimer
As always, this post is purely for educational purposes. I am not a financial advisor, and nothing here should be taken as financial advice. Always consult your financial advisor before making any investment or trading decisions. Or at the very least, consult your cat. 🐱
Crypto market
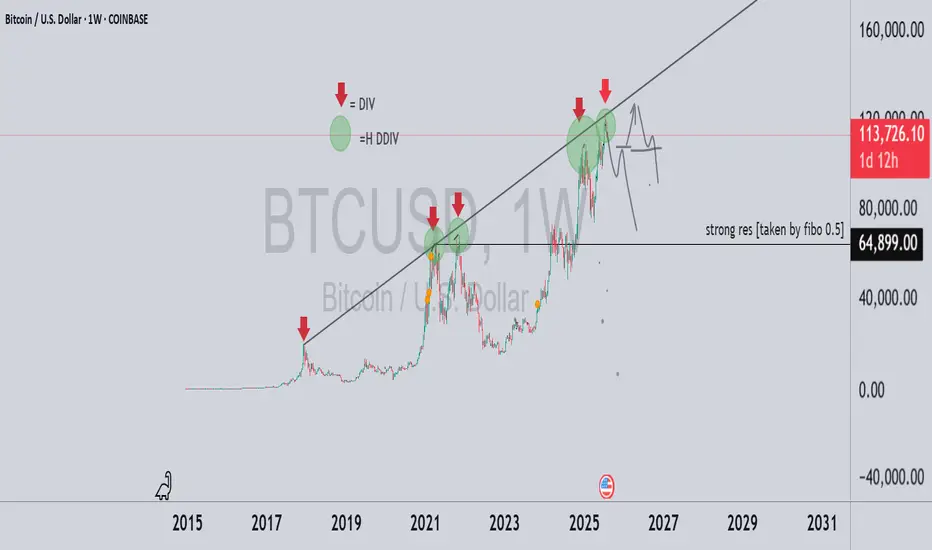
to 65K soon BTC/USD – Historical Cycle Analysis & Mid-Term Outlook (1W)
Exchange: Coinbase
Timeframe: Weekly (1W)
Key Observations:
Long-Term Trendline Resistance
The black ascending trendline has historically acted as a major resistance zone since 2017.
Every touch of this line in the past has been followed by a significant correction.
Bearish Divergences (DIV / HDIV)
Red arrows indicate historical bearish divergences on RSI/MACD.
Each divergence marked a local or macro top before a sharp retracement.
Major Historical Resistance – $64,899
Derived from 0.5 Fibonacci retracement of the primary cycle.
Served as a key ceiling during previous cycles before new all-time highs.
Bitcoin Cycle Behavior
BTC historically forms parabolic tops followed by deep corrections.
The current cycle (2024–2025) mirrors 2017 and 2021 structures, suggesting we may be approaching a macro inflection point.
Mid-Term Scenario
Price near the trendline (~$120K) implies high risk of volatility and correction.
Primary support zone: ~$65K (historical + Fibonacci confluence).
Likely scenario: range-bound movement between $65K–$120K before any sustainable breakout or new parabolic leg.
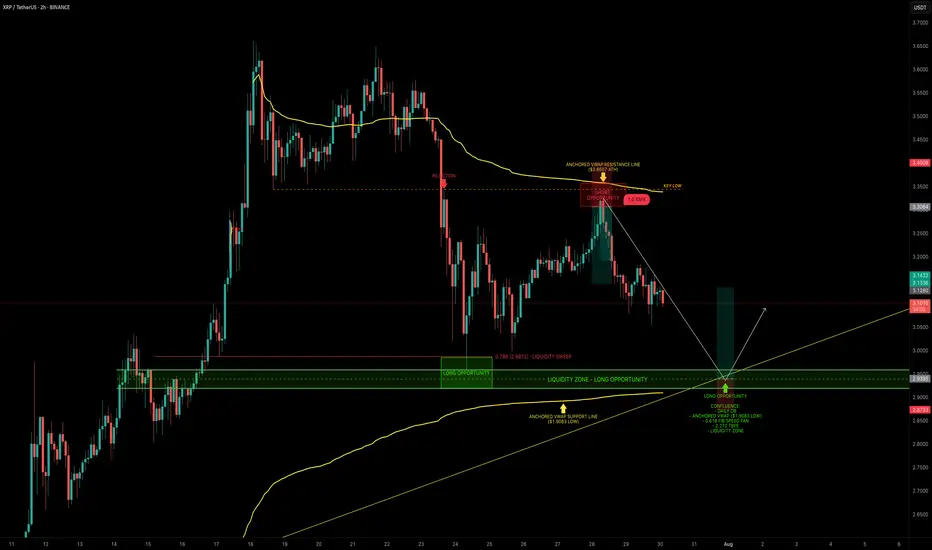
XRP — Mapping Out the Next High-Probability Long SetupXRP continues to respect key levels, delivering clean setups and strong technical reactions.
📉 Recent Price Action Recap
After the flush from $3.65 into the $3.00 support zone, XRP printed a solid bounce back toward the $3.30 resistance area, forming a clean short setup between $3.30–$3.35.
Price is now trading mid-range within the 6-day consolidation.
🟢 Next High-Probability Long Setup
A prime long opportunity lies between $2.96 and $2.9175 sitting within a key daily order block.
Confluence at this zone includes:
Liquidity pool just below the $2.9555 swing low
Anchored VWAP from the $1.9083 swing low resting just under the block
0.618 Fib Speed Fan lining up as dynamic support (July 30 – Aug 2)
2.272 Trend-Based Fib Extension at $2.9297
📈 Long Trade Setup
Entry Zone: $2.96 – $2.9175
Stop Loss: Below anchored VWAP (clear invalidation)
Target: $3.1/$3.13+
R:R: ~1:3+
💡 Educational Insight
This setup is a great example of how multiple tools layered together (like Fibonacci levels, VWAPs, order blocks and liquidity zones) can significantly increase the probability of a trade playing out.
When structure, volume-based tools and time alignment all point to the same area, it creates a high-confluence trade zone. These are the areas where risk is most defined and reward is most favourable, a principle every technical trader should anchor their strategy around.
_________________________________
💬 If you found this helpful, drop a like and comment!
Want breakdowns of other charts? Leave your requests below.
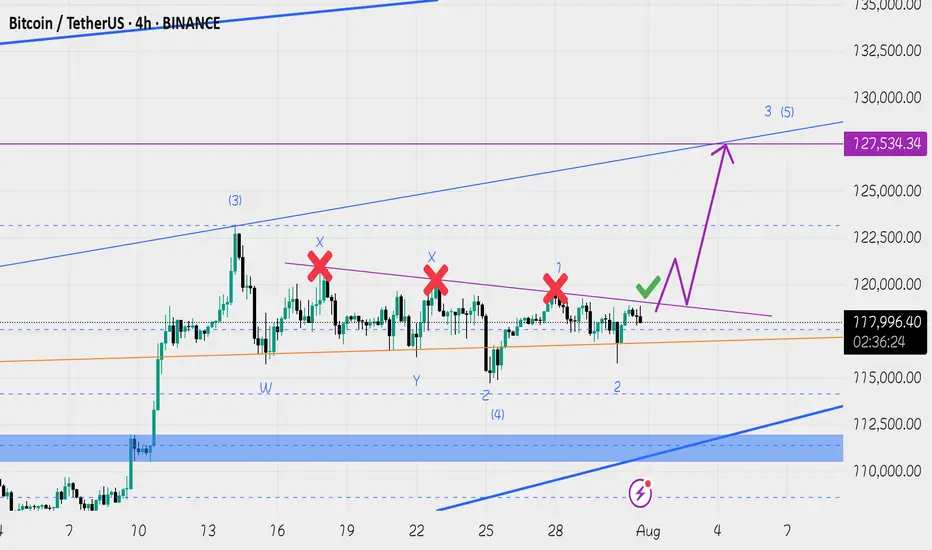
127-128k incoming ( altcoins round ? )Hi, Bitcoin seems to have completed its short term Elliott wave 4 correction and the price action analysis also confirms that this time Bitcoin will be able to break the 120-119 resistance, I predict Bitcoin to make a new high around 127-128. Altcoins have not grown that much yet and if the price can make a reliable consolidation above 120k, altcoins will start to rise.
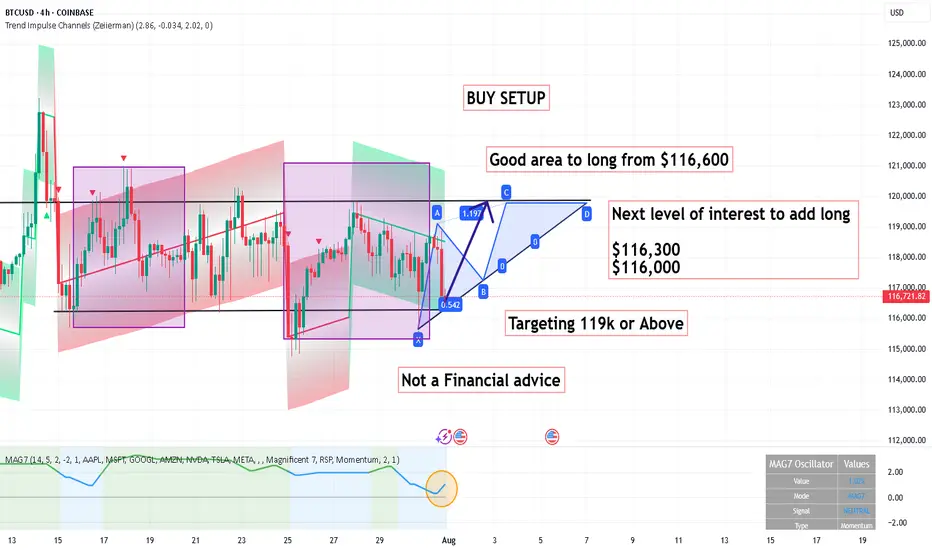
BUY SETUP ,Good area to long from $116,600BUY SETUP
Good area to long from $116,600
Next level of interest to add long
$116,300
$116,000
Targeting 119k or Above
Its not a Financial advice
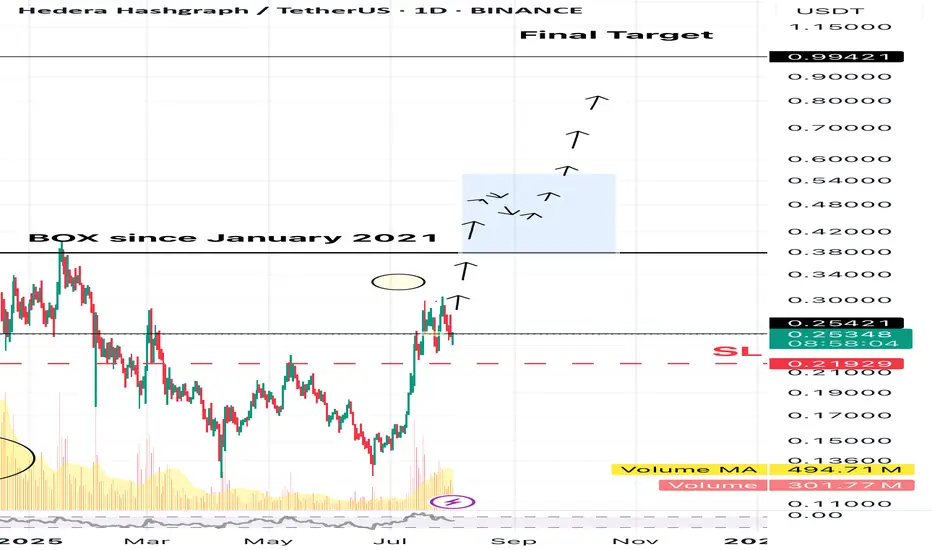
Buy HBARHBAR is the native cryptocurrency of the Hedera network, a high-performance, enterprise-grade public blockchain alternative that uses a unique consensus algorithm called Hashgraph.
Governed by a 39-member global Governing Council, including:Google, IBM, Boeing, Dell, Ubisoft, Deutsche Telekom. These members run nodes and vote on governance, making the network decentralized, but enterprise-friendly.
HBAR still in the box formed since January 2021 but it has potential to break-out. Actually, the first leg-up has started and curently price is consolidating before the second legup. with potential to break out the box.
Trade setup is as in chart Target is estimated based on market cap of 11B.
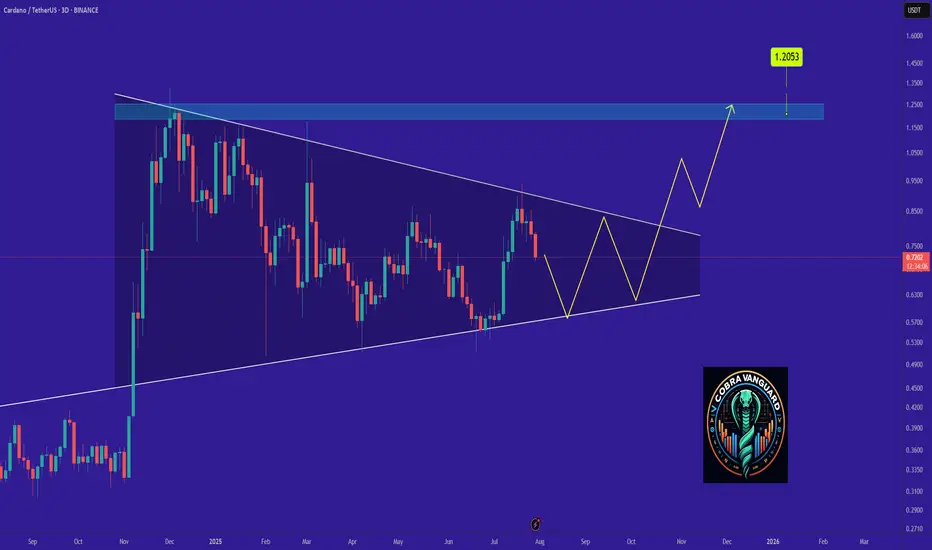
ADA Ready for PUMP or what ?The price on the 3d timeframe is within a triangle, which can create some uncertainty about which direction it will move. Here, we should wait to see which side of the triangle the price breaks out from. Remember, the trend is our friend.
Best regards CobraVanguard.💚
ETH Price Weakens: Watching This Strong Demand Zone Closely$ETH/USDT Analysis (12H)
Ethereum has broken below a key support zone, confirming short-term weakness in price structure.
At the same time, the RSI is showing bearish divergence, signaling slowing momentum while the price was making higher highs — a classic early warning of a potential drop.
Now all eyes are on the strong demand zone below. If ETH finds support there, we could see a solid bounce or even a full trend reversal. But if this zone fails, deeper correction may follow.
DYOR, NFA
Thanks for the reading

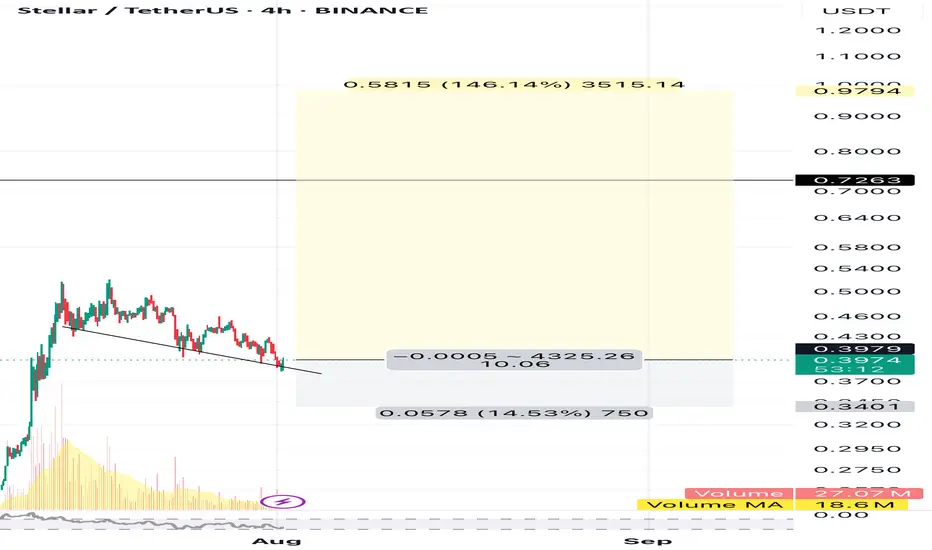
JUP/USDT Retests Key Support! Bounce Incoming or Breakdown Ahead📉 Complete Technical Analysis:
The JUP/USDT pair is currently showing a critical price action after breaking out from a medium-term descending trendline (yellow diagonal line). However, the price is now retesting a major demand zone around $0.4200–$0.4574.
📌 Pattern Identified:
Descending Trendline Breakout: Price successfully broke above a long-standing bearish trendline.
Retest of Breakout Zone: The current move is a classic retest, often seen before a trend reversal continuation.
Strong Demand Zone: The yellow zone ($0.4200–$0.4574) has historically served as a strong accumulation and bounce area.
---
📈 Bullish Scenario:
If the price holds and bounces from the $0.4200–$0.4574 zone, bullish momentum could resume with upside targets:
Short-term target: $0.6089
Next resistances: $0.7213 – $0.8075
A confirmed higher low above support would strengthen the bullish structure.
---
📉 Bearish Scenario:
If the price breaks down below $0.4200, bearish pressure could return, leading to further downside.
Potential decline toward deeper support levels around $0.35–$0.30.
Breakdown with increasing volume would confirm seller dominance.
---
🎯 Key Levels to Watch:
Support Zone: $0.4200 – $0.4574 (Critical Retest Area)
Immediate Resistance: $0.4883, $0.6089
Major Resistance Levels: $0.7213, $0.8075, $1.1158, up to $1.6576
---
🧠 Conclusion:
JUP/USDT is currently at a crucial decision point. The reaction at this support zone will define whether the breakout holds or fails. Traders should watch this level closely for confirmation of the next major move.
#JUPUSDT #CryptoAnalysis #AltcoinUpdate #TechnicalAnalysis #CryptoBreakout #SupportAndResistance #TradingView #Cryptocurrency #ChartPattern #BullishSetup #BearishCase

XRP 1H – 21% Decline Off the HighAfter hitting a strong resistance near $3.75, XRP has been in a steady downtrend, losing over 20% from its peak. The chart shows clear lower highs and a strong descending resistance line capping every bounce. Price action remains bearish, but short-term momentum (via Stoch RSI) shows signs of being oversold — hinting at a potential relief bounce.
To flip bias, bulls would need a clean break of the trendline and reclaim the $3.15–$3.25 area. Until then, lower highs + sustained sell volume = caution for longs.
📌 20.6% decline
📌 Downtrend intact
📌 Momentum diverging — bounce or continuation?
This setup is primed for a mean-reversion or further breakdown — stay reactive, not predictive.

Can XRP obtain a 50% increase in the next few weeks XRP has recently been under a lot of manipulation lately! Is it time for the bulls to finally step in and move the price point on this digital asset to a 50 percent increase to another ATH at $4.45………? The world will see with the next few weeks! And why is #Bradgarlinghouse X account always following 589………..? It’s it a signal or is he just trolling

Long XLMBTC is bouncing from a strong support.
XLM would have another leg up from the local support trendline.
Trade setup is as in chart.
BTC Forecast For August & September. The Only Roadmap You Need !This is one is so obvious, its a no brainer , and would likely be very easy to trade as long as you follow this road map i have provided.
The Value Area High at 110k price range is most important upcoming battle line between bull vs bear. If bulls fail to get a strong bounce from 110k and we close at least 2 daily candles below it. Then it would mean bears have full control and the implication of that is that since we would at that point be closing back inside an established Value Area range, formed between Nov 20th to Jul 25th, then it would mean the probability of price selling all the way down to re-test the VAL (value area low) at $91.6k would instantly become very very high.
After re-testing $91.6k we'll watch and see what happens.
It'll either hold after grabbing some liquidity below and stay in the Value Area Range until further notice Or we lose it and the sell off continues. Bear market will be in full swing if that happens and you can bet a ton of weak hands will start to exit due to max pain & cascading long liquidations. Fear index will be back in the red at that point as capitulation starts to set in. Alot of new alts and meme coins will be completely obliterated.
Bullish Continuation Scenario
If bulls get a strong bounce from 110k and don't close back inside the Value Area Range below, then we could continue up to a make a new ATH for a classic trend pullback continuation trade. Once we get back above 115.4k, the dream of a new ATH will become much more realistic. There is an UFA(Unfinished Auction) at 120.8k which is only visible to traders using the market profile or footprint chart. This make poor high and needs to be taking out at some point.
For the Price target to the upside, we would be using the peak formation line of the ExoFade indicator.

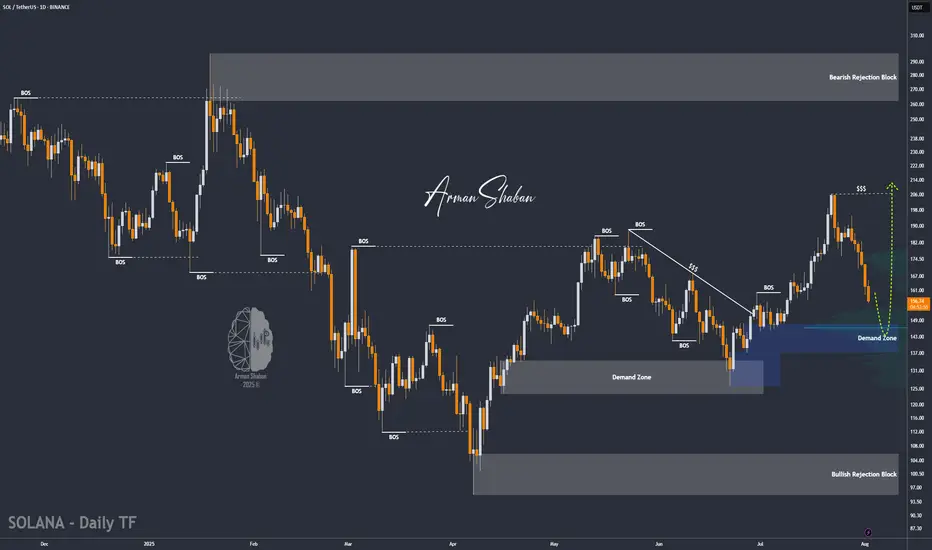
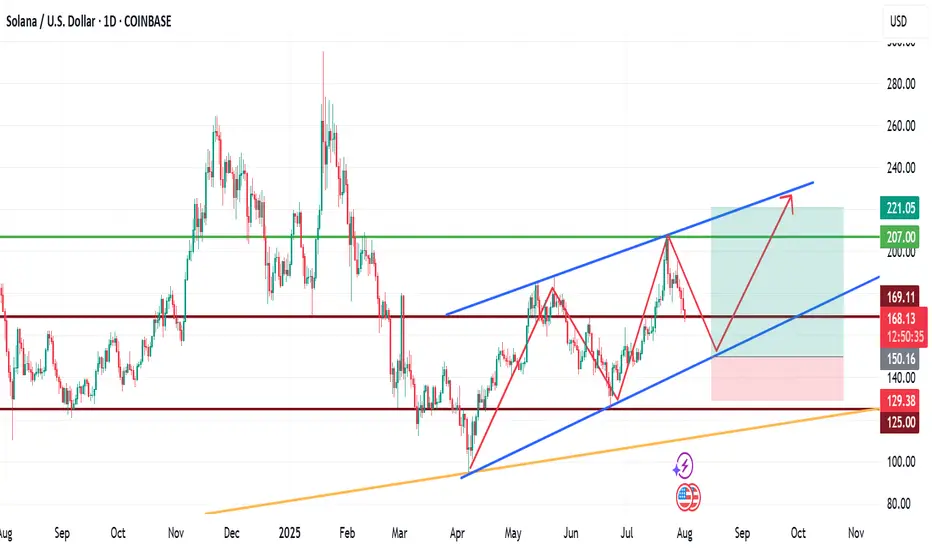
SOL/USDT | SOL Drops 25% – Approaching Key Buy Zone at $136–$148By analyzing the Solana chart on the daily timeframe, we can see that, like the rest of the market, it's undergoing a correction — dropping over 25% from the $206 area so far. Solana is now approaching a highly attractive buy zone between $136–$148, so be sure to closely monitor the price reaction in this range. Bullish targets will be announced soon — stay tuned!
Please support me with your likes and comments to motivate me to share more analysis with you and share your opinion about the possible trend of this chart with me !
Best Regards , Arman Shaban
More slowly.Another chart about how it's pointless to look at a situation using 4 H, 1 D, or even 1 W.
What are you guys talking about?
When will this monthly divergence finally materialize?
Wait, wait and wait.

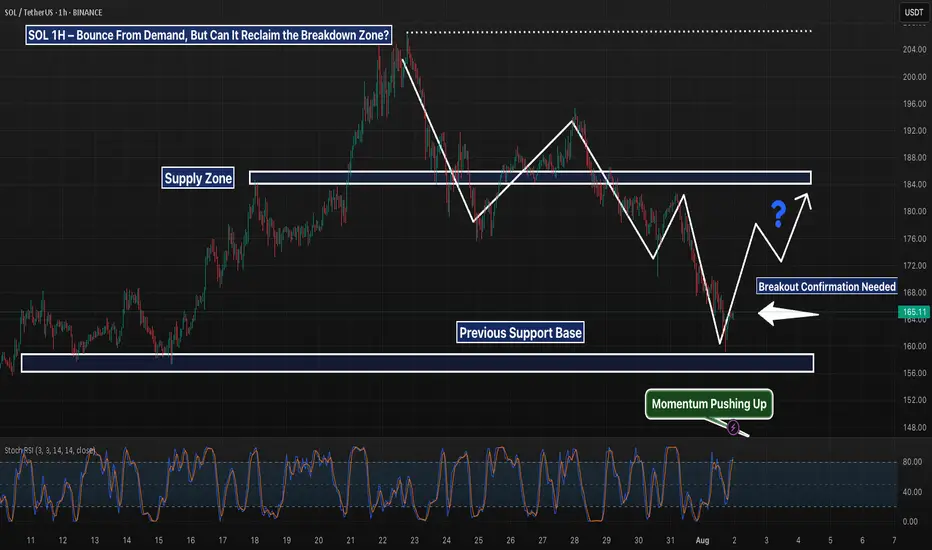
SOL 1H – Bounce From Demand, Can It Reclaim the Breakdown Zone?SOL tapped into the key demand zone near $157 and is now showing signs of a reaction bounce. Price is approaching the former support-turned-resistance zone around $184 — a critical level that marked the start of the previous breakdown.
A reclaim of that zone would suggest bulls are regaining control, opening up room toward the $190–$200 region. Until then, it remains a lower high attempt inside a bearish structure.
📌 Demand bounce
📌 Bearish market structure
📌 Key resistance at ~$184
No confirmed reversal yet — just a bounce until proven otherwise. Keep watching the structure evolve.
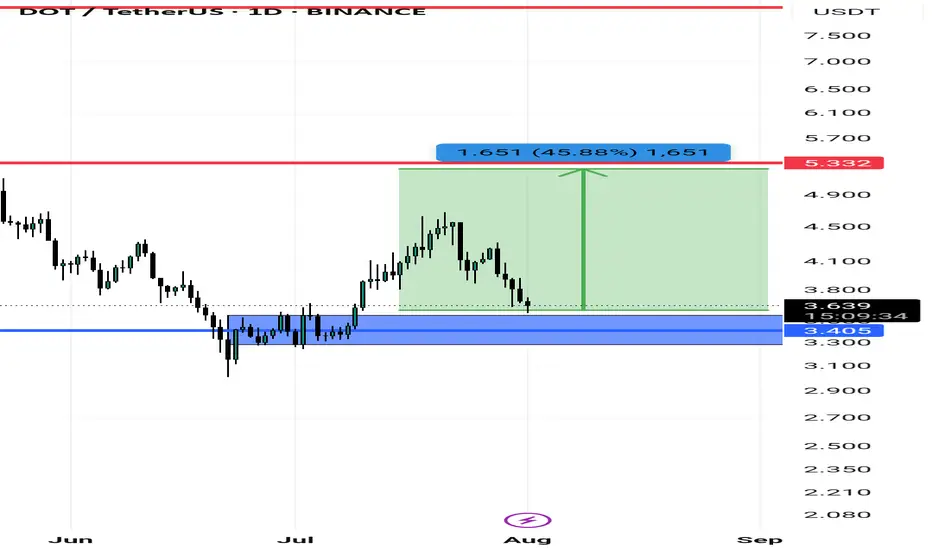
Dot/usdtPolkadot (DOT) cryptocurrency is showing potential for growth from around the $3.40 level.
If the price moves upward, it could potentially reach $5.20, $8, and even $12.
This analysis remains valid as long as the support level at $3.10 holds and no lower low is formed.
Please note: This analysis involves risk. Make sure to apply proper risk management.
My View for SOLANA next moveMy View for SOLANA next move.
Technically, SOL has been trading within a channel for a while now, with the formation of HHs and HLs.
If fundamentals play out positively long to mid-term, we are likely to see SOLNA fall to $150 zone before another upward leg forms. This leg may rally to as high as $220.
Trade with care.
If you found this helpful, please connect with me.
Like, comment and share
DOT is sitting at the bottom of the Weekly Channel💰 #DOT is sitting at the bottom of the Weekly Channel👀
Given the fact that market is in correction mode, it's literally the dip🔥
Target: 10$📈

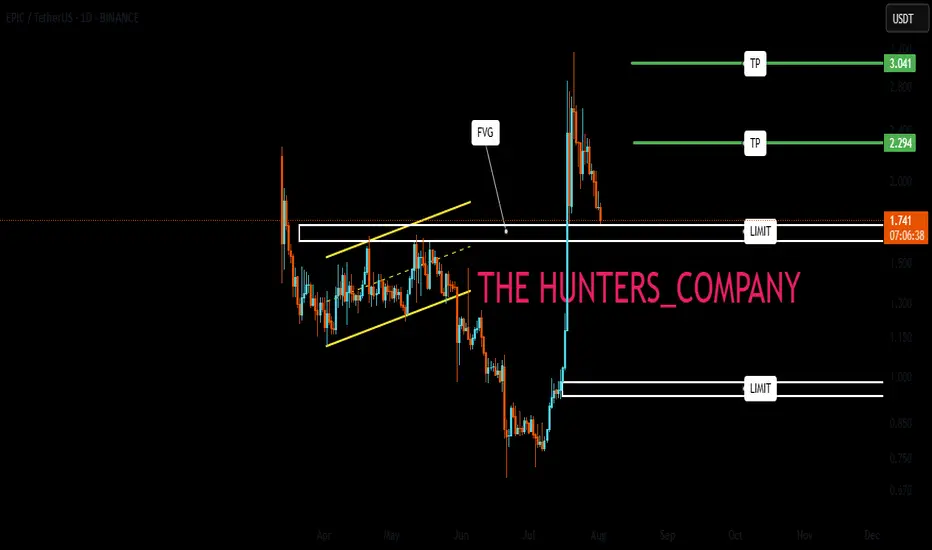
EPIC : Risky signal...Hello friends🙌
🔊Due to the good price growth, we have found important support points for you.
Now, due to the price correction, we have found buy points for you and you can buy with risk and capital management and move with it until the goals we have set for you.
🔥Follow us for more signals🔥
*Trade safely with us*
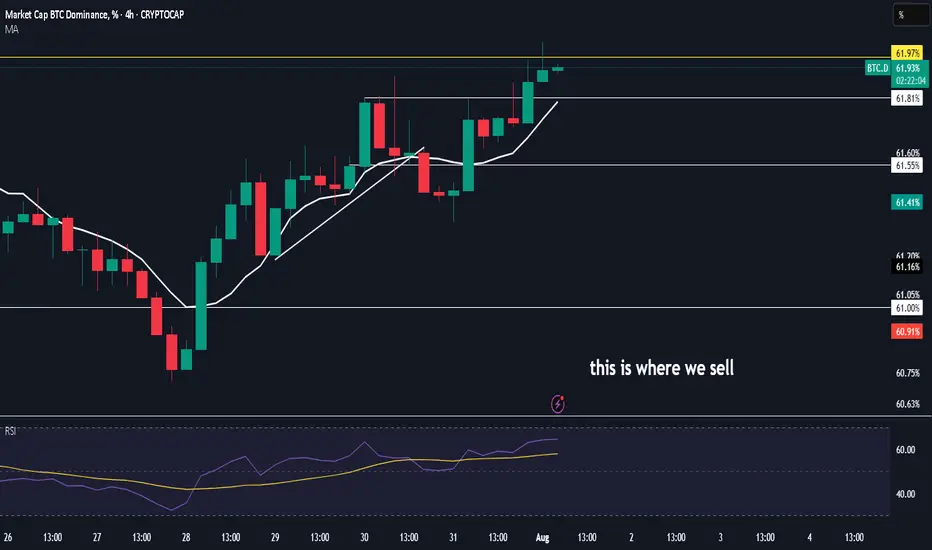
$btc.dok then are we deviating above one last time or ready to send it to hades ?
20 odd mins for 12h close lets see if to risk on more or chill
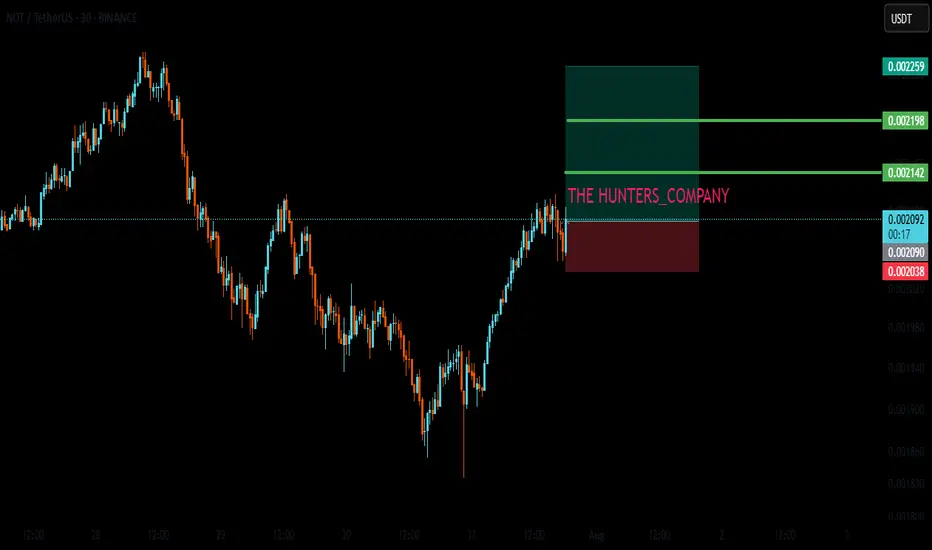
LIVE TRADEHello friends🙌
Given the good trend we had, now that we have had a price correction, we can enter the trade with risk and capital management and move towards the specified goals.
🔥Follow us for more signals🔥
*Trade safely with us*
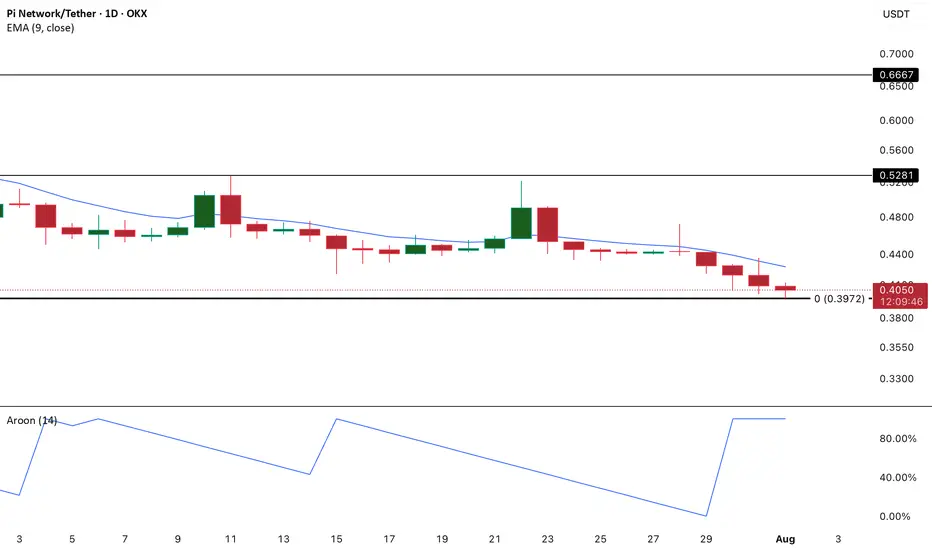
PI in Full Bear Control as Aroon Down Hits 100%PI continues to flash warning signs as technical indicators lean heavily bearish. Most notably, the Aroon Down Line on the daily chart has surged to a reading of 100%.
For context, the Aroon indicator is designed to identify the strength and duration of a trend, and when the Down Line reaches the 100% mark, it typically signals that a recent low was recorded very recently — often within the past day or two.
This kind of reading reflects an aggressive downtrend, where bearish momentum dominates and sellers are in full control.