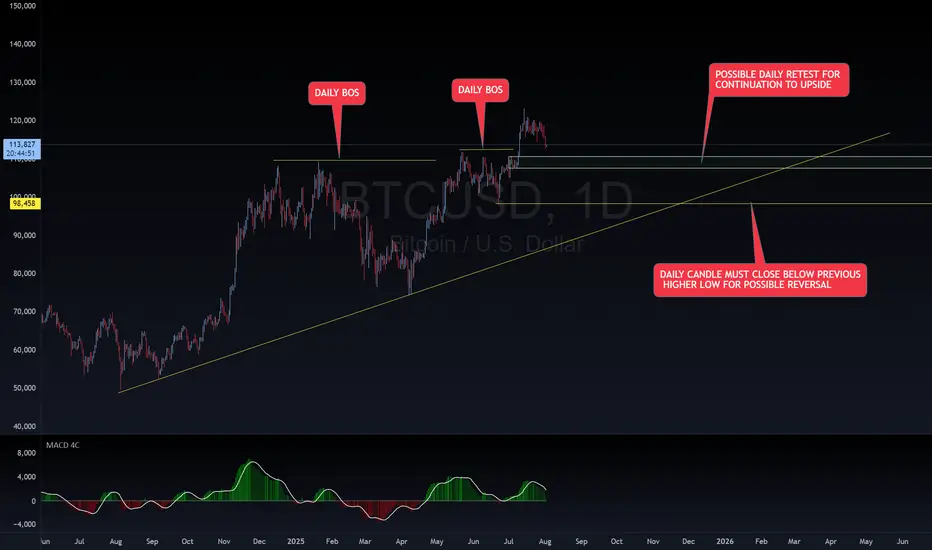
BTC BUY SET UPBTC is on an overall DAILY uptrend with a DAILY BOS. Waiting on a DAILY retest for continuation upward. If DAILY candle breaks and closes below last DAILY HL, it could potentially cause a reversal to downside. Happy trading!
~~~~I want everyone to succeed!
Crypto market
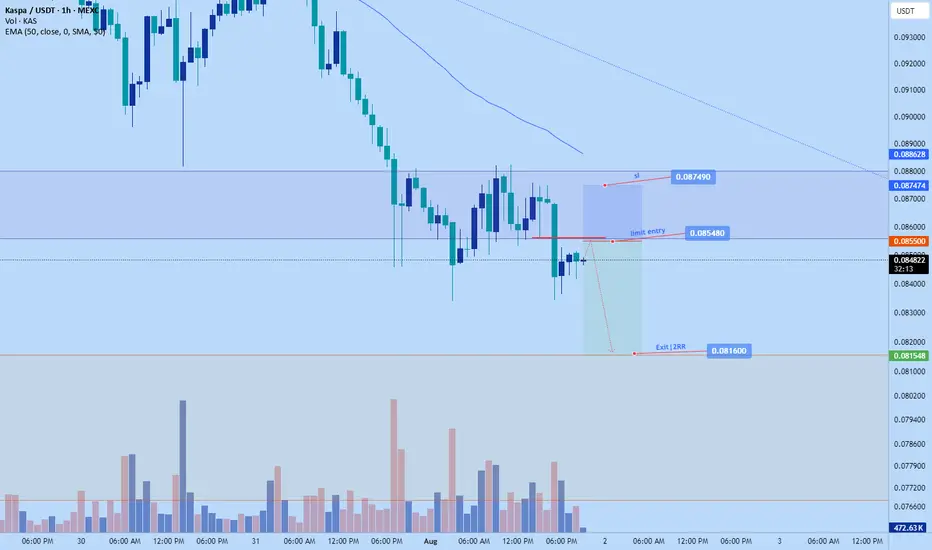
Kas short to $0.0816Just now opened a short on KAS.
Sl: $0.08749
limit entry: $0.08548
Tp: $0.0816
Risk to reward: 1:2
DTT analysis applied - learn more on X
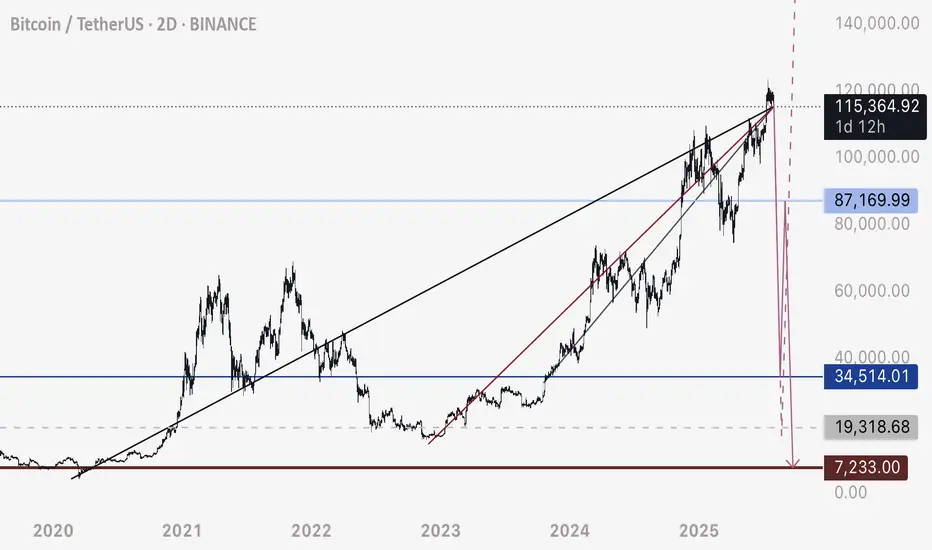
BTC - Not the End of the DropRather the beginning. Bitcoin has fallen below this bearish intersection. Anticipating price to fall rapidly on one of these two pathways to the Uber low liquidity levels.
DXY is retesting a major bearish breakdown - this is the conduit that will justify a flash crash of this magnitude prior to a 3-5 year bull run.
Happy trading.
BTCUSD The Week Ahead Key Support and Resistance Levels
Resistance Level 1: 119,000
Resistance Level 2: 121,030
Resistance Level 3: 122,862
Support Level 1: 111,683
Support Level 2: 110,450
Support Level 3: 108,720
This communication is for informational purposes only and should not be viewed as any form of recommendation as to a particular course of action or as investment advice. It is not intended as an offer or solicitation for the purchase or sale of any financial instrument or as an official confirmation of any transaction. Opinions, estimates and assumptions expressed herein are made as of the date of this communication and are subject to change without notice. This communication has been prepared based upon information, including market prices, data and other information, believed to be reliable; however, Trade Nation does not warrant its completeness or accuracy. All market prices and market data contained in or attached to this communication are indicative and subject to change without notice.

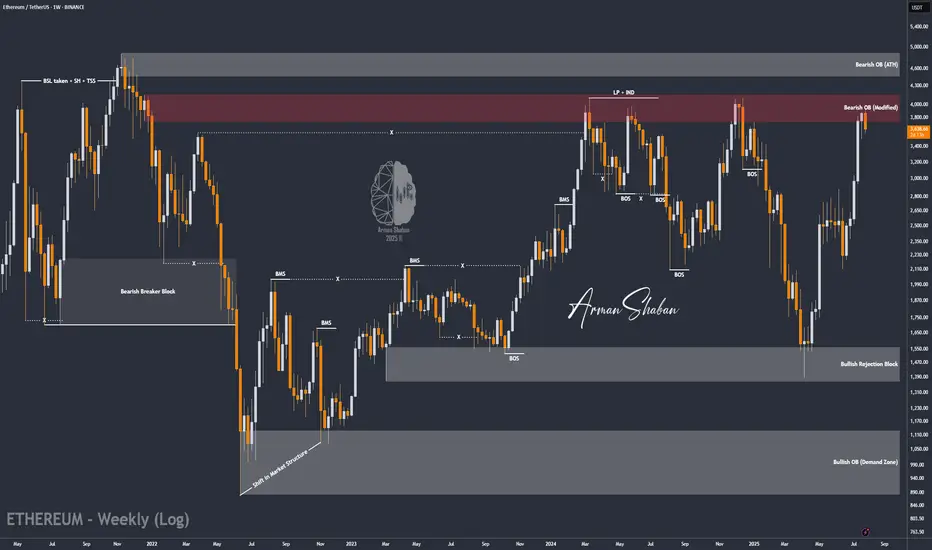
ETH/USDT | ETH Under Pressure – Watch $3500 Support!By analyzing the Ethereum chart on the weekly timeframe, we can see that after reaching the $3940 zone, ETH faced selling pressure and is now trading around $3540. If the price fails to hold the key $3500 support, a deeper decline is likely, with potential targets at $3040 first and possibly $2680 as the second bearish target.
Please support me with your likes and comments to motivate me to share more analysis with you and share your opinion about the possible trend of this chart with me !
Best Regards , Arman Shaban
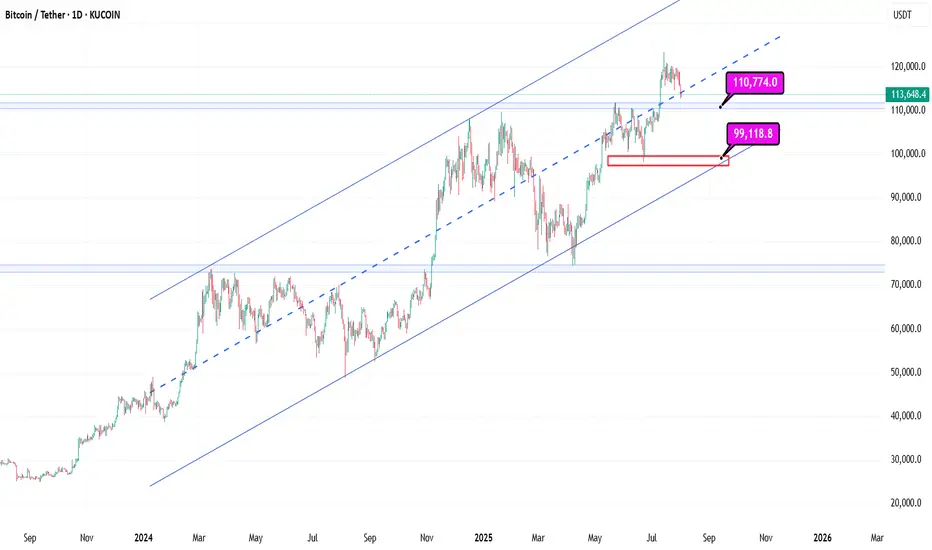
Bitcoin Support: Midline Channel Support at 114kBitcoin
1D
Bitcoin Support: Midline Channel Support at 114k and then Blue Line 110k
With these supports holding in the long term, progress is still possible
Can XRP obtain a 50% increase in the next few weeks XRP has recently been under a lot of manipulation lately! Is it time for the bulls to finally step in and move the price point on this digital asset to a 50 percent increase to another ATH at $4.45………? The world will see with the next few weeks! And why is #Bradgarlinghouse X account always following 589………..? It’s it a signal or is he just trolling

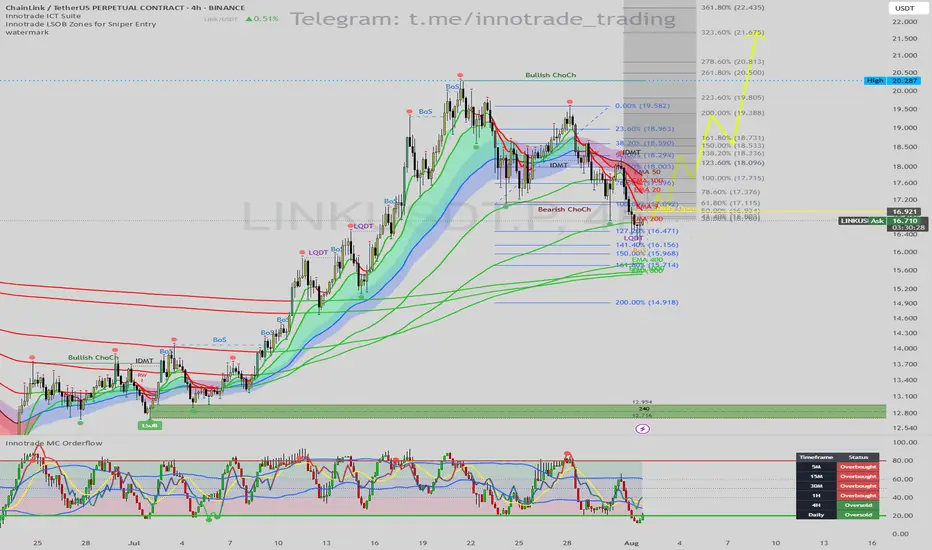
LINK/USDT: A+ Long Setup at Key Support with Daily OversoldHello traders,
I am monitoring a high-probability long setup on LINK/USDT on the 4H timeframe. The chart is presenting a classic reversal scenario where multiple technical factors are aligning perfectly, suggesting the recent corrective move may be over.
1. Trend & Context (The "Why")
After a strong uptrend, LINK experienced a necessary pullback, confirmed by a Bearish Change of Character (ChoCh). The price has now reached a critical zone where we can anticipate a bullish resumption.
Here are the key confluences for this setup:
Major Dynamic Support: The price is finding strong support directly on the EMA 200, a significant long-term moving average that often marks the end of a correction in a larger uptrend.
Price Action Signal (Liquidity Sweep): The most recent candle performed a perfect Liquidity Sweep (LQDT), wicking below the prior low to take out stop losses before quickly reclaiming the level. This is a classic institutional pattern that often precedes a strong move up.
Momentum Confirmation (MC Orderflow): The momentum oscillator provides the final, high-conviction confirmation:
The MC Orderflow is deep in the OVERSOLD territory, indicating that selling pressure is completely exhausted.
CRITICAL MTF CONFLUENCE : The Multi-Timeframe Cycle Table is showing that both the 4H and Daily timeframes are "Oversold". This HTF alignment is extremely powerful and significantly validates the strength of the reversal signal from this support level.
2. Entry, Stop Loss, and Targets (The "How")
The confluence of these signals provides a clear trade plan with an excellent risk-to-reward profile.
Entry: An entry around the current price ($16.70 - $16.90) is optimal, directly at the EMA 200 support.
Stop Loss (SL): $16.25. This places the stop loss safely below the low of the liquidity sweep wick, providing a clear invalidation point for the trade.
Take Profit (TP) Targets:
TP1: $18.20 (Targeting the cluster of short-term EMAs and the recent consolidation zone).
TP2: $19.50 (The next major swing high resistance).
TP3: $20.28 (The major high of the range, a full trend-reversal target).
Conclusion
This trade presents a textbook "A+" setup. The synergy between a key price action pattern (liquidity sweep) at a major technical level (EMA 200), combined with validated momentum exhaustion on both the 4H and Daily timeframes, creates a very high-probability environment for a significant bullish move.
Disclaimer: This is not financial advice. This analysis is for educational purposes only. Always conduct your own research and manage your risk appropriately.
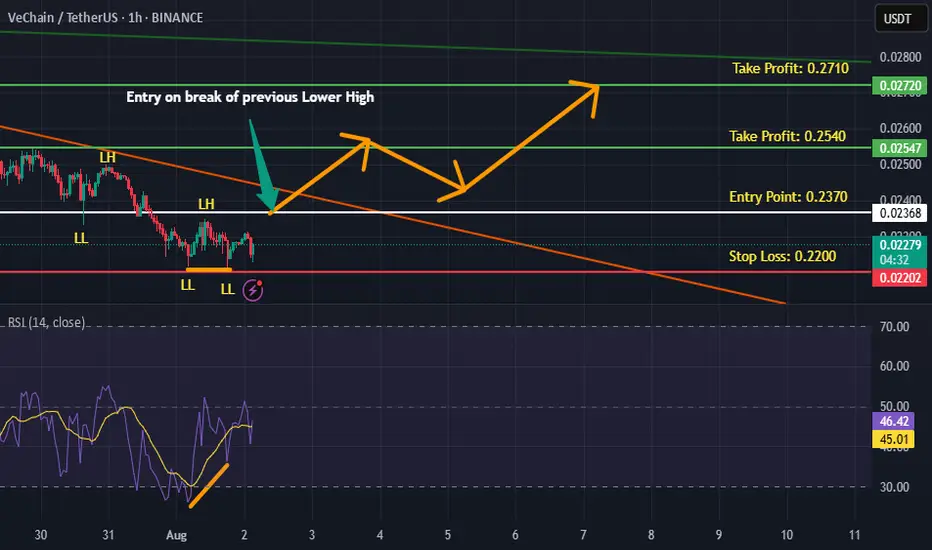
VETUSDT is BullishPrice was in a downtrend, however the bullish divergence with a double bottom reversal pattern hints the control of bulls. If previous lower high is broken with good volume then we can expect a bullish reversal as per Dow theory. Targets are mentioned on the chart.
The Great XRP Escape Plan: Thief Strategy Deployed🌀 XRP/USDT – Thief Trader’s Master Heist Plan: Crack the Vault Before They Catch On! 🧠💰
🔐💸 Operation Code: Ripple Raid 3.9 - Eyes on the Prize, Hands on the Trigger 💥
🌍 Attention Global Market Robbers and Strategic Money Movers!
This ain't just another analysis—this is the Thief Trading Style Blueprint, surgically designed for the XRP/USDT Crypto Market. Whether you're a silent sniper or full-squad raider, this trade setup is your next high-voltage money heist.
🔍 Market Breakdown:
📊 Technical + Fundamental = Robbery Precision
Currently, Ripple (XRP) is showing bullish fuel—charging into our trap-the-bears zone. Volatility is tightening, resistance is trembling, and it smells like liquidity is about to get stolen.
⚠️ Warning: The market’s at a risky cross-zone – overbought with heavy consolidation – where big bears and trapped traders usually play defense. That’s exactly where we strike.
🔓 Entry Gameplan – “Wait, Trigger, Execute”
📈 Entry:
"The heist begins when the candle breaks the high and screams confirmation!"
Set Buy Stop Orders above the recent resistance (around 3.1000).
Alternatively, use Buy Limit Orders on pullbacks at key swing levels (15M or 30M timeframes).
We use a multi-layered entry strategy (aka DCA + stacking like a pro thief stacking vaults). Be surgical. Be patient.
📌 Pro Tip: Always set a chart alert at the trigger zone to avoid missing the breakout party.
🛑 Stop Loss – “Breakout First, Then Talk Safety”
🚫 NO SL BEFORE BREAKOUT. Period.
Once price breaks out, then:
🔐 SL = Nearest 4H candle wick swing low (around 2.8000).
But remember, your SL = your risk appetite.
Whether you're placing 1 big order or 10 mini traps, manage it smart.
🎯 Target – "Get Rich, Then Vanish"
🏴☠️ Primary Take Profit Zone:
Target: 3.9000
Or exit anytime you see signs of reversal.
Don't get greedy—get paid.
👀 Scalpers’ Note:
Only play the Long side.
If you're deep-pocketed, dive in straight. If not, ride with swing traders and trail your SL to protect profits.
🔥 Why This Trade is 🔐:
📈 Current price structure, liquidity zones, and momentum favor bulls.
📊 Correlated intermarket signals + on-chain activity + macro backdrop align with XRP strength.
🧠 Smart money accumulation is visible – this is your window before the big breakout.
🚨 News & Position Management Alert:
📢 Stay clear of opening trades during major news events.
Use Trailing Stop-Loss on running positions to lock gains while letting profits fly.
This is not hype. This is precision.
Thief Trader doesn’t guess – we plan, we trigger, we exit.
📌 Final Words:
Whether you're scalping seconds or swinging for days – follow the blueprint. XRP has a vault to crack, and we’re here to rob it clean.
Now go out there, set those traps, and let the market pay you like it owes you.
🧠💸🕶️ Next Heist Plan Coming Soon… Stay Sharp.

Btcusd techinical analysis.Btcusd techinical analysis next move posibale at h1 time frame not finchinal advice.

If level breaks, the buyers last line of defense will be lost The red-marked zone, which acts as both dynamic and static resistance, is the only hope and the only scenario that could trigger an altseason.

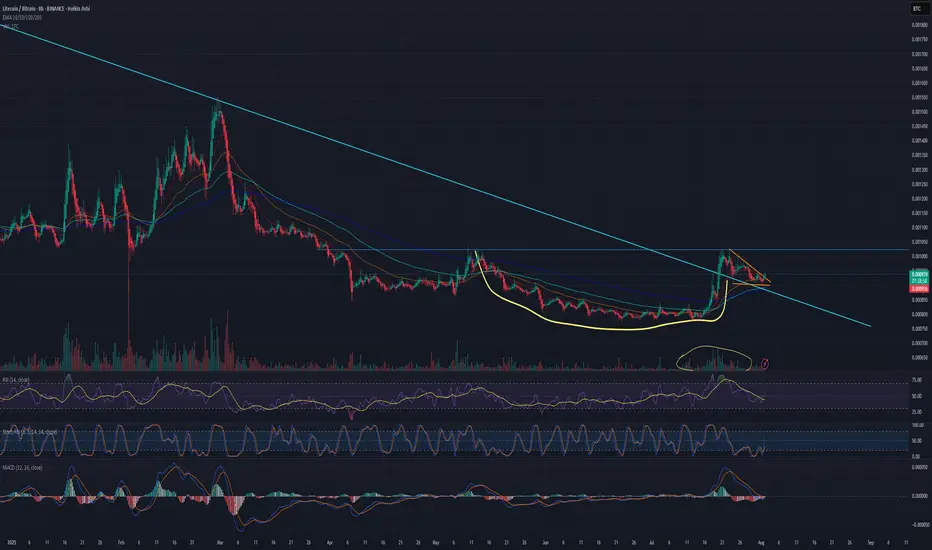
Is Litecoin finally ready to pop for real this time? 1600% gainAs many of you have been, I'm watching crypto prices closely since the BTC jump to $123k, waiting for the next move. Well, today we see that move and the entire market is blood red, except for...
Litecoin.
The patiently waiting little brother of the "big 3", waiting for his time to grow up and shine. Well today I'm impressed, mr. Litecoin is the only green coin in my entire Watchlist.
Zooming in on the chart: there’s a clean, rounded cup and a crisp handle forming, and that handle looks like it’s already breaking out. If Bitcoin can hold the $112K level, I think this could be the start of some serious moves from LTC.
The perfect bull flag that's formed on the chart has good volume too.
That blue line coming down is a long term trendline, and price is consolidating above it.
Still thinking about that "1600%"?
If you zoom out, there's a massive descending wedge forming since 2014 (11 years!!!). If Litecoin finally breaks out of it, the first fib level (.236) is at .01275BTC, that's 1600% up from here.
We'll see.
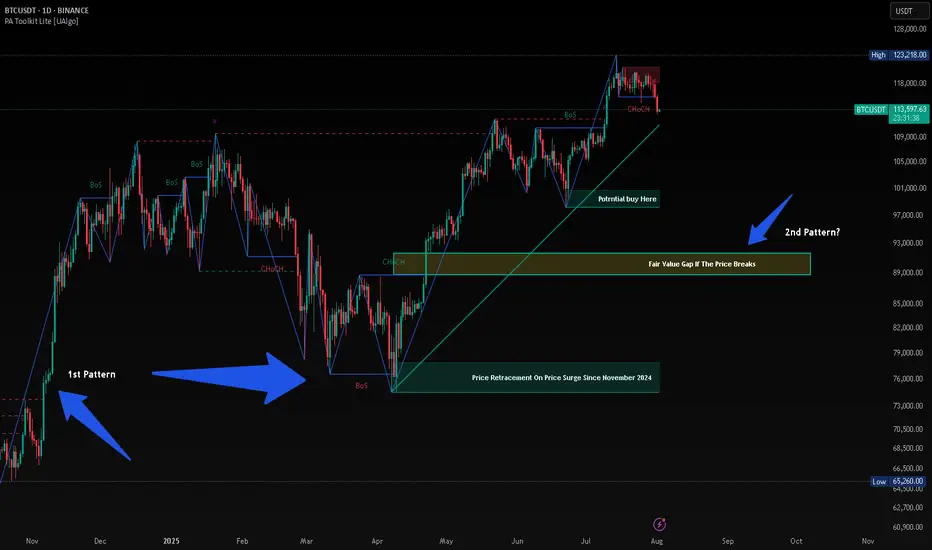
BTC HUNTS LIQUIDITYThis is just my opinion, BTC will hunt liquidity before taking new High. Since November 2024 after President Trump was elected, the price of BTC surge from $74,000 and retrace almost the same price on April 2025 after taking its new High. History will repeat itself and when history failed, there will be a long Bearish at least 90%.
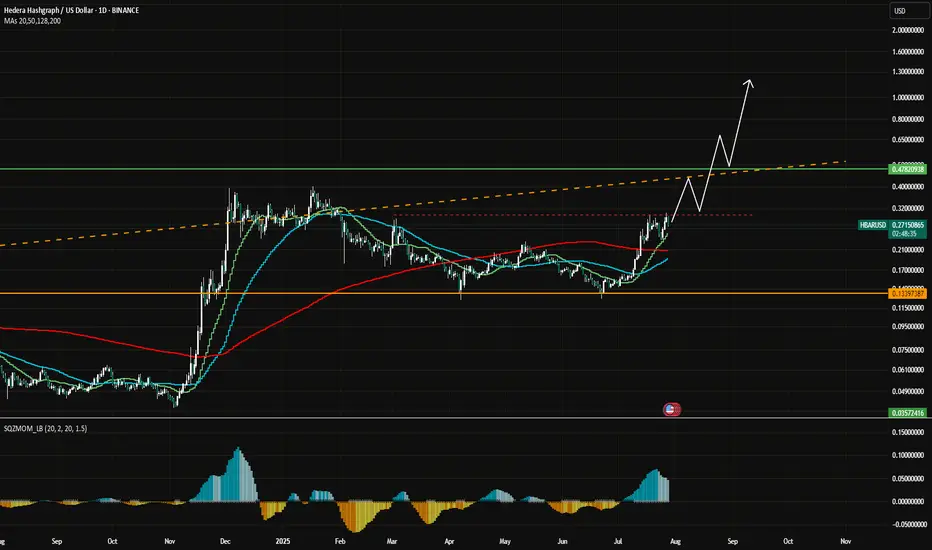
HBAR Momentum Hbar has gained some momentum lately. This is the ideal rally setup.
It has also yet to see real price discovery past .5
Large trade already opened.
DYOR, I believe this coin has a ton of potential.
Hederas' Council consists of entities like Google, IBM, Boeing Through VentureX, Standard bank.. Just to name a few.
But you all don't care about that.
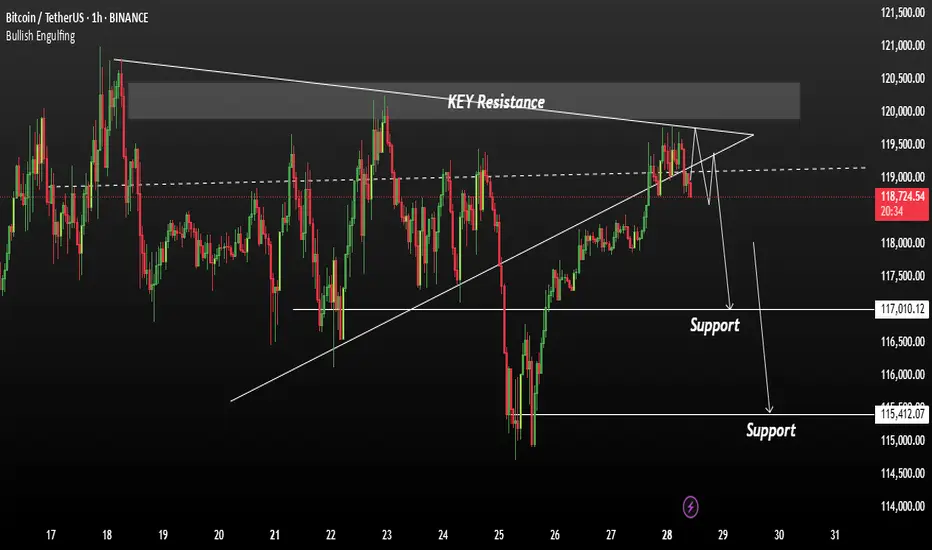
Bitcoin Could Accept bearish TrendBitcoin is currently testing a key resistance zone between 120,000 and 121,000. While price action is attempting to break higher, market conditions suggest the possibility of a false breakout rather than a sustained bullish continuation.
BTC has approached a significant resistance band, and early signs of exhaustion are visible. Unless the price decisively holds above 121,000, any breakout may lack conviction. Given the broader unresolved downtrend, a corrective move remains likely.
If the breakout fails to sustain, we anticipate a pullback toward the 117,000 to 115,000 range. This would align with a retest of previous support zones and continuation of the short-term bearish structure.
Ps: Support with like and comments for better analysis Thanks.
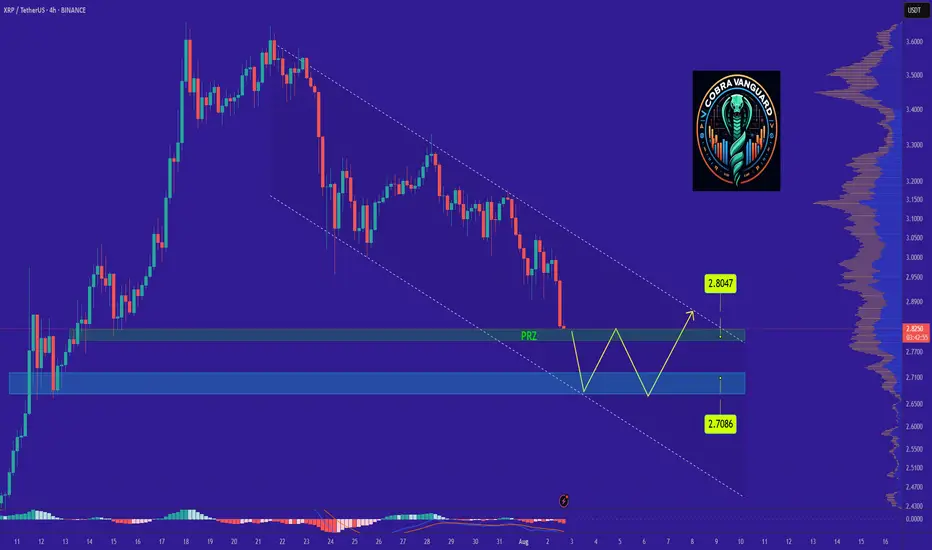
XRPs Situation (Daily) !!!If the price loses the PRZ range, it will drop to the bottom of the channel and then rise to the top of the ascending channel, which will take some time.
Best regards CobraVanguard.💚
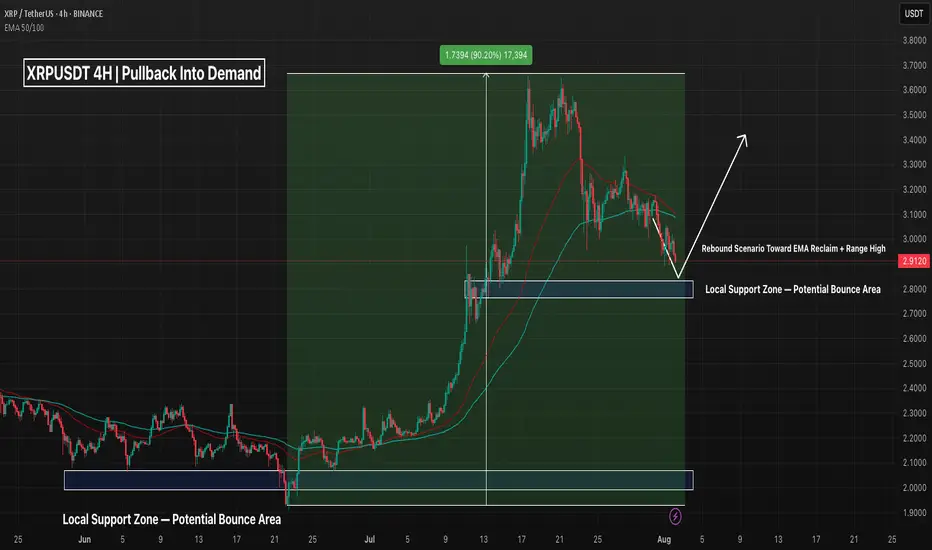
XRPUSDT 4H – Pullback Into Support, But Will This Bounce Stick?XRP has retraced nearly 25% off its local highs after a powerful +90% move in July. Price is now pulling back into a well-defined demand zone around 2.85–2.88, which previously triggered the breakout impulse.
📌 What’s notable:
Clean retest of demand + price hovering above the final bullish structure
EMAs are overhead, but not yet fully bearish — a reclaim could flip short-term bias
The lower demand zone (~2.15–2.25) still stands as a last line of defense from the original rally base
This bounce attempt is key — a strong push from here could send price back toward the $3.30–3.50 region. But if bulls fail to hold, there’s room for a deeper retracement.
Trade Planning Notes:
Aggressive Long: Entry on wick into support with tight invalidation
Conservative Long: Wait for EMA reclaim confirmation
Bearish Case: Breakdown = target $2.25 zone
The path from here decides whether this is a healthy pullback — or the start of a reversal. What’s your play? 👇
ETH Price Weakens: Watching This Strong Demand Zone Closely$ETH/USDT Analysis (12H)
Ethereum has broken below a key support zone, confirming short-term weakness in price structure.
At the same time, the RSI is showing bearish divergence, signaling slowing momentum while the price was making higher highs — a classic early warning of a potential drop.
Now all eyes are on the strong demand zone below. If ETH finds support there, we could see a solid bounce or even a full trend reversal. But if this zone fails, deeper correction may follow.
DYOR, NFA
Thanks for the reading

Bitcoin Go 70k What are you waiting for? It's going to go up more. We have a weekly negative divergence and the correction is now the entire market is bearish.
FIS/USDTFIS has shown an aggressive push from buyers, confirming strong demand as the price consistently defends the $0.10–$0.11 zone as solid support. This accumulation range has held firm despite market volatility, indicating a possible base formation. signaling momentum building for a breakout.

$adaabove 200 ema on daily
range low
deivation likely
entered now let see if we get a wick below before up saving some to bid there
time for it to ressurect

due to rsi divergence and fib zone long sol nowdue to rsi divergence and fib zone long sol now
fib golden zone triggered
demand zone triggred
rsi divergence and many other +ve sentiments
so we longged
its infinit market idea may be wrong so use sl 155$
#dyor too, im not financial advisor
