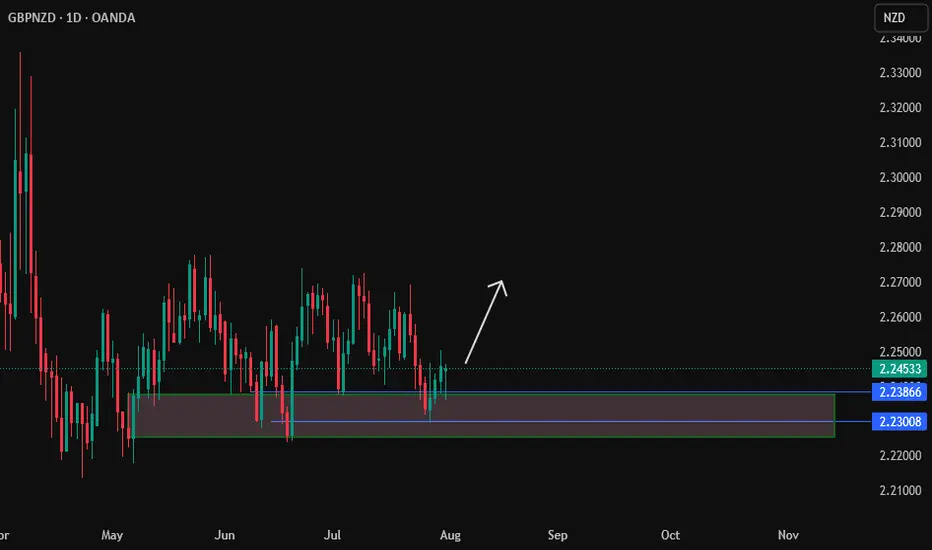
gbpnzdGBP/NZD – Set to Breakdown. Forex Strategy is Bearish: GBP/NZD is currently at 2.2479 in a range. With this breakout, we are looking for a small pullback ..
sl
down support
Forex market
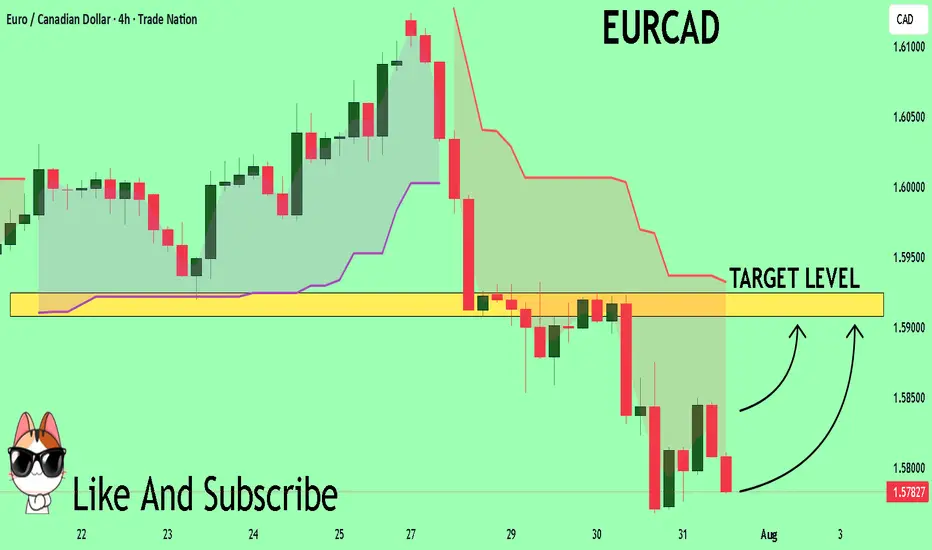
EURCAD What Next? BUY!
My dear friends,
My technical analysis for EURCAD is below:
The market is trading on 1.5784 pivot level.
Bias - Bullish
Technical Indicators: Both Super Trend & Pivot HL indicate a highly probable Bullish continuation.
Target - 1.5907
About Used Indicators:
A pivot point is a technical analysis indicator, or calculations, used to determine the overall trend of the market over different time frames.
Disclosure: I am part of Trade Nation's Influencer program and receive a monthly fee for using their TradingView charts in my analysis.
———————————
WISH YOU ALL LUCK
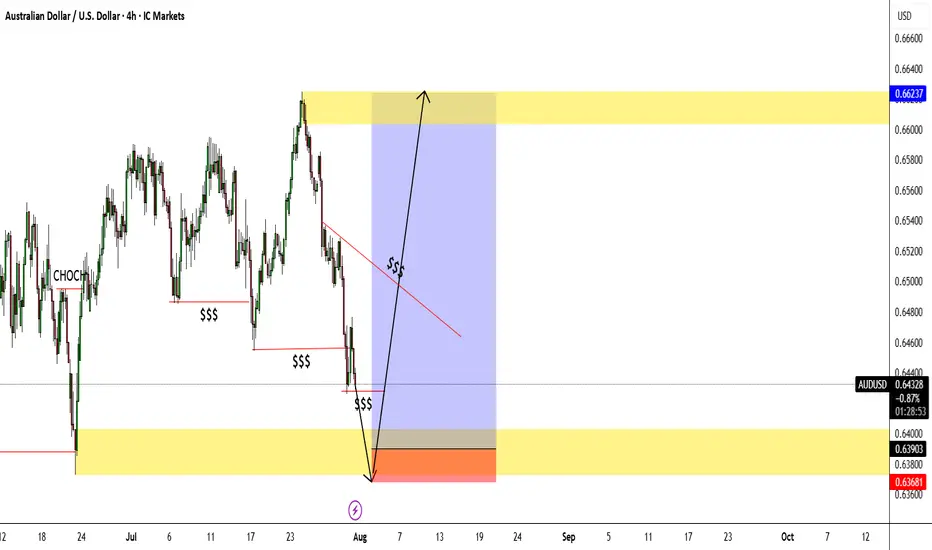
AUDUSD Will Keep Falling!
HI,Traders !
#AUDUSD keeps falling down
And the pair made a strong
Bearish breakout of the key
Horizontal key level of 0.64796
And the breakout is confirmed
So we are bearish biased and
We will be expecting a further
Bearish move down !
Comment and subscribe to help us grow !

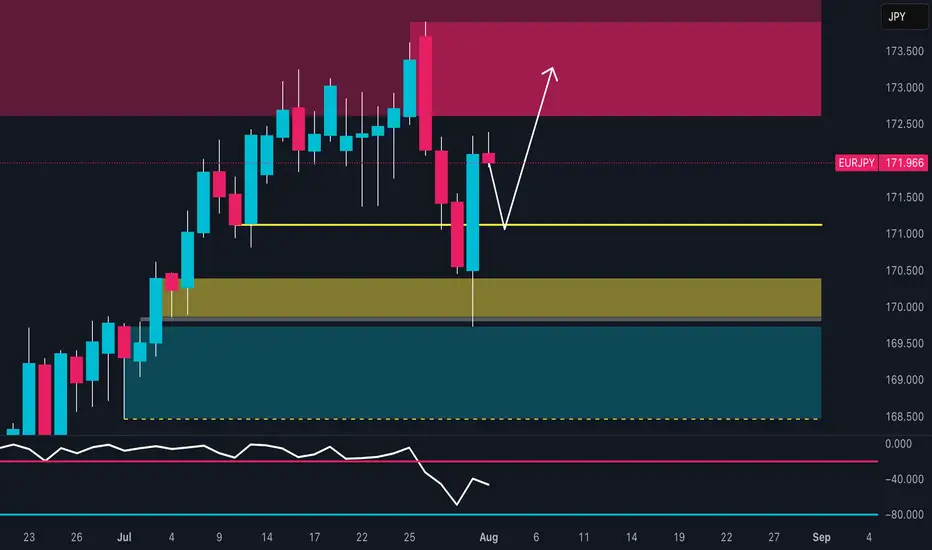
EUR/JPY Setup: Retail is 82% Short – Squeeze First, Drop After?🔹 Technical Context
Price reacted with a strong bullish wick in the 169.50–170.30 demand zone, signaling clear buyer defense. The RSI bounced from weakness but remains subdued, showing limited momentum.
📍 Current price action suggests a potential retest of the 172.50–173.30 area, which aligns with a supply zone, before a possible directional decision is made.
🗓️ Seasonality
Historically, August tends to be bearish for EUR/JPY:
5Y average: -0.48%
10Y average: -0.12%
15Y/20Y averages: -1.3% and -1.2%
📉 Seasonality indicates potential weakness, especially in the second half of the month.
🪙 COT Report (EURO & YEN) – July 22
EURO: Strong long accumulation by non-commercials (+6,284) and commercials (+17,575)
JPY: Net decline in both longs (-1,033) and shorts (-4,096), with a drop in total open interest
🧠 The market is heavily positioned on the Euro, while Yen positioning is fading. This creates a divergence between the two currencies, favoring a short-term technical bounce on EUR/JPY, though downside risks remain in the mid-term.
📉 Sentiment
82% of retail traders are short EUR/JPY
Volume: 1,564 lots short vs 352 lots long
📣 This extreme sentiment imbalance suggests a potential short-term squeeze against retail traders.
📊 Market Mood & DPO
Overall mood: Neutral
DPO at -9.0, Wyckoff score below 50
Momentum remains weak, but not showing a clear divergence.
🧩 Operational Summary
Retest of the 172.50–173.30 supply zone
Likely exhaustion in that area
Ideal setup: rejection + bearish confirmation
→ Targets: 170.30, then 169.00
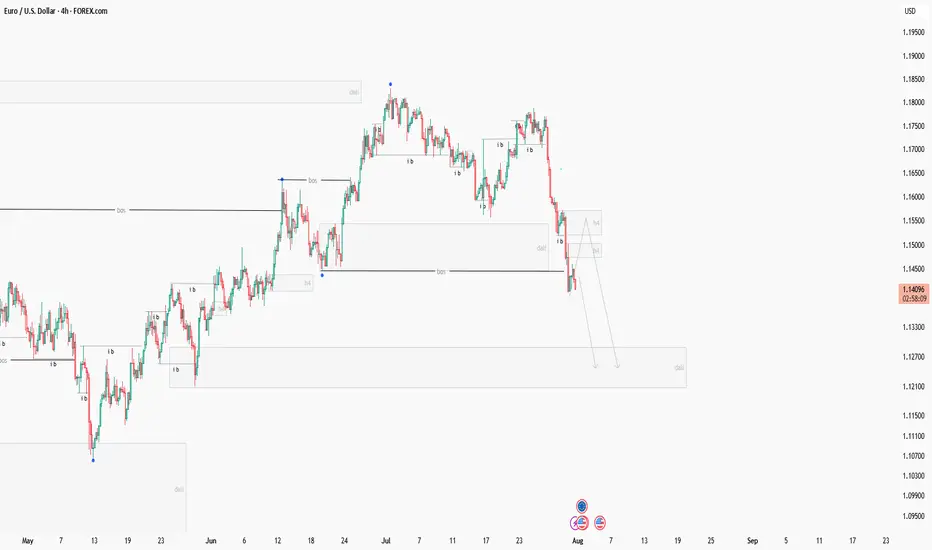
My opinion on the euro to dollarI think the trend is bearish in the medium term, although we may have an upward correction first, so you can wait to enter when shorting.
AUDUSD longs!!!Hello everyone
My bias towards AUDUSD is looking bullish and these are my reasons on why.
1. Price started to consolidate between 14/05/25 to 23/06/25 which caused price to take out EQL'S and create a CHOCH to the upside.
2. Price has than created many more consolidation patterns followed by EQL's raids as well.
3. I am hoping price will return back to my 4hr demand zone to go long again.
Looking for either market entry or buy limit not sure yet will find out as time goes by.
USDCHF Short ProjectHi guys...😎
It's time to do a Short Project on USDCHF with 3 key reasons:
1. Price Drivers: Weekly Supply
2. Weekly Trend: down
3. Momentum: bearish
Action: waiting for entry on the intraday timeframe (entry will be published further)


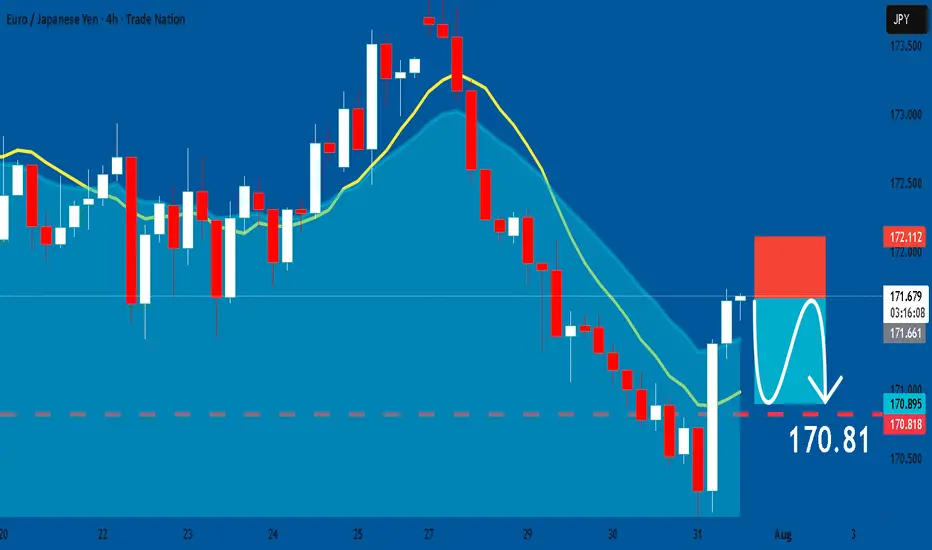
EURJPY: Short Trade Explained
EURJPY
- Classic bearish formation
- Our team expects pullback
SUGGESTED TRADE:
Swing Trade
Short EURJPY
Entry - 171.66
Sl - 172.11
Tp - 170.81
Our Risk - 1%
Start protection of your profits from lower levels
Disclosure: I am part of Trade Nation's Influencer program and receive a monthly fee for using their TradingView charts in my analysis.
❤️ Please, support our work with like & comment! ❤️
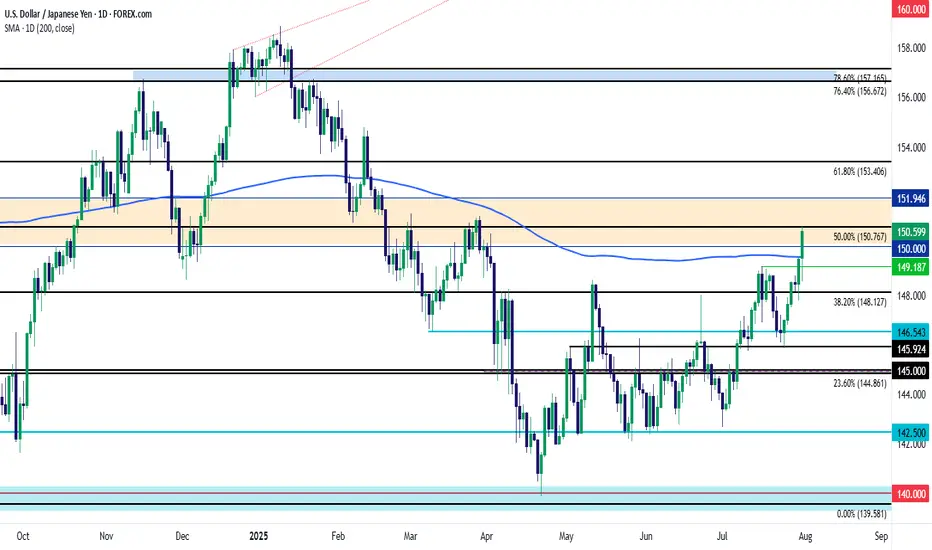
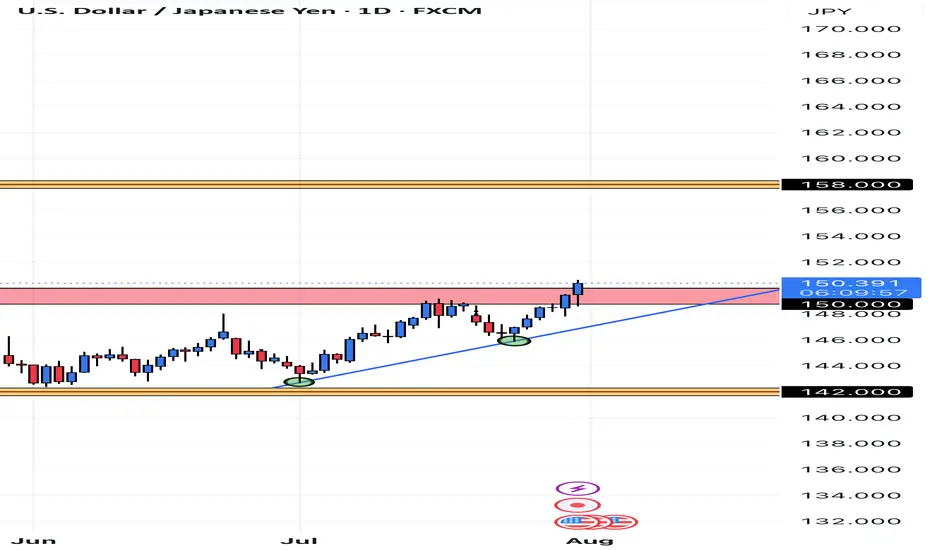
USD/JPY BreakoutUSD/JPY has had a big week already and the pair has shown a decisive breakout through a massive spot of resistance on the chart.
Coming into the week the 148.00 zone had been problematic for bulls in the pair since early-Q2 trade. But with the combined force of FOMC and the Bank of Japan, bulls have finally been able to prod a breakout and leave that zone behind. And the move has continued to press, with a breach of the 150.00 psychological level and price is now approaching the Fibonacci level at 150.77.
Chasing is a challenge at this point but given that prior resistance there's now multiple spots to track for support potential on pullbacks. The 150.00 level is an obvious one, but there's also the 200-day moving average which currently plots around 149.55 and there's the prior high of 149.19. Even the Fibonacci level at 148.13 could be of interest for that in prolonged pullback scenarios, given how it had played as support on Wednesday ahead of the FOMC announcement. The key for that level would be prices holding a higher-low, illustrating a degree of bullish defense at that price. - js
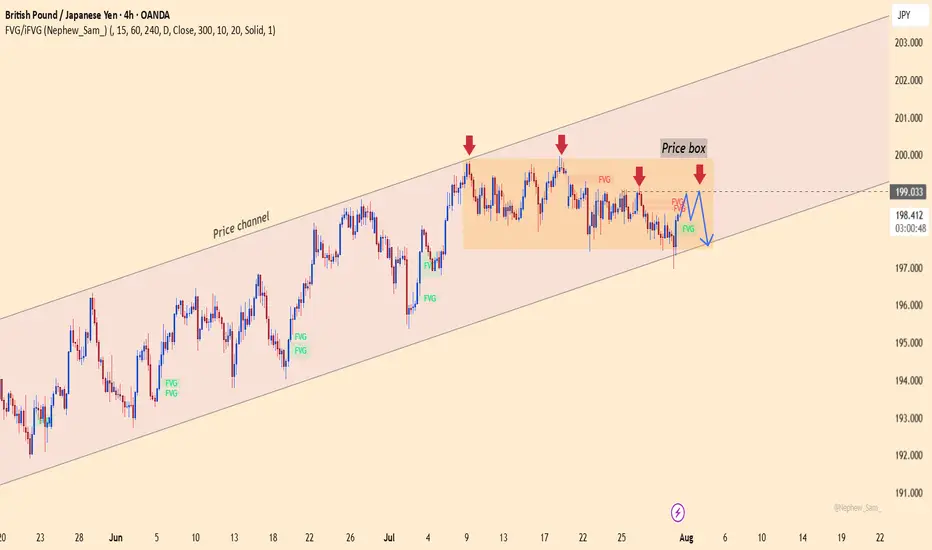
GBPJPY – Losing control zone, downtrend taking shapeGBPJPY is still trading within a long-term ascending price channel. However, what’s concerning is that recent price action has broken out of the previously established price box – which had acted as a stabilizing structure for the uptrend. Buyers failed to maintain momentum, repeatedly getting rejected at the top of the box.
Currently, GBPJPY is showing signs of breaking below the short-term support inside the price box, raising the risk of a deeper correction toward the lower boundary of the channel. A “lower high” structure is clearly forming, confirming that selling pressure is taking over.
From a news perspective, the Japanese yen is gaining strength as risk-off sentiment increases, while the pound is losing ground due to cautious tones from the Bank of England following a string of weak economic data. This shift is weakening GBP's appeal and could accelerate the bearish trend.
Strategy:
Wait to SELL if price pulls back to the former resistance zone within the price box and shows rejection signals. The downtrend will be confirmed if the recent low is broken. Stay out if there’s no clear confirmation.
What do you think will happen next with GBPJPY?
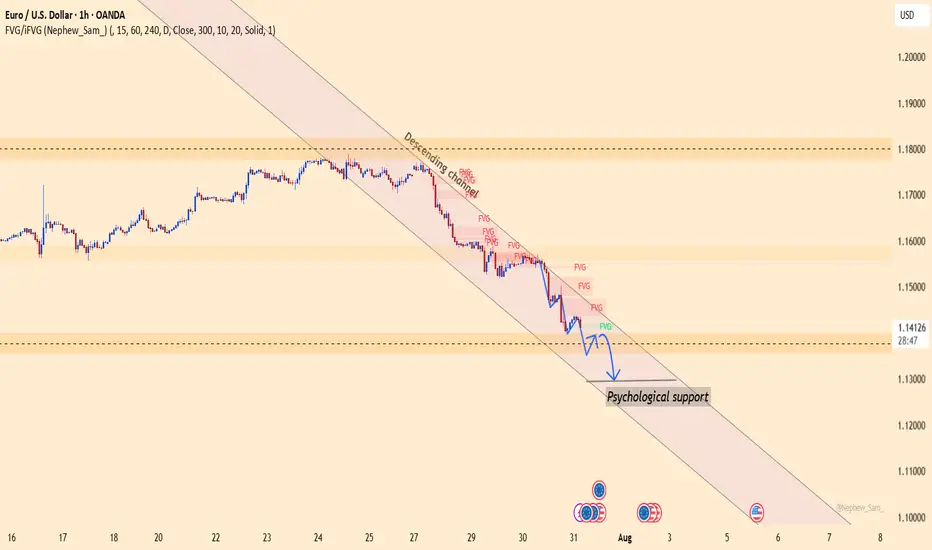
EURUSD plunges without brakes – The bears take full control!EURUSD continues its steep decline as both macroeconomic and technical pressures mount. A trade deal unfavorable to the EU, combined with the Fed’s hawkish stance, has fueled USD strength and dragged the euro sharply lower. At the same time, strong U.S. labor data and rising employment costs further reinforce the bearish outlook.
On the H1 chart, EURUSD is clearly moving within a descending channel. Key price zones have been broken with no significant bullish reaction, indicating that sellers remain firmly in control. The market is heading toward a psychological support area, with no signs of reversal as RSI stays weak.
I remain biased toward SELL setups on any short-term pullbacks, avoiding countertrend trades in this environment. If downside momentum continues, deeper targets may still be ahead.
In a market dominated by bearish sentiment, trading with the trend remains the smartest and safest approach.
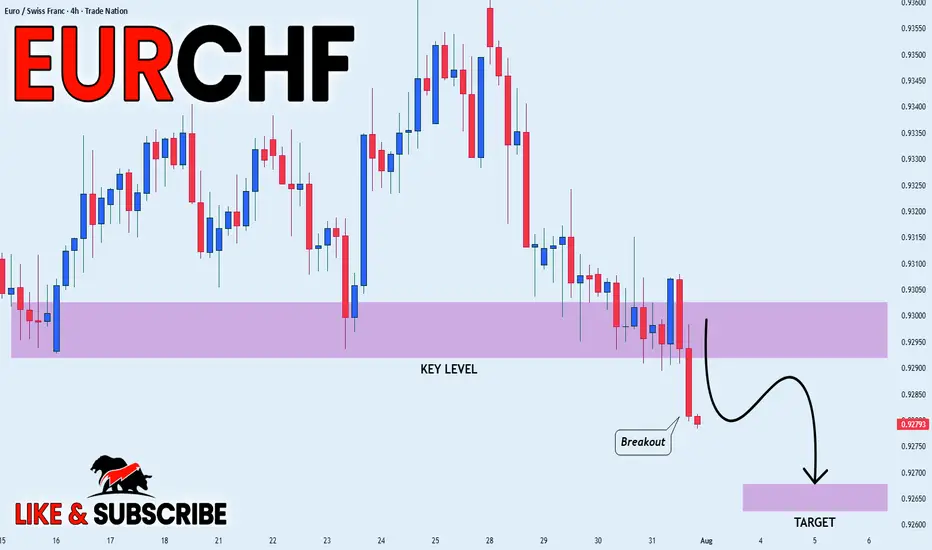
EUR_CHF WILL KEEP FALLING|SHORT|
✅EUR_CHF broke the key
Structure level of 0.9295
While trading in an local downtrend
Which makes me bearish
And I think that after the retest of the
Broken level is complete
A rebound and bearish
Continuation will follow
SHORT🔥
✅Like and subscribe to never miss a new idea!✅
Disclosure: I am part of Trade Nation's Influencer program and receive a monthly fee for using their TradingView charts in my analysis.
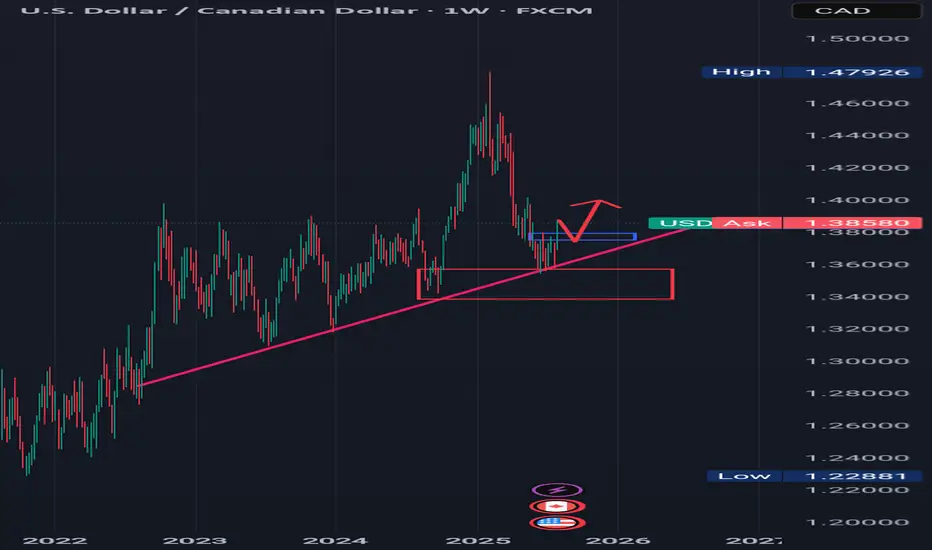
TREND REVERSAL CONFIRMATION Looking at the weekly timeframe for USDCAD, we can see that price action has respected a rising trendline and also reacted to a weekly bullish order block.
The Sell momentum for USDCAD has come to an end, so now we saw price action accumulating around the rising trend line and bullish order block.
Now there's a minor resistance which is indicated with a small blue rectangle in which price action has broken to the upside, I'm expecting price to complete an impulse correction leg or retrace to the blue rectangle or minor resistance and then from there continue to the upside.
........,...,.............................................
Please share your thoughts on this analysis, do you think the downward trend is over.
USDJPY: The Fed & BOJ Likely To Keep Rates In Place. Buy It!Welcome back to the Weekly Forex Forecast for the week of July 28 - Aug 1st.
In this video, we will analyze the following FX market:
USDJPY
The FED and BOJ are expected to keep their perspective interest rates, come Wednesday. The USD is stabilizing, a US-Japanese tariff deal inked, and investors are slowing moving money from the Yen safe haven to riskier assets.
Look for USDJPY to slowly move higher.
Enjoy!
May profits be upon you.
Leave any questions or comments in the comment section.
I appreciate any feedback from my viewers!
Like and/or subscribe if you want more accurate analysis.
Thank you so much!
Disclaimer:
I do not provide personal investment advice and I am not a qualified licensed investment advisor.
All information found here, including any ideas, opinions, views, predictions, forecasts, commentaries, suggestions, expressed or implied herein, are for informational, entertainment or educational purposes only and should not be construed as personal investment advice. While the information provided is believed to be accurate, it may include errors or inaccuracies.
I will not and cannot be held liable for any actions you take as a result of anything you read here.
Conduct your own due diligence, or consult a licensed financial advisor or broker before making any and all investment decisions. Any investments, trades, speculations, or decisions made on the basis of any information found on this channel, expressed or implied herein, are committed at your own risk, financial or otherwise.

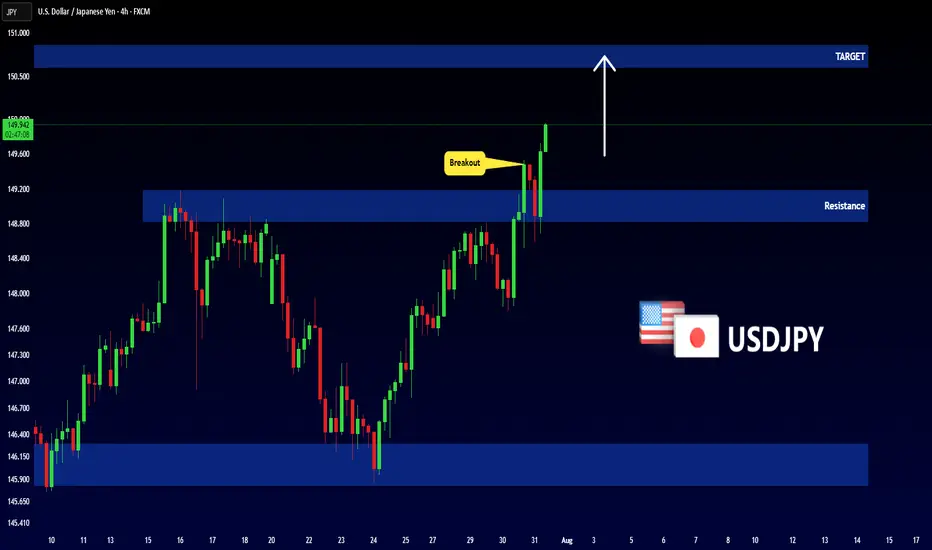
USDJPY - NEW BREAKOUT !Hello Traders !
The USDJPY broke the resistance level (148.831 - 149.185).
This key level becomes new support!
So, I expect a bullish move🚀
_______________
TARGET: 150.605🎯
GBPJPYDate:
July 31,2025
Session:
New York Session
Pair:
GBPJPY
Bias:
Long
Liquidity from Monday's London session was swept in today's (Thursday) New York and London Session. Now I see price following the trend downward.
Entry: 199.080
Stop Loss: 199.387
Target: 198.207
RR: 2.90

USDCAD Wave Analysis – 31 July 2025
- USDCAD broke resistance zone
- Likely rise to resistance level 1.3900
USDCAD currency pair recently broke the resistance zone located between the resistance level 1.3785 (upper border of the sideways price range from the start of June) and the 50% Fibonacci correction of the downward impulse from May.
The breakout of this resistance zone accelerated the active impulse wave 3, which belongs to medium-term impulse wave (B) from the start of July.
USDCAD currency pair can be expected to rise further to the next resistance level 1.3900 (target price for the completion of the active impulse wave 3).

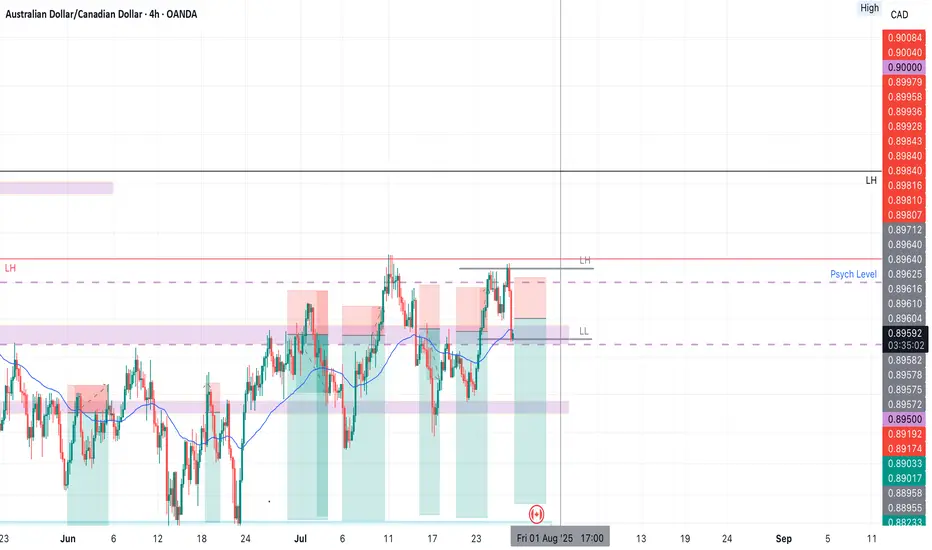
AUDCAD SHORT Market structure bearish on HTFs 3
Entry at both Daily and Weekly AOi
Weekly Rejection at AOi
Previous Weekly Structure Point
Daily Rejection at AOi
Previous Structure point Daily
Around Psych Level 0.90000
H4 EMA retest
H4 Candlestick rejection
Rejection from Previous structure
Levels 4.51
Entry 120%
REMEMBER : Trading is a Game Of Probability
: Manage Your Risk
: Be Patient
: Every Moment Is Unique
: Rinse, Wash, Repeat!
: Christ is King.
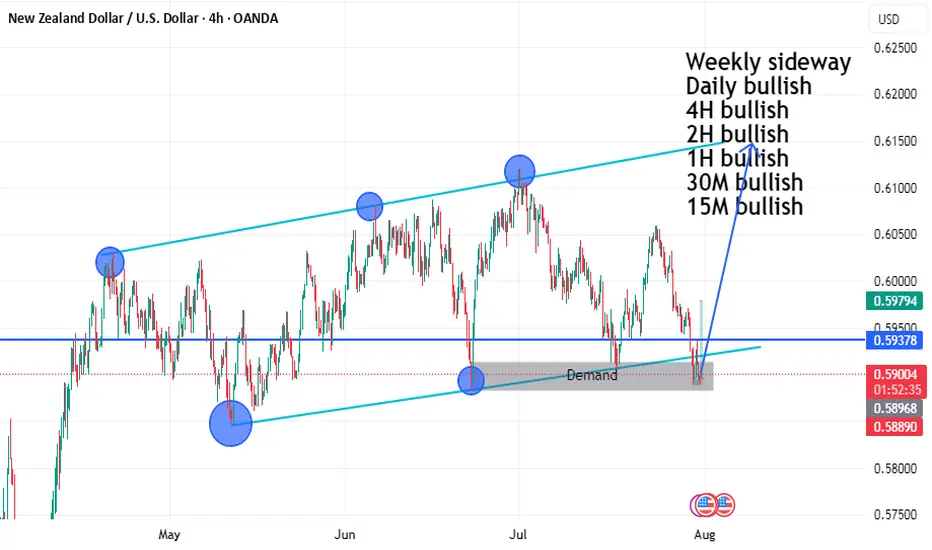
NZDUSD BUY SETUP LOOOOOOOONGHELLO
we have demand and ascending channel 4h
and low time frame the price make engulfing candle on 30m 15m on support zone
and can't make lower low so i will buy it
USDCAD BUY OPPORTUNITY Price is looking quite interesting for a buy opportunity from the current market price. We can see how price recently rebounded from the dynamic resistance and support trendline. It’s signaling a possible buy opportunity.

USDJPY HEADING UPThe daily time frame is showing potential bullish movement, seemingly forming structure after daily consolidation. Price bounced off of support and formed a higher low, a third retest of the bullish trend line will further validate this.
GBPNZDI would like to share this complex correction. Here I'm looking to take this to the blue box before a drops
