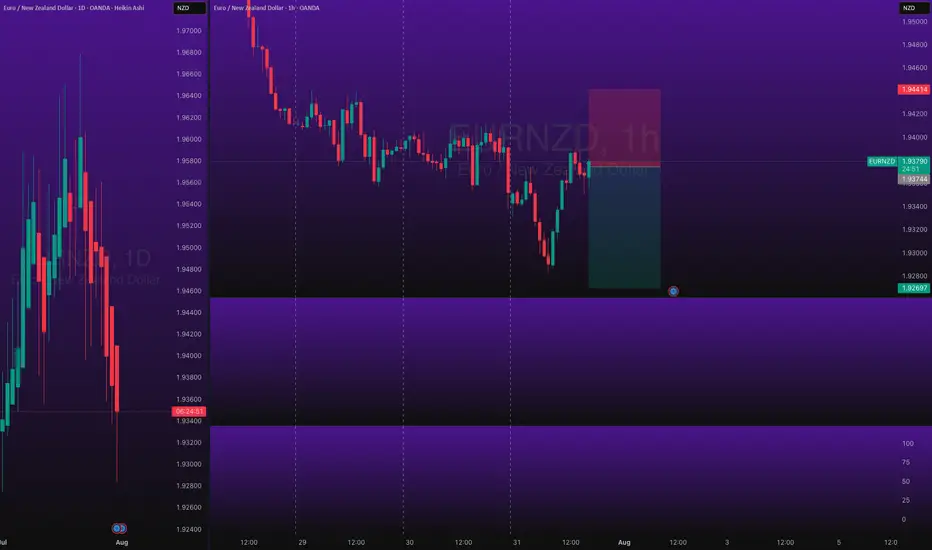
EURNZD Short Day TradeOANDA:EURNZD Short Day Trade - Low Risk, with my back testing of this strategy, it hits multiple possible take profits, manage your position accordingly.
Note: Manage your risk yourself, its risky trade, see how much your can risk yourself on this trade.
Use proper risk management
Looks like good trade.
Lets monitor.
Use proper risk management.
Disclaimer: only idea, not advice
Forex market
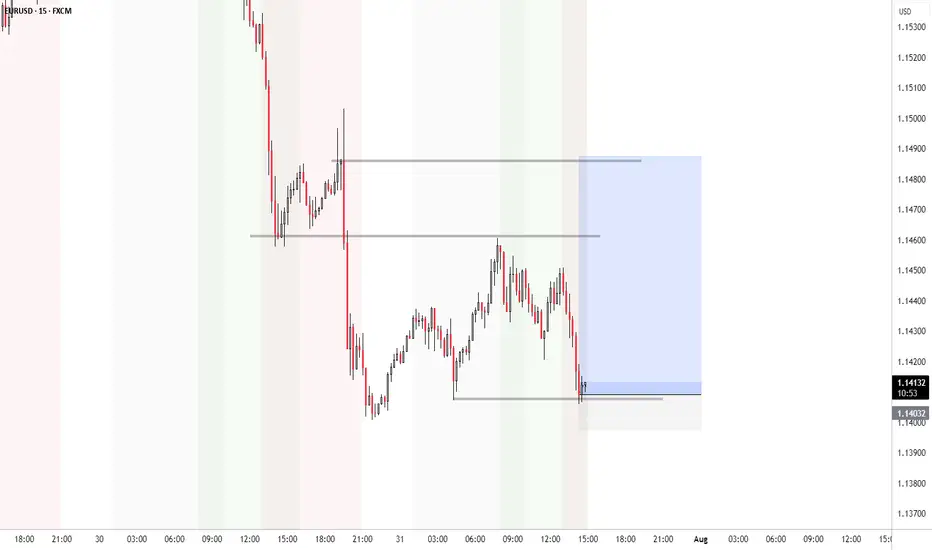
EURUSD Outlook – From Bias to Execution Previous day closed bearish, leading to a sell bias, on the 45M, I marked my possible entry and exit area.

AUD/USD Rejected at Resistance-Fed on TapYesterday’s Fed-induced sell-off broke through the monthly opening-range lows / 52-week moving average with the bears now poised to mark a sixth-consecutive daily decline.
It's worth noting that weekly momentum peaked at 60 on the April advance with RSI now poised to close back below 50. The observation suggests the broader downtrend remains intact and a pivot / break below slope support could mark trend resumption.
Initial weekly support is eyed with the February high at 6408 and is backed by the 38.2% retracement of the yearly range / February high-week close (HWC) at 6354/57. A break / daily close below this region would be required to suggest that a more significant high is in place, potentially signaling a larger reversal underway. In such a scenario, the next downside objectives would be the yearly low-week close and 2023 low-close at 6291/96, followed by the 61.8% retracement and 2022 low-close at 6186–6201. Both of these zones are key areas of interest for potential downside exhaustion / price inflection IF reached.
Look for initial resistance back at the 52-week moving average (currently ~6460) with key resistance now seen back at the 61.8% retracement / yearly high-close at 6550/77. Note that the upper parallel converges on this threshold over the next few weeks and further highlights the technical significance of this zone. Ultimately a breach / weekly close above the 2021 trendline (red) would be needed to validate a breakout of the multi-year downtrend in Aussie.
Bottom line: A reversal off downtrend resistance is now approaching initial support- risk for trend resumption heading into August. From a trading standpoint, the immediate focus is on the weekly close with respect to 6400- rallies should be limited to the 52-week moving average IF Aussie is heading lower on this stretch with a close below needed to keep the immediate short-bias viable heading into the monthly cross.
Keep in mind we get the release of key US employment data tomorrow with Non-Farm Payrolls on tap. Stay nimble into the release and watch the weekly close / August opening-range for guidance for guidance.
-MB

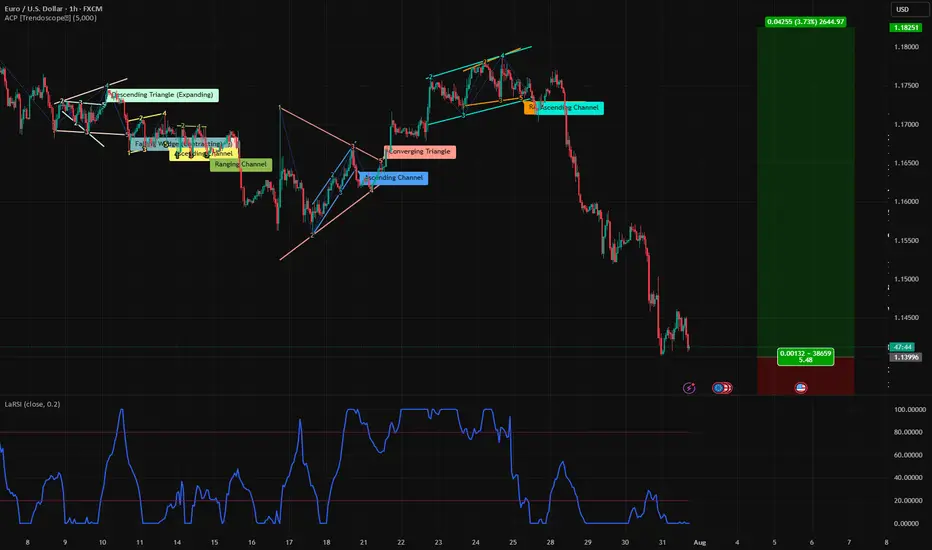
Trade Bias: I’m looking to buy EURUSD, but only on confirmationFading Fear, Not Chasing Highs 💡💶
This isn’t about momentum. It’s about patience. EURUSD has been under pressure, but I’m not selling panic — I’m watching for a buy signal to fade the current selloff. With dollar fundamentals shifting, this pullback could be setting up opportunity — not continuation.
📈 Trade Bias: I’m looking to buy EURUSD, but only on confirmation the sell pressure is cooling.
Here’s the fundamental picture:
✅ US growth is slowing; Q1 GDP contracted slightly
📉 Dollar bears are at a 4-year high, signaling sentiment exhaustion
🔁 ECB paused cuts, holding steady at 2.15% — EUR fundamentals are stabilizing
💬 US tariffs could push inflation up, but squeeze household demand
⚠️ I’m not expecting new highs — just a relief move once the selling slows
The dollar is caught in a tug-of-war: economic data remains decent, but traders don’t buy it. Sentiment is skewed — hedge funds are heavily short USD, not because the economy is collapsing, but due to fiscal worries, policy confusion, and long-term structural cracks. This creates space for countertrend moves.
The euro isn’t roaring either — but it's no longer cutting rates, and confidence is picking up. A recent uptrend has cooled, and the pair is now consolidating. If we see signs of selling exhaustion, I’ll be watching for an entry.
I’m not buying blindly. I’m waiting for the fear to burn out. Would you fade this dip too — or are you staying out? 👇
GBP/USD Professional Analysis – “Trap Trigger at Support”GBP/USD Professional Analysis – “Trap Trigger at Support”
📈 Market Overview:
• Pair: GBP/USD
• Timeframe: Likely 1H or 2H based on candle spacing
• Date: July 28, 2025
• Current Price: 1.33529
⸻
🔍 Technical Breakdown
🔴 Resistance Zone: 1.35800 – 1.36200
• Strong supply area where the last bullish impulse failed.
• Price got rejected hard, initiating a new downtrend.
• Sell-side pressure was confirmed with Supertrend turning red.
🟤 Support Zone: 1.32860 – 1.33400
• Major demand area where price previously reversed sharply.
• Currently being tested again after a clean sweep into the Trap Trigger zone.
⚠ Trap Trigger Zone (Liquidity Sweep Area):
• Price wicked just below support, tapping into a low-volume/high-liquidity area.
• This wick likely cleared sell-side liquidity and trapped breakout sellers.
• Followed by a bullish rejection wick, implying smart money accumulation.
⸻
🛠 Indicators & Tools:
• Supertrend (10,3): Currently red, indicating short-term bearish momentum.
• However, if price closes above 1.34032 (Supertrend level), it could flip bullish.
• Volume Profile (VRVP):
• Low-volume node under support suggests a quick “stop hunt” move, not genuine selling.
• High-volume acceptance area sits higher, near 1.34500–1.35000.
⸻
🎯 Forecast:
🔴 Bearish Invalidations:
• Price closing below 1.32860 with volume would invalidate this setup.
• That could signal continuation to deeper liquidity (1.32500 or below).
⸻
🧠 Smart Money Perspective:
• Liquidity engineered beneath support
• Trap Trigger activated — ideal for institutional reversal setups
• This is a classic “Stop Hunt → Reclaim → Expand” model

EURUSD BULLISH TREND EUR/USD is expected to remain in its bearish trend until it approaches the key support levels around 1.11290 to 1.09744. These zones could serve as potential turning points, where a bullish reversal may emerge if supported by fundamental or technical catalysts.

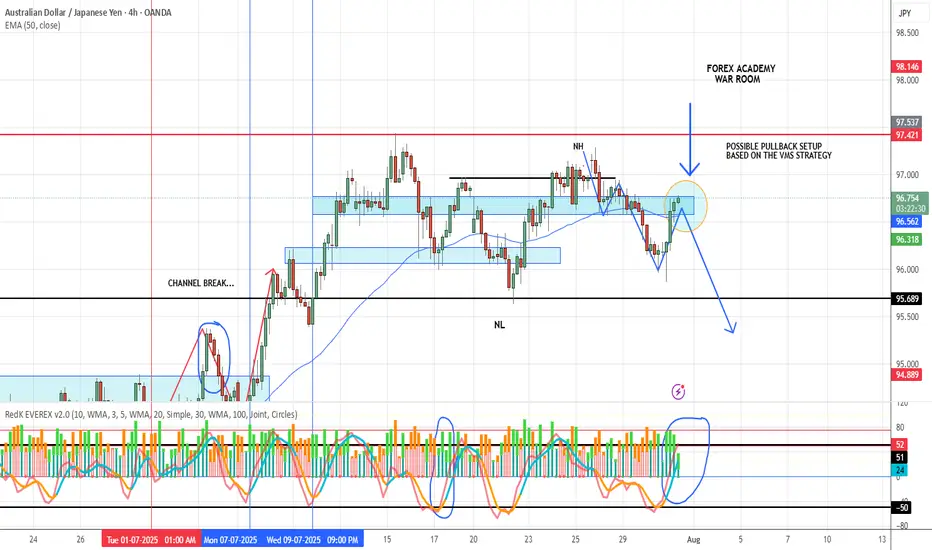
AUD/JPY POSSIBLE SETUPThis pair has made a clean 3-leg pullback into a solid resistance zone.
Price action is now near the 50 EMA — a key area we watch closely.
From here, we’re waiting for confirmation:
✅ Strong volume
✅ Aligned momentum
✅ A clear engulfing candle
If all of that lines up, we’ll drop to the 1-hour chart and look for a precise entry trigger using the VMS strategy.
Patience first. Execution second.
Let the setup come to you.
#GBPUSD ALMAZOV PROJECTION DAILYPrice projection according to Almazov's theory, #GBPUSD should at least touch $1.31500 - before going up, we wait for the initial condition to enter a long position, to reach the Daily Spike f 261.8.

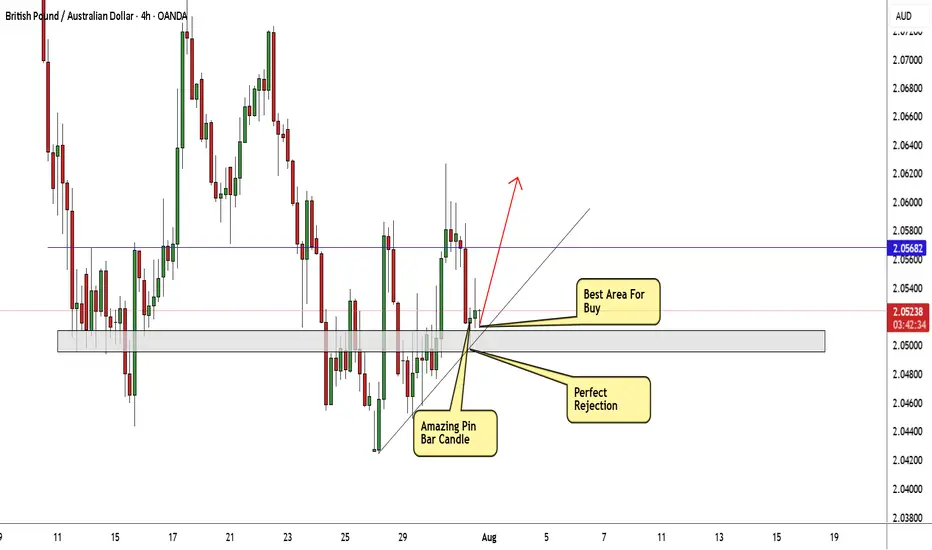
GBP/AUD At Very Interesting Buy Area , Don`t Miss 150 Pips !Here is my GBP/AUD 4H Chart and this is my opinion , the price moved very hard to downside And now creating new wave in the 4H Up Trendline and the price at strong support now 2.05000 which is forced the price many times to go up , so it`s my best place to enter a buy trade , and if you checked the chart you will see the price creating the new higher low to complete the new higher high . if we have a daily closure below my support area then this idea will not be valid anymore .
AUDJPY Bullish Continuation Key Support and Resistance Levels
Resistance Level 1: 97.527
Resistance Level 2: 98.091
Resistance Level 3: 99.00
Support Level 1: 96.00
Support Level 2: 95.574
Support Level 3: 95.060
This communication is for informational purposes only and should not be viewed as any form of recommendation as to a particular course of action or as investment advice. It is not intended as an offer or solicitation for the purchase or sale of any financial instrument or as an official confirmation of any transaction. Opinions, estimates and assumptions expressed herein are made as of the date of this communication and are subject to change without notice. This communication has been prepared based upon information, including market prices, data and other information, believed to be reliable; however, Trade Nation does not warrant its completeness or accuracy. All market prices and market data contained in or attached to this communication are indicative and subject to change without notice.

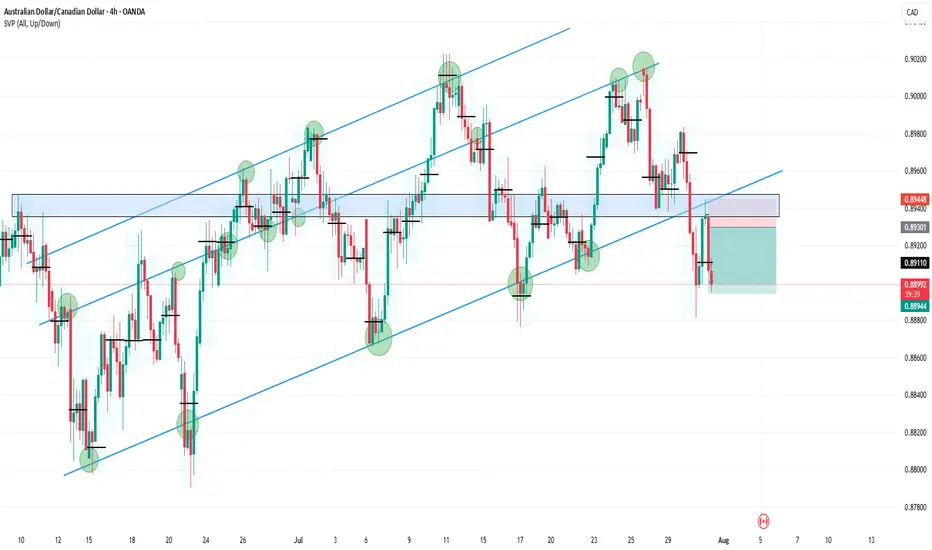
AUDCAD4HR:
The price broke down from a double parallel channel, forming a lower low, which confirms a bearish bias. It then pulled back to retest the broken channel and resistance, where a long-wick candle rejection occurred.
This rejection also aligned with multiple previous Points of Control (POC), adding confluence.
Afterward, a shift from bullish to bearish was confirmed on the 15-minute timeframe.
A clean 1:2 risk-reward trade setup followed.
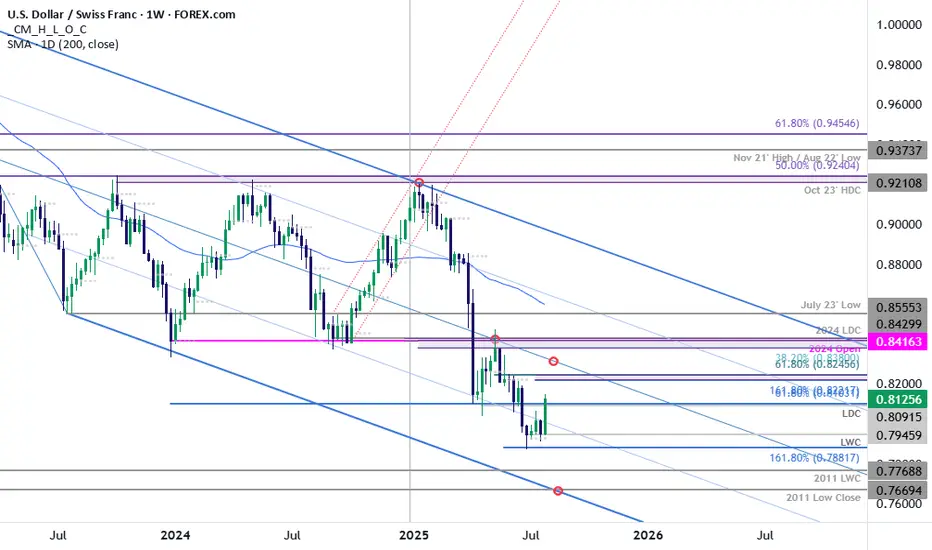
USD/CHF Rally Threatens ReversalThe July opening range broke to the topside on the heels of yesterday’s FOMC rate decision and takes USD/CHF back above the 25% parallel- a weekly close back above the April lows at 8040 tomorrow would suggest a more significant low is in place / a larger reversal is underway. Look for initial support near 8103 today for guidance.
Initial topside resistance objectives eyed at the 1.618% extension of the monthly advance and the 61.8% retracement of the May decline at 8222/46 backed by the median line, currently near the 83-handle. Key lateral resistance stands at 8380-8416- a region defined by the 38.2% retracement of the yearly range, the 2024 low-close, the 2023 low-week close (LWC) and the 2024 yearly open (an area of interest for possible topside exhaustion / price inflection IF reached).
Support rests at the yearly LWC at 7946 with a break / close below 7881 needed to mark resumption of the broader multi-year downtrend. Subsequent support objectives seen at the 2011 LWC at 7769 and the 2011 low-close at 7669.
Bottom line: USD/CHF is threatening a larger reversal within the broader downtrend. From a trading standpoint, losses would need to be limited to 8040 IF price is heading higher on this stretch with weekly close above 8103 on Friday needed to keep the immediate advance viable into the August open.
-MB
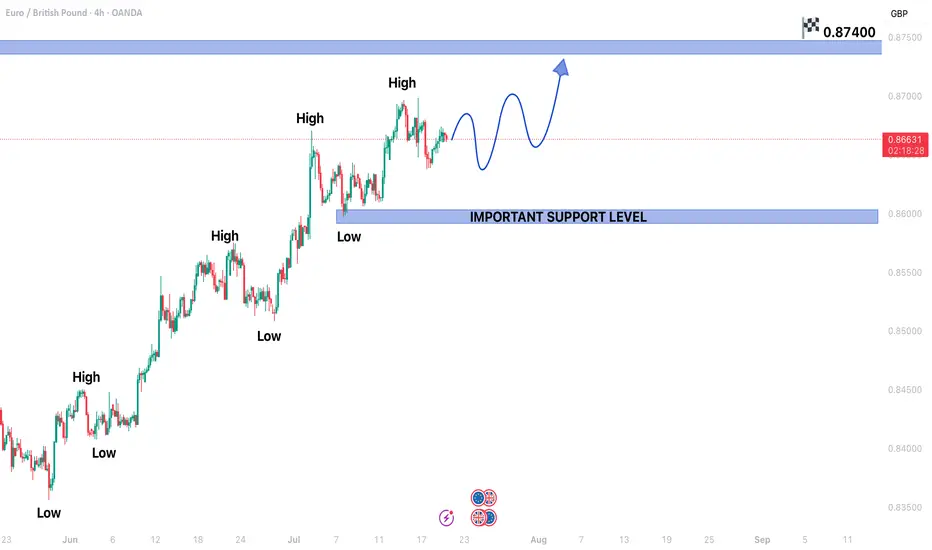
EURGBP key support at 0.8613The EURGBP remains in a bullish trend, with recent price action showing signs of a corrective pullback within the broader uptrend.
Support Zone: 0.8613 – a key level from previous consolidation. Price is currently testing or approaching this level.
A bullish rebound from 0.8613 would confirm ongoing upside momentum, with potential targets at:
0.8708 – initial resistance
0.8740 – psychological and structural level
0.8770 – extended resistance on the longer-term chart
Bearish Scenario:
A confirmed break and daily close below 0.8613 would weaken the bullish outlook and suggest deeper downside risk toward:
0.8580 – minor support
0.8544 – stronger support and potential demand zone
Outlook:
Bullish bias remains intact while the EURGBP holds above 0.8613 A sustained break below this level could shift momentum to the downside in the short term.
This communication is for informational purposes only and should not be viewed as any form of recommendation as to a particular course of action or as investment advice. It is not intended as an offer or solicitation for the purchase or sale of any financial instrument or as an official confirmation of any transaction. Opinions, estimates and assumptions expressed herein are made as of the date of this communication and are subject to change without notice. This communication has been prepared based upon information, including market prices, data and other information, believed to be reliable; however, Trade Nation does not warrant its completeness or accuracy. All market prices and market data contained in or attached to this communication are indicative and subject to change without notice.

EURGBP CONTINUING BULLISH TREND STRUCTUREEURGBP CONTINUING BULLISH TREND STRUCTURE IN 4H TIME FRAME.
Price is currently in a secondary trend.
Price is expected to end the secondary trend and start primary trend again.
On higher side market may hit the targets of 0.87400
On lower side 0.85950 may act as a key support level.
BoJ keep interest rate unchanged, yen weakeningFollowing the July meeting, the BoJ maintained its interest rate at 0.5%, citing prevailing uncertainties from trade tariffs. Concurrently, the BoJ revised its inflation forecast upward to 2.7% YoY from 2.2%. The central bank's language on economic uncertainty has become less pessimistic, downgrading trade policy risks from "extremely high" to "high uncertainties remain," which signals a growing, albeit cautious, confidence in the economic outlook.
In the US, the June PCE surged to 2.6% YoY, surpassing the 2.5% prev. cons. The increase was attributed to tariff impacts, with Goods prices rising 0.4% MoM, the fastest pace since January, while Services prices held steady at 0.2% MoM.
The higher-than-expected US PCE data and the BoJ's decision to hold interest rates have continued to drive further appreciation of the USDJPY.
USD/JPY Technical Analysis
The USD/JPY pair is trading above its EMAs extensions, signaling a continuation of the bullish momentum. The price has successfully breached the ascending resistance trendline. However, the RSI is in overbought territory, suggesting that the current rally may be extended, and a potential pullback could be imminent.
The pair could continue to test the resistance level at 151.367. Should it fail to break this level, a rebound could see the USD/JPY pair test the support at 149.65.
By Van Ha Trinh - Financial Market Strategist at Exness

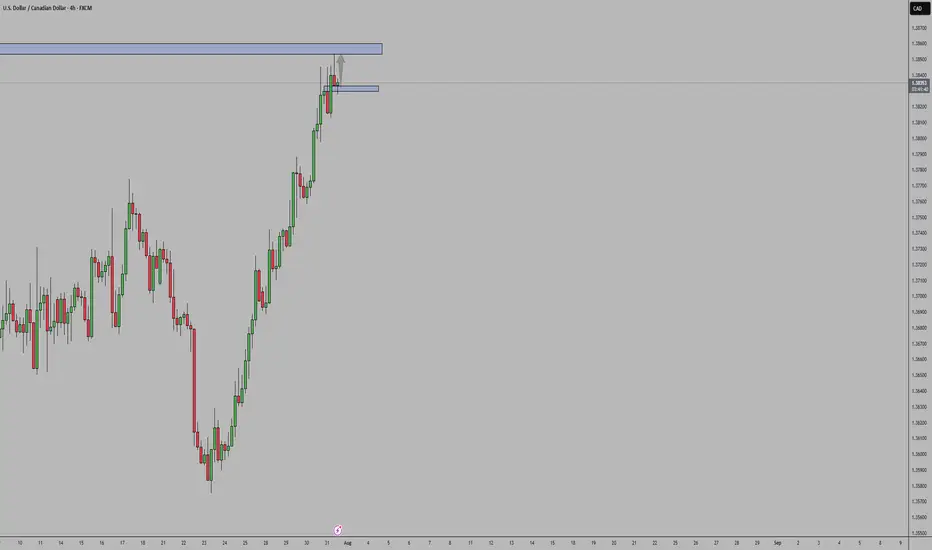
USDCADSupport Zone: Price has retested a strong support area
Price Action: The retest held — buyers defended it, showing rejection wicks / bullish candles.
Bias: Bullish while support holds → look for continuation to next resistance.
Invalidation: Bias weakens if support breaks and closes below the zone.
So as long as price stays above the retested support, USD/CAD remains bullish.
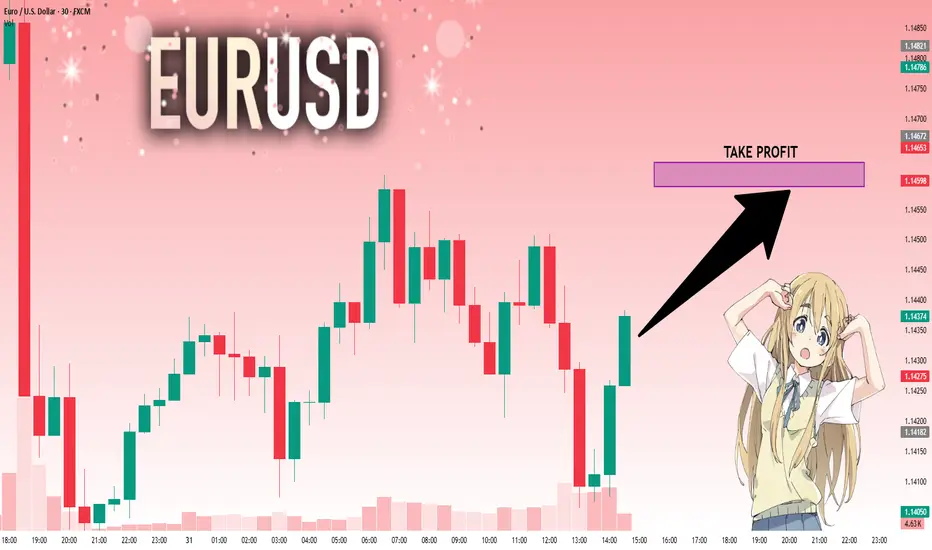
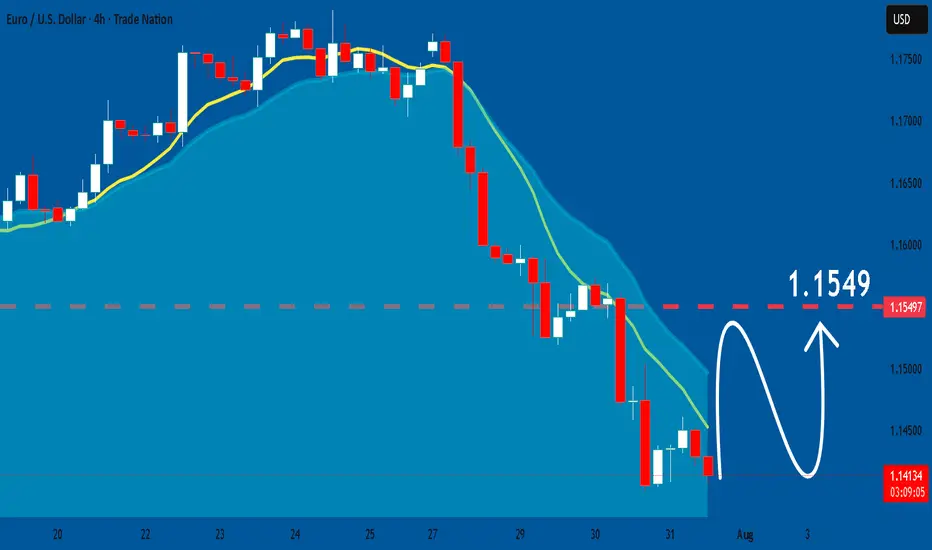
EURUSD: The Market Is Looking Up! Long!
My dear friends,
Today we will analyse EURUSD together☺️
The price is near a wide key level
and the pair is approaching a significant decision level of 1.14350 Therefore, a strong bullish reaction here could determine the next move up.We will watch for a confirmation candle, and then target the next key level of 1.14588.Recommend Stop-loss is beyond the current level.
❤️Sending you lots of Love and Hugs❤️
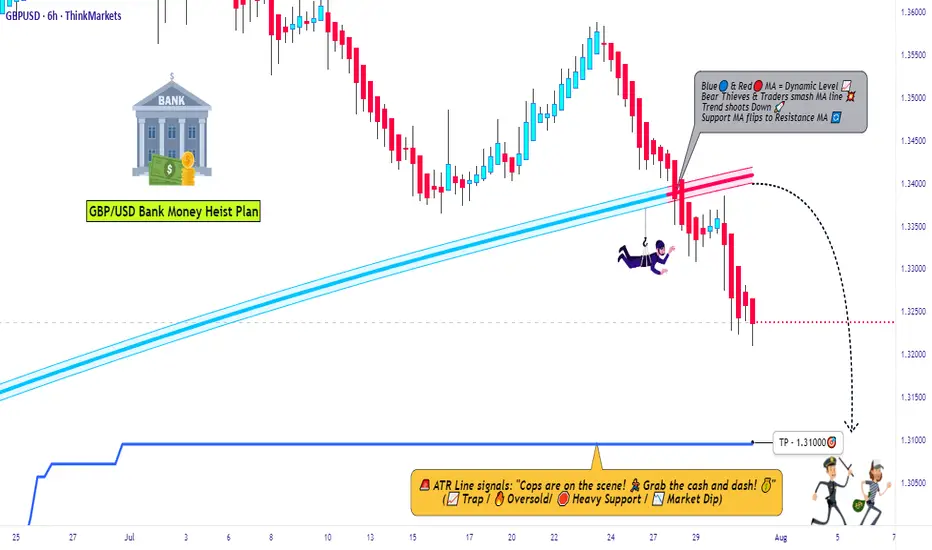
Market Trap Alert! GBP/USD Bearish Robbery Plan🔥💸 "The Cable Heist" – GBP/USD Robbery Plan Using Thief Trading Style 💸🔥
— Unfiltered Forex Forecast with Risky Intentions —
🌍 Hey Money-Makers, Market Hustlers & Chart Bandits! 🤑✈️
Hola! Bonjour! Marhaba! Hallo! Ciao! Welcome to the Forex streets where the smart rob the charts, not banks.
Ready for the GBP/USD Heist? Let’s break it down with our infamous Thief Trading Style – raw, unapologetic, and built for profits.
💼 Operation Name: “The Cable Forex Bank Robbery”
🎯 Pair: GBP/USD – aka “The Cable”
⚔️ Style: Scalp / Day Trade / Swing Heist
📊 Bias: Short (Bearish Setup)
🛠 STRATEGY SETUP: "Follow the Shadows"
🔍 Analysis Basis:
Smart-Money Traps at Key Levels
Oversold ≠ Reversal (Read between the candles)
Liquidity Hunting Zones
Retail Stop Clusters Exposed
Thief-style DCA Entries (Staggered Entry Levels)
Multi-timeframe Confirmation
COT, Sentiment & News-Driven Volatility
🎯 ENTRY ZONE:
Enter short (sell) using 15M or 30M chart.
Sell Limits near recent highs (pullback zone).
DCA (Layered Entry) recommended – Thief loves catching price slipping.
Let the liquidity work for us.
🛑 STOP LOSS (SL):
Base SL around 1.34000 on 4H Chart – above swing high.
Adjust SL per position size and total entries.
Manage risk, but remember: thieves don’t panic, they plan!
🎯 TARGET ZONE:
TP near 1.31000 or adjust using price action.
Escape before target if market mood flips – no need to be greedy.
Trail SLs if market momentum dies down.
👀 Scalpers' Special Note:
Only SHORT — don’t mess with long side unless you’re a liquidity donor.
Quick ins & outs. If you're loaded with capital, jump in big – else follow the swing team.
Use trailing SLs for safety — protect the loot.
📢 FUNDAMENTALS TO WATCH:
News Impacting GBP/USD
COT Reports
Sentiment Indicators
Macro Trends / Yield Spreads
US Dollar Strength Index (DXY)
UK Economic Reports (CPI, GDP, Rate Decisions)
⚠️ RISK MANAGEMENT TIPS:
🚨 Avoid new entries during news releases
🚨 Use trailing stops during volatility spikes
🚨 Secure running trades before major announcements
🚀 Boost the Robbery – Support the Strategy
💖 Smash that BOOST BUTTON if you're vibing with this setup. Help the Thief crew grow stronger!
Let’s keep milking the market 💸 – one “heist” at a time. Stay dangerous, stay smart.
🔓 NOTE: This isn't investment advice. Just a wild trading idea from a chart outlaw.
Always DYOR – Do Your Own Robbery (Research).
Market conditions shift fast. Stay alert, adapt, and respect your capital.
#ForexThiefStyle #CableHeist #GBPUSDShort #SmartMoneyMoves #LiquidityHunters #ChartOutlaws #TradingRebels #DayTradeLife #ScalpersParadise #ForexGang #FXHeistPlans
buy gbpaudwe reach to support level and have a up trend and now price reach to a demand zone and we have spin candles and we enter...

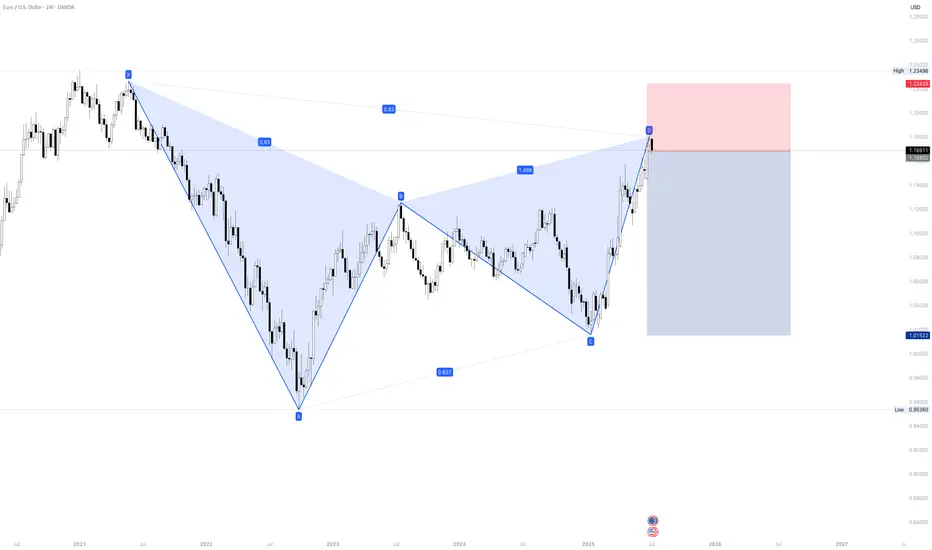
EURUSD: Will Start Growing! Here is Why:
It is essential that we apply multitimeframe technical analysis and there is no better example of why that is the case than the current EURUSD chart which, if analyzed properly, clearly points in the upward direction.
Disclosure: I am part of Trade Nation's Influencer program and receive a monthly fee for using their TradingView charts in my analysis.
❤️ Please, support our work with like & comment! ❤️
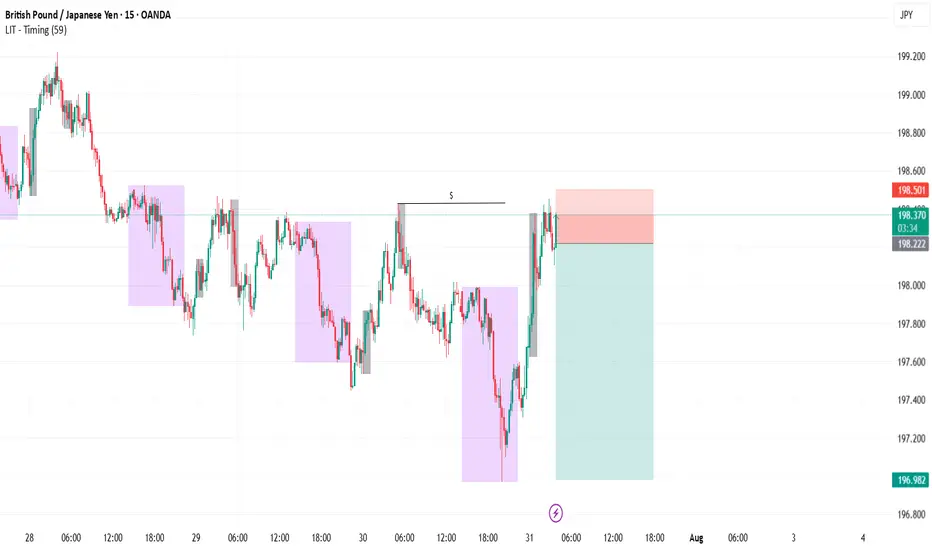
GBPJPY SellExternal structure is now bearish and the internal structure did a liquidity grab. Price should continue lower and go towards asia low to complete daily cycle.
EU LONGI'm currently monitoring EUR/USD and looking for potential long opportunities. If price action confirms, I’ll be looking to enter a buy position, anticipating upward momentum in the near term.