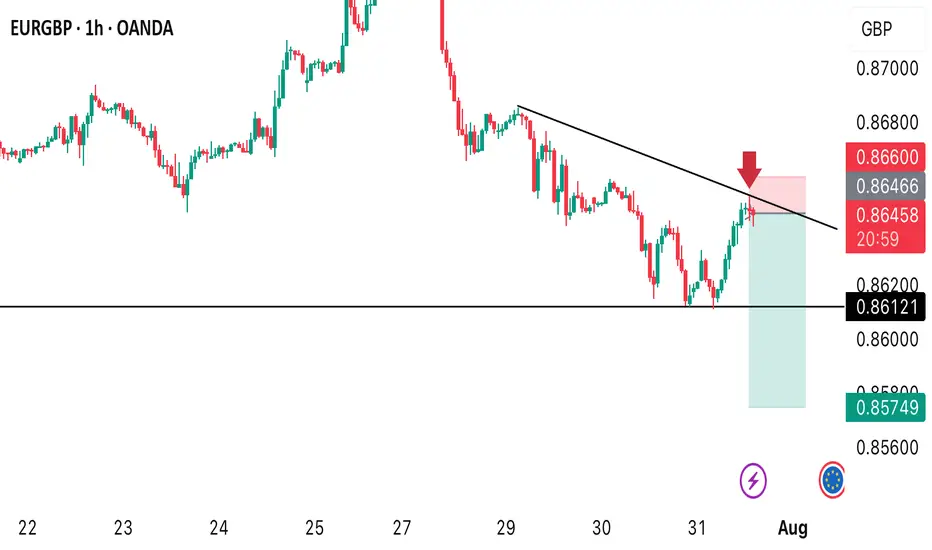
EURGBP SELL OPPORTUNITY In today’s trading session we’re considering shorting EURGBP from the current market price as we see price rejecting a bearish trendline in H1 timeframe and also making series of lower highs and lower lows. A sell opportunity is envisaged from the current market price.
Forex market
14-Day Mindset Challenge: Become a Top Trader — Day 114 Days. Challenge: How to Become a Mindset-Strong Trader
Day 1: The Power of Physical Exercise in Enhancing Trading Performance
Embarking on a trading journey demands more than just technical knowledge and market analysis; it requires a resilient and focused mindset. One often overlooked but incredibly powerful tool to develop this mental strength is physical exercise. Regular movement not only benefits your body but also profoundly influences your mental clarity, emotional stability, and overall performance as a trader.
When you engage in physical activity, your brain releases a cascade of chemicals that improve mood, focus, and resilience—crucial qualities for navigating the volatile world of trading. Think of your body and mind as interconnected systems: by strengthening your physical health, you lay a solid foundation for a sharper, more disciplined trading mindset. Over the next 14 days, committing to a simple, consistent exercise routine can transform how you approach your trading sessions, helping you stay calm under pressure, make better decisions, and recover quickly from setbacks.
Let's start!
How Physical Exercise Improves Your Trading Results
1. Boosts Endorphin Production for Positive Feelings
One of the most immediate benefits of exercise is the release of endorphins—natural chemicals that promote feelings of happiness and reduce stress and pain. This positive mood boost helps traders maintain a calm and focused mindset, even amidst market volatility. Scientific studies have shown that regular physical activity increases endorphin levels, which can combat anxiety and improve overall emotional resilience.
2. Enhances Insulin Activity and Energy Levels
Exercise improves insulin sensitivity, enabling your body to more efficiently process glucose for energy. This increased metabolic efficiency helps combat fatigue and sustains mental alertness during prolonged trading sessions. Research indicates that physically active individuals experience higher energy levels and better stamina, which are vital for maintaining attention and decision-making capacity.
3. Reduces Disease Risk and Promotes Long-Term Health
Regular physical activity reduces the risk of cardiovascular disease, diabetes, and other chronic health issues. By maintaining good health, traders are less likely to experience unexpected absences due to illness and can trade consistently over time. Scientific evidence supports that healthier individuals have better cognitive function and emotional stability, both crucial for trading success.
4. Boosts Brain Health and Cognitive Function
Exercise increases heart rate and blood flow, delivering more oxygen and nutrients to the brain. Numerous studies have demonstrated that physical activity stimulates the growth of new neural connections and enhances neuroplasticity—the brain’s ability to adapt and learn. This leads to improved memory, concentration, and problem-solving skills, all essential for analyzing markets and executing trades efficiently.
5. Enhances Stress Regulation and Emotional Control
Research shows that regular exercise helps regulate the hypothalamic-pituitary-adrenal (HPA) axis, which controls stress responses. By improving your body’s ability to handle stress, exercise reduces the likelihood of emotional reactions such as impulsivity or panic during trading. This emotional regulation is key to maintaining discipline and sticking to your trading plan under pressure.
6. Improves Sleep Quality
Quality sleep is fundamental for cognitive performance and emotional regulation. Scientific studies have consistently shown that physical activity, especially aerobic exercise, improves sleep quality and duration. Better sleep enhances focus, decision-making, and emotional resilience—traits that directly impact trading performance.
7. Promotes Neurotransmitter Balance
Exercise influences the production and regulation of neurotransmitters such as dopamine, serotonin, and norepinephrine. These chemicals play a vital role in mood, motivation, and alertness. Balanced neurotransmitter levels support a positive mindset, resilience to setbacks, and sustained motivation—key ingredients for consistent trading.
8. Increases Resilience to Market Stressors
Finally, regular physical activity builds overall resilience—both physically and mentally. This resilience helps traders recover quickly from losses, handle unexpected market shocks, and stay committed to their strategies without succumbing to frustration or panic.
Incorporating these scientifically-backed points emphasizes how exercise not only benefits physical health but also fundamentally enhances the mental and emotional capacities critical for successful trading.
Taking Action: Your 14-Day Exercise Implementation Plan
1. Decide Your Exercise Routine
Choose activities that you enjoy and can commit to every day for the next two weeks. Whether it’s walking, jogging, weightlifting, yoga, Pilates, push-ups, mountain climbers, or any other physical activity—what matters is consistency. Pick something that makes you feel energized and motivated.
2. Set a Daily Time Commitment
Determine how much time you can dedicate each day—start with 30 minutes to 1 hour. Make it a non-negotiable part of your daily schedule. For example, you might decide to go for a brisk walk in the morning, do bodyweight exercises at home, or hit the gym. The goal is to establish a routine that becomes a natural part of your day.
3. Use Reminders and Push Through Initial Discomfort
Especially during the first two weeks, it’s normal to feel some resistance or emotional stress about starting new habits. Set reminders on your phone or calendar to prompt you. Be patient and persistent—initial discomfort will fade as your body adapts. Once exercise becomes a habit, it will feel less like a chore and more like a source of strength.
Final Tips for Success
Start Small, Progress Gradually: Don’t overcommit at the beginning; build gradually to avoid burnout.
Stay Consistent: Consistency beats intensity—daily effort compounds over time.
Track Your Progress: Keep a journal or use an app to monitor your activity and observe how you feel over the days.
Enjoy the Process: Find joy in the movement itself. As it becomes part of your routine, you'll notice improvements not only physically but also in your trading mindset.
Conclusion
A 14-day commitment to physical exercise can be a game-changer for your trading mindset. By boosting endorphins, increasing energy, enhancing brain function, and reducing health risks, you set the stage for more disciplined, confident, and resilient trading. Embrace this challenge—your mind and your portfolio will thank you.
✅ Follow me and save this educational post: "14-Day Mindset Challenge: Become a Top Trader — Day 1". Tomorrow, I'll be releasing Day 2 of the transformation... Stay tuned!
✅ Please share your thoughts about this article in the comments section below and HIT LIKE if you appreciate my post. Don't forget to FOLLOW ME; you will help us a lot with this small contribution.
GBPAUD Breakout of resistance 4 hr GBPAUD candle has broken the trendline resistance and is likely to go up. enter on retesting the support.

GBPUSD OUTLOOKHey traders what’s your take on this ? If it breaks the that zone, expect a bearish continuation
HEAD & SHOULDER PATTERN SPOTTED IN EUR/CADHEAD & SHOULDER PATTERN SPOTTED IN EUR/CAD.
Price is expected to remain bearish in upcoming trading sessions.
On higher side 1.61100 level may act as a key resistance level.
On lower side market may hit the target of 1.58150.

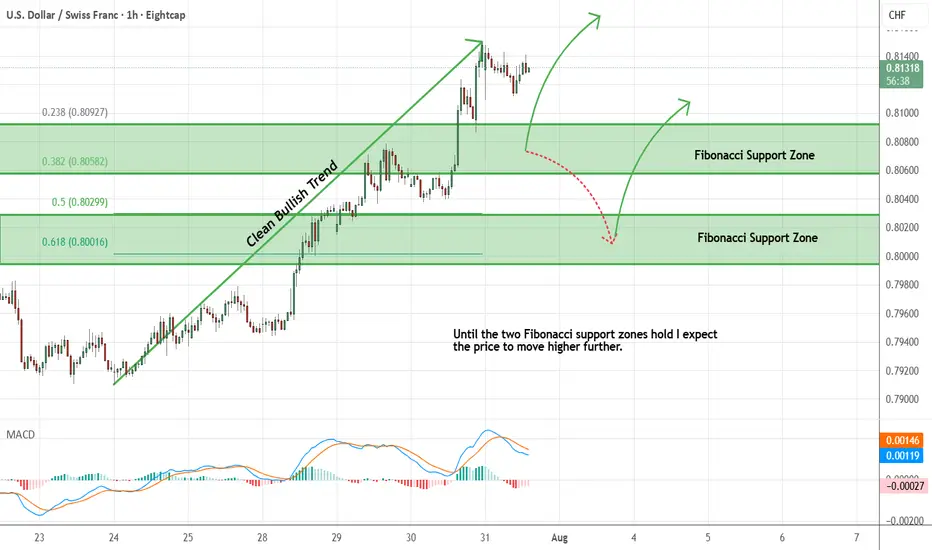
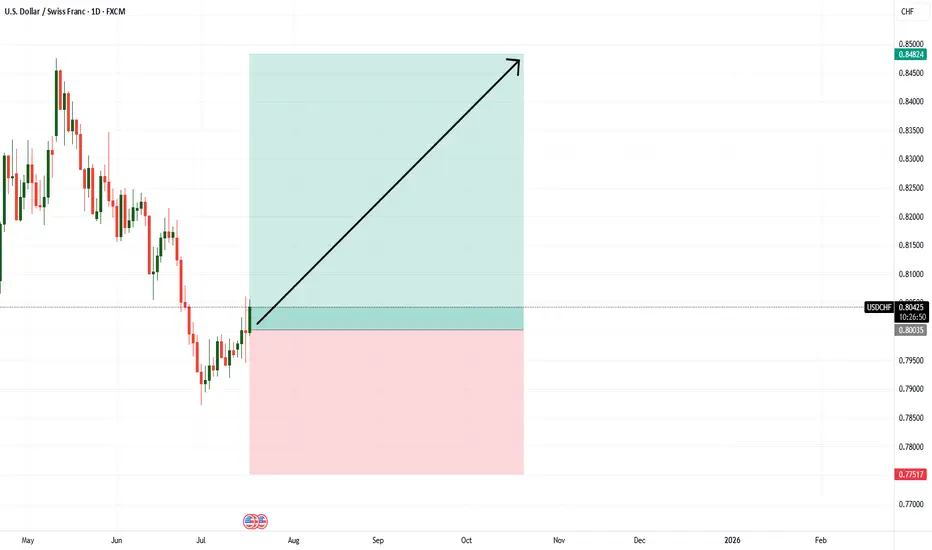
USDCHF - Looking To Buy Pullbacks In The Short TermH1 - We have a clean bullish trend with the price creating a series of higher highs, higher lows structure.
This strong bullish momentum is followed by a pullback.
No opposite signs.
Until the two Fibonacci support zones hold I expect the price to move higher further.
If you enjoy this idea, don’t forget to LIKE 👍, FOLLOW ✅, SHARE 🙌, and COMMENT ✍! Drop your thoughts and charts below to keep the discussion going. Your support helps keep this content free and reach more people! 🚀
--------------------------------------------------------------------------------------------------------------------
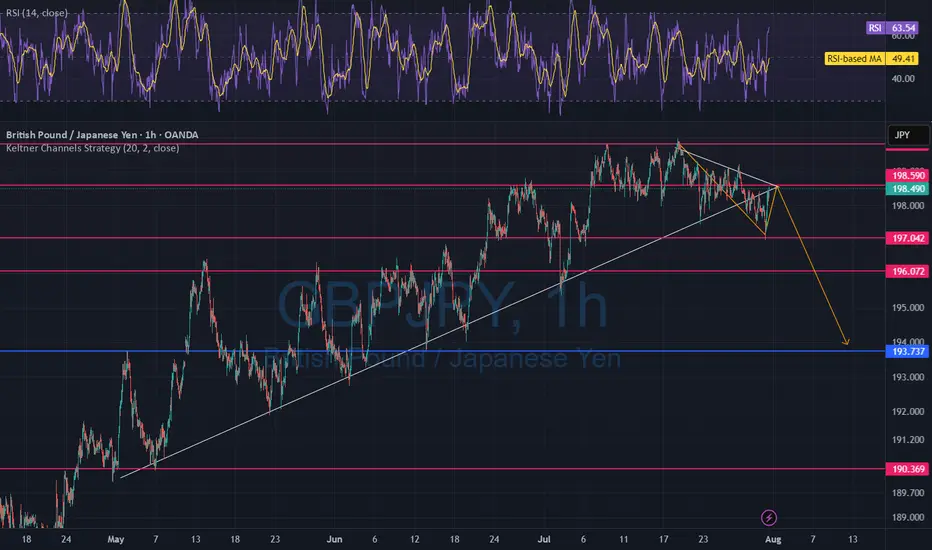
The recent uptrend has been decisively broken, with price actionThe currency pair showed sustained bullish momentum over the past weeks, forming higher highs and higher lows. However, recent price action broke below the ascending trendline and failed to retest previous highs, indicating waning bullish strength. The break of support suggests the uptrend has been invalidated, with increasing risk of a bearish reversal or short-term correction.
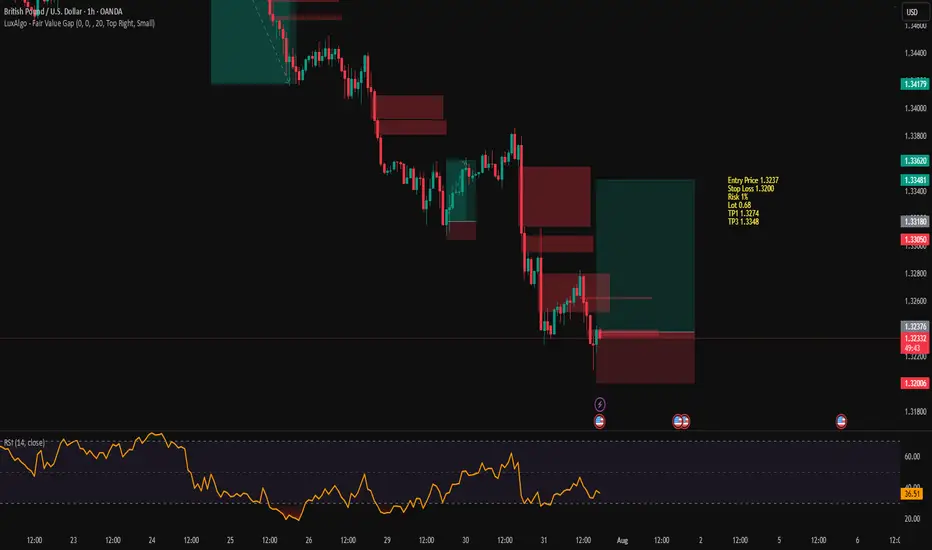
GBPUSD in Trend ReversalGBPUSD is in bullish divergence and we observed an inverse FVG forming suggesting a reversal in trend
Entry Price 1.3237
Stop Loss 1.3200
Risk 1%
Lot 0.68
TP1 1.3274
TP3 1.3348
LONG ON EUR/USDEUR/USD is currently at a major demand level after sweeping sell side liquidity.
The Dxy (Dollar) is overall bearish. I expect the dollar to fall and EUR/USD to rise to the previous high / supply level for over 200-300 pips.
News most likely will affect this pair in terms of volatility.

USDCAD Update: Don’t Sleep on This Uptrend’s First LegYo traders, Skeptic from Skeptic Lab here! 🚀 USDCAD’s serving a hot long trigger for pattern traders chasing the first leg of a big uptrend! We’ve got an ascending triangle breakout on the daily, with bullish candles stacking up, hinting at a return to the weekly bullish trend. Too early to confirm, but the momentum’s fire.
📈 Today’s FOMC meeting’s got everyone buzzing—will Powell cut, hold, or drop resignation hints? Check the full setup in the video, but with crazy news like Federal Funds Rate
, s tick to high-probability trades, keep risk low, and no FOMO or revenge trading! Drop your thoughts, boost if it vibes <3

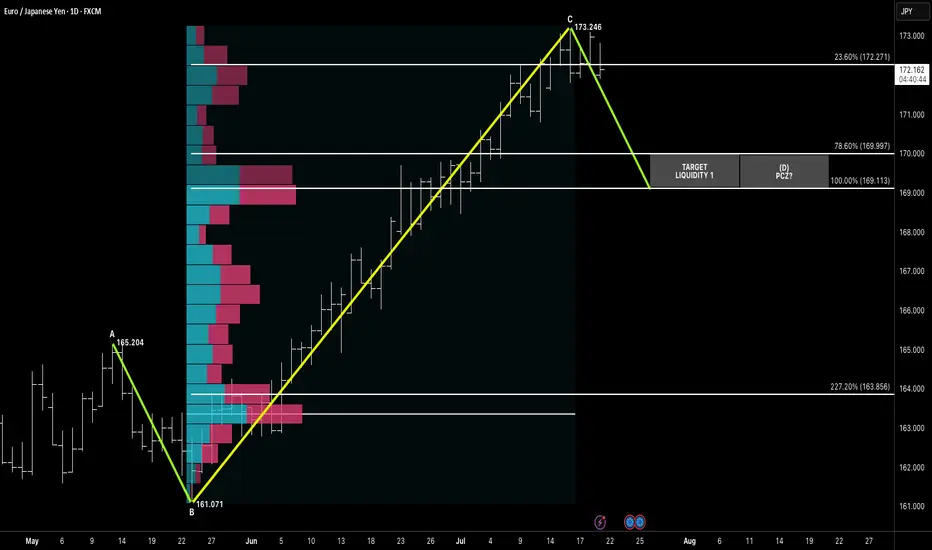
Symmetry Bearish Setup Targeting PCZ Liquidity Zone 1HELLO awesome traders, I hope y'all have had a great weekend!! What a beginning of trading week, ha? lets crack on by droping some chart here for yall.
After completing a clean ABC symmetry leg, EURJPY is now showing signs of exhaustion just below 173.250, with price stalling at the high-volume node. The projected Potential Completion Zone (PCZ) aligns at 169.997 (78.6%) and 169.113 (100%), backed by volume profile voids and confluence from prior structure.
This symmetrical move offers a classic liquidity sweep play, with target zones sitting below price in thin auction areas.
📌 Pattern Structure:
A: 165.204
B: 161.071
C: 173.246
D Target = 1:1 Symmetry → PCZ = 169.997–169.113
🔻 Bearish Trigger:
Break below 23.6% retracement (172.271) = early momentum shift
Liquidity likely rests between 170.00–169.00
🎯 Targets:
T1: 169.997
T2: 169.113 (let's do T1, Them will see)
🧠 Context:
JPY strength resurfaces amid macro uncertainty. Volume profile suggests fast price drop once liquidity is triggered below 171.00. Watching for confirmation candle or rejection below 172.20 zone.
“Symmetry leads the setup, but liquidity confirms the move.”
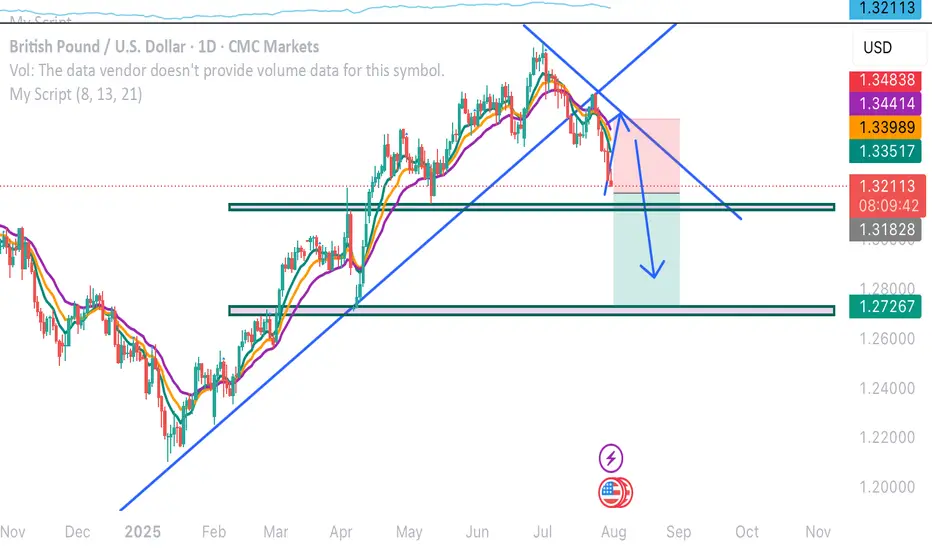
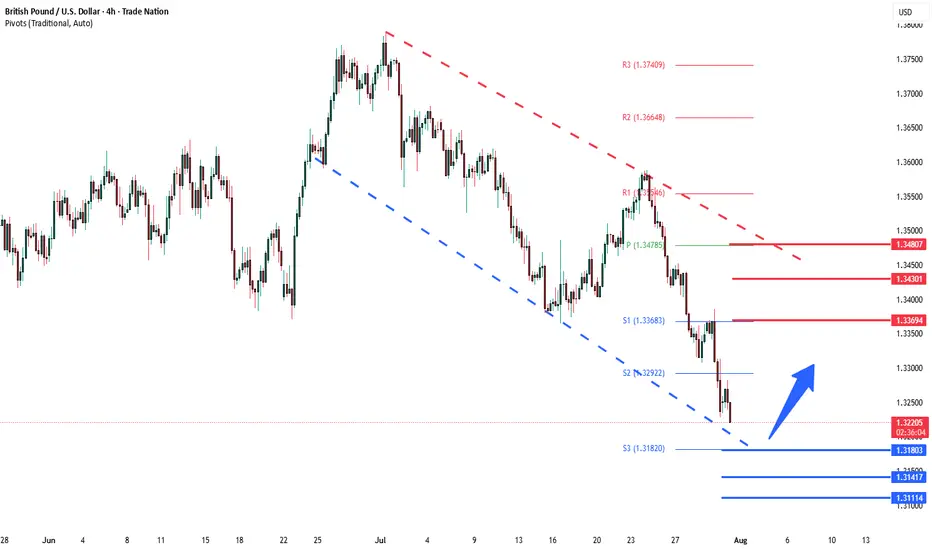
GBPUSD corrective pullback support at 1.3180The GBPUSD remains in a bullish trend, with recent price action showing signs of a corrective pullback within the broader uptrend.
Support Zone: 1.3180 – a key level from previous consolidation. Price is currently testing or approaching this level.
A bullish rebound from 1.3180 would confirm ongoing upside momentum, with potential targets at:
1.3370 – initial resistance
1.3430 – psychological and structural level
1.3480 – extended resistance on the longer-term chart
Bearish Scenario:
A confirmed break and daily close below 1.3180 would weaken the bullish outlook and suggest deeper downside risk toward:
1.3140 – minor support
1.3110 – stronger support and potential demand zone
Outlook:
Bullish bias remains intact while the GBPUSD holds above 1.3180. A sustained break below this level could shift momentum to the downside in the short term.
This communication is for informational purposes only and should not be viewed as any form of recommendation as to a particular course of action or as investment advice. It is not intended as an offer or solicitation for the purchase or sale of any financial instrument or as an official confirmation of any transaction. Opinions, estimates and assumptions expressed herein are made as of the date of this communication and are subject to change without notice. This communication has been prepared based upon information, including market prices, data and other information, believed to be reliable; however, Trade Nation does not warrant its completeness or accuracy. All market prices and market data contained in or attached to this communication are indicative and subject to change without notice.
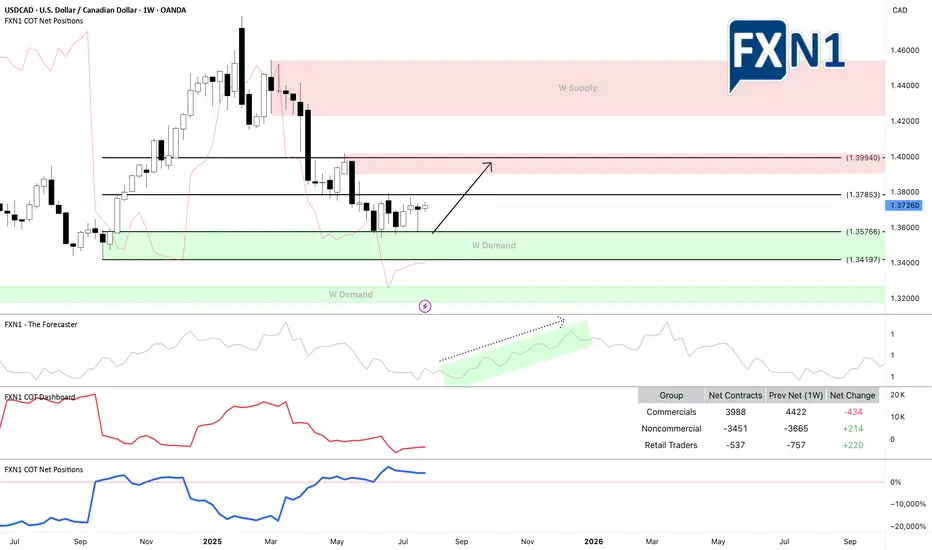
USD/CAD - 6C1! : Trade update FundamentalThe US dollar index (DXY) gained strength against major currencies on Monday following a landmark trade agreement between the United States and the European Union. During the meeting in Scotland on Sunday, President Donald Trump and European Commission President Ursula von der Leyen announced a new trade framework, which includes a 15% import tariff on EU goods—half of the 30% rate Trump had initially threatened to impose starting August 1.
The DXY opened higher at the start of the week, and it’s clear that most currencies are likely to see a decline in response. This trend also extends to pairs like the 6C1! (USDCAD), where the USD has been increasing its long positions. Last week, non-commercial traders added to their holdings, while commercial traders remain at their highest levels since 2021. Based on this setup, we are maintaining a bullish outlook and expect the continuation of our long position strategy.
Previous Idea :
✅ Please share your thoughts about USD/CAD in the comments section below and HIT LIKE if you appreciate my analysis. Don't forget to FOLLOW ME; you will help us a lot with this small contribution.
GBPusd short position31/07/2025English : According to our analysis, we anticipate a bearish scenario.
Morocan Darija : kanchofo d'apres l'analyse dyalna antsanaw hboot
ATENTION : I only share my ideas, not signals

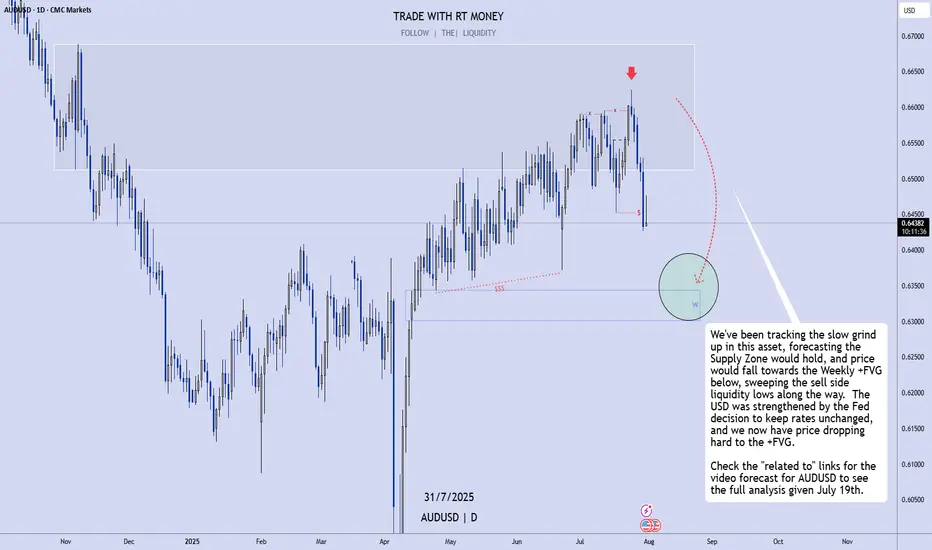
AUDUSD: Dropping To the Weekly FVG, As Expected!In this video, we will analyze the following FX market for July 31 - Aug 1st.
AUDUSD
Been waiting and watching for this move, and we've tracked it for weeks! It's happening now!
Look for it to continue until we reach the +FVG!
Enjoy!
May profits be upon you.
Leave any questions or comments in the comment section.
I appreciate any feedback from my viewers!
Like and/or subscribe if you want more accurate analysis.
Thank you so much!
Disclaimer:
I do not provide personal investment advice and I am not a qualified licensed investment advisor.
All information found here, including any ideas, opinions, views, predictions, forecasts, commentaries, suggestions, expressed or implied herein, are for informational, entertainment or educational purposes only and should not be construed as personal investment advice. While the information provided is believed to be accurate, it may include errors or inaccuracies.
I will not and cannot be held liable for any actions you take as a result of anything you read here.
Conduct your own due diligence, or consult a licensed financial advisor or broker before making any and all investment decisions. Any investments, trades, speculations, or decisions made on the basis of any information found on this channel, expressed or implied herein, are committed at your own risk, financial or otherwise.
Beginner MistakeI was expecting a push to the downside but i got stopped out big time. I am publishing this trade to look back at it when i am profitable.

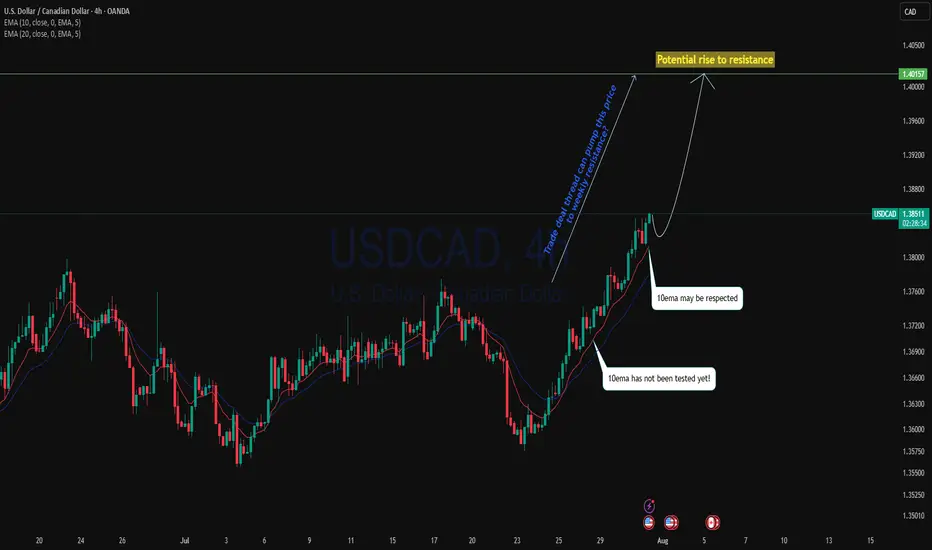
Trade deal thread could pump USDCAD?USDCAD as with the bounce off the monthly support level, current is a strong uptrend.4H perspective, price is trading above 10ema since the cross over of 20ema and 10ema price is pushing back to the upside. With trade deal thread, including upcoming GDP on CAD could pump this price back to the resistance ?
As 10ema has not been tested since cross over, we may see the price to back to the upside with respecting the 10ema.
Buying on EMA is a high probability trade setup.
EURUSD Bearish Breakout !
HI,Traders !
#EURUSD was trading along
The rising support line but
Now we are seeing a bearish
Breakout so we are bearish
Biased and we will be expecting
A further bearish move down !
Comment and subscribe to help us grow !

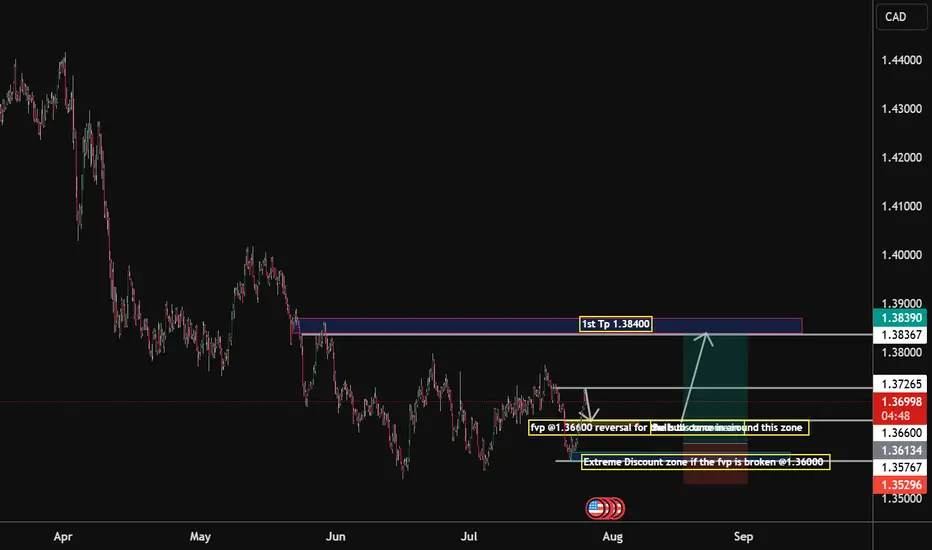
USD/CAD Unless oil rockets, then the pair has room to rise.From June till now, we’ve been in a range-bound market, with multiple failed attempts to break lower.
But now we’re seeing higher lows forming, and price is bouncing off my fvp zone @ 1.36600 . So if the Fed stays patient and oil stays weak or sideways, USD/CAD bulls have the upper hand. I am expecting a bearish retest soon to develop @ Key Bullish FVP Zone: 1.36600, but if 1.3577 gets violated with strength, then scratch the long idea — it might be time for CAD bulls to party instead.
Extreme Discount Zone: Just below at 1.36000,
If the price dips into this area, it could be a liquidity hunt. But if not, then the bulls will have to come in and drive the market to the
1st Take Profit Target: 1.38400
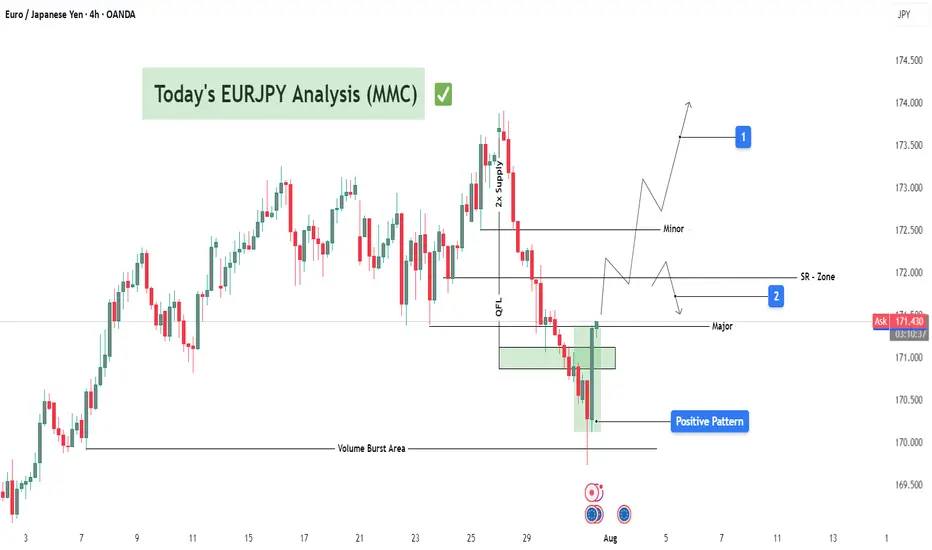
EURJPY Bullish Setup : EURJPY Forecast + Demand Zone🧠 Introduction: What's Happening on the Chart?
Today’s analysis on EURJPY is built on the MMC trading framework, which emphasizes the identification of institutional supply and demand zones, reaction points, QFL patterns, and volume bursts to map out high-probability trading paths.
We are currently observing a market in a corrective phase following a significant bearish drop. However, the presence of a major demand zone, along with a positive bullish pattern, suggests potential upside reversal or at least a short-term retracement.
🔍 Technical Breakdown – Zone by Zone
🔻 1. The Drop from 2x Supply Zone
EURJPY experienced a significant decline from the 173.60–174.00 area, which acted as a 2x confirmed supply zone.
Sellers took control with strong bearish candles that broke through previous minor support levels.
This drop was impulsive, showing momentum-driven selling, often linked with institutional activity.
🟩 2. Demand Reaction at Major Zone
Price entered a key demand zone marked in green (170.80–171.00), where historically buyers have stepped in.
A "Volume Burst" is visible here—large volume candles with long wicks to the downside, which typically indicate accumulation.
A positive pattern (possibly engulfing or a pin bar structure) has formed, signaling a potential bullish reversal or relief rally.
🧱 3. QFL Structure (Quantum Flat Line)
The chart highlights a QFL base, where the price consolidates after an initial drop, then continues lower before a sharp bounce.
QFL is often used to identify trap zones where retail traders are shaken out, and smart money enters.
The recent bounce from the QFL base suggests smart money might be accumulating for a reversal move.
📐 Key Levels and Zones
Type Zone/Level Role
🔵 Volume Burst Area ~170.80–171.00 Aggressive buyer entry; accumulation zone
🟢 Major Demand 170.80–171.20 Key structural low supporting bullish bias
🟠 SR Flip Zone 171.80–172.00 Crucial breakout/retest level
🔴 Minor Resistance 172.60–173.00 Short-term pullback zone
🟥 2x Supply 173.60–174.00 Strong reversal point; ideal target
🔁 Scenarios to Watch
📈 Scenario 1: Bullish Breakout and Rally (Blue Box 1)
If price breaks above 172.00, we expect:
A potential retest (bullish confirmation).
Continuation toward minor resistance at 173.00, and possibly the 2x supply zone at 174.00.
This aligns with the positive pattern formed at the base and the idea of a market rotation from bearish to bullish structure.
📉 Scenario 2: Rejection and Retest of Lows (Blue Box 2)
If the price fails to sustain above 172.00, sellers may step in:
Price could revisit the major demand zone again or even break down to 170.50.
This would invalidate the bullish setup in the short term and imply a larger continuation of the bearish trend.
🧠 Strategic Insights (MMC-Based Thinking)
The MMC approach teaches us to mirror the market’s emotion and behavior.
In this case, we see signs of:
Panic selling → smart money accumulation.
Institutional traps (QFL drop) → bullish absorption.
Traders applying MMC would anticipate reactive setups at the SR Flip Zone to determine next directional bias.
💡 Trade Ideas (For Educational Purposes Only)
Strategy Entry SL TP1 TP2
Aggressive Long 171.30–171.50 170.70 172.50 173.50
Breakout Retest Long 172.10 (after breakout) 171.50 173.00 174.00
Sell on Rejection 172.00 (bearish confirmation) 172.60 171.00 170.40
📌 Conclusion & Final Thoughts
EURJPY is showing a potential bullish reversal setup from a well-defined demand zone, supported by volume bursts and positive price action patterns. However, the SR Zone at 172.00 remains the key pivot—how the price reacts here will determine whether we see a deeper pullback or a continuation to test upper resistance levels.
Stay flexible and responsive. Let the market give confirmation before execution. As always, follow proper risk management and trade the reaction, not the prediction.
FX Wars Episode 6 - The return of the USDA simple idea, which I will gradually fill with life:
The USD returns and with it the claim to its FX throne.
Act 1:
📊🔮🇺🇲 US retail sales, which will be published today at 14:30, will be higher than consensus expectations.
🟡-> the US consumer is alive and well and will continue to keep the US economy afloat.
Further acts will follow ✅️
Oh CANDADA!🇨🇦A simple idea, which I will gradually fill with life:
Act 1:
-> the 🇨🇦CAD comes to life.
📊🔮🇺🇲 US retail sales, which will be published today at 2:30 pm, will be higher than expected by the consensus.
Further acts and updates will be follow✅️
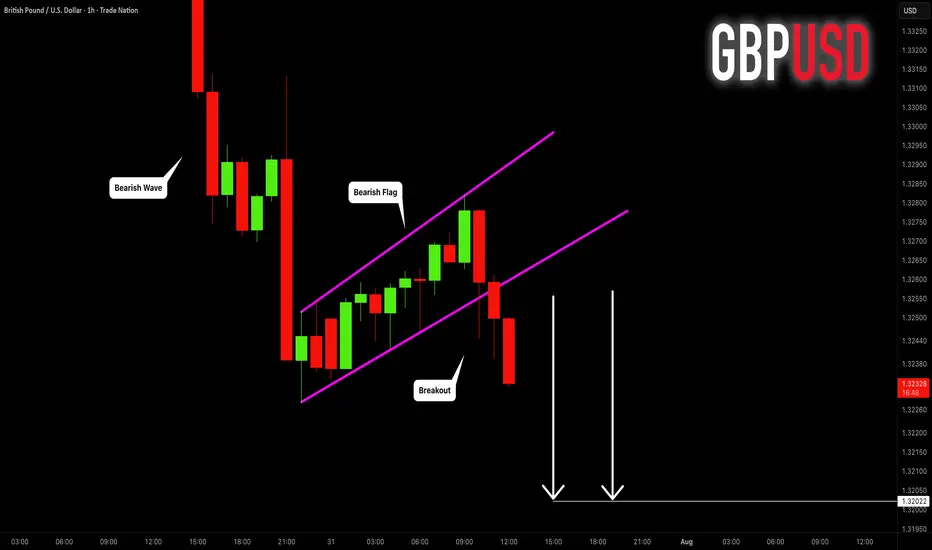
GBPUSD: Strong Trend-Following Pattern 🇬🇧🇺🇸
GBPUSD is going to drop lower.
The market has completed a correctional movement within
a bearish flag.
Its support violation provides a strong bearish confirmation.
I expect a drop to 1.3202 level.
❤️Please, support my work with like, thank you!❤️
I am part of Trade Nation's Influencer program and receive a monthly fee for using their TradingView charts in my analysis.