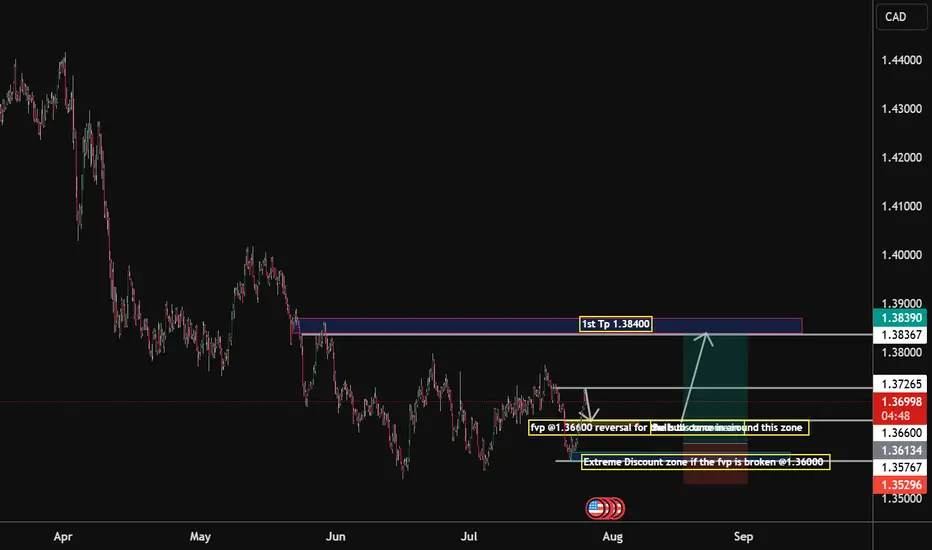
USD/CAD Unless oil rockets, then the pair has room to rise.From June till now, we’ve been in a range-bound market, with multiple failed attempts to break lower.
But now we’re seeing higher lows forming, and price is bouncing off my fvp zone @ 1.36600 . So if the Fed stays patient and oil stays weak or sideways, USD/CAD bulls have the upper hand. I am expecting a bearish retest soon to develop @ Key Bullish FVP Zone: 1.36600, but if 1.3577 gets violated with strength, then scratch the long idea — it might be time for CAD bulls to party instead.
Extreme Discount Zone: Just below at 1.36000,
If the price dips into this area, it could be a liquidity hunt. But if not, then the bulls will have to come in and drive the market to the
1st Take Profit Target: 1.38400
Forex market
FX Wars Episode 6 - The return of the USDA simple idea, which I will gradually fill with life:
The USD returns and with it the claim to its FX throne.
Act 1:
📊🔮🇺🇲 US retail sales, which will be published today at 14:30, will be higher than consensus expectations.
🟡-> the US consumer is alive and well and will continue to keep the US economy afloat.
Further acts will follow ✅️
Oh CANDADA!🇨🇦A simple idea, which I will gradually fill with life:
Act 1:
-> the 🇨🇦CAD comes to life.
📊🔮🇺🇲 US retail sales, which will be published today at 2:30 pm, will be higher than expected by the consensus.
Further acts and updates will be follow✅️
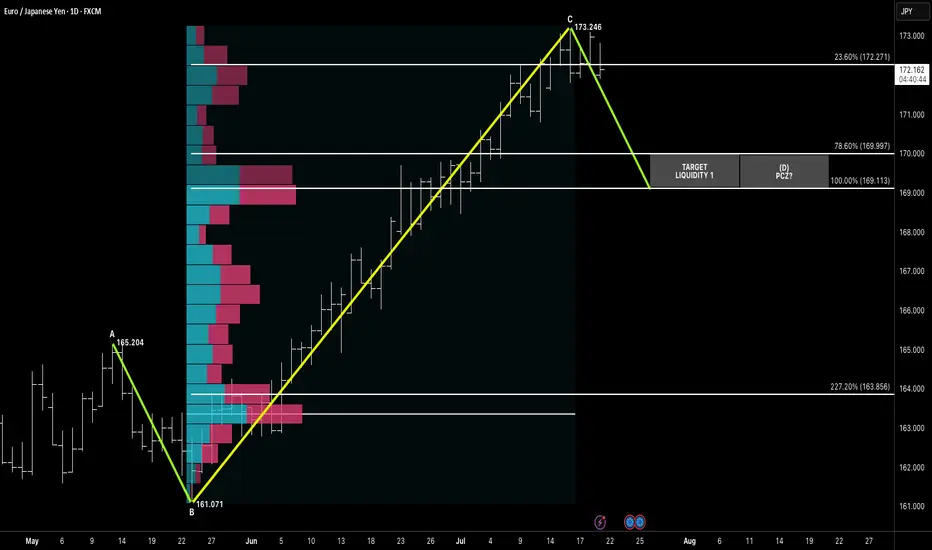
Symmetry Bearish Setup Targeting PCZ Liquidity Zone 1HELLO awesome traders, I hope y'all have had a great weekend!! What a beginning of trading week, ha? lets crack on by droping some chart here for yall.
After completing a clean ABC symmetry leg, EURJPY is now showing signs of exhaustion just below 173.250, with price stalling at the high-volume node. The projected Potential Completion Zone (PCZ) aligns at 169.997 (78.6%) and 169.113 (100%), backed by volume profile voids and confluence from prior structure.
This symmetrical move offers a classic liquidity sweep play, with target zones sitting below price in thin auction areas.
📌 Pattern Structure:
A: 165.204
B: 161.071
C: 173.246
D Target = 1:1 Symmetry → PCZ = 169.997–169.113
🔻 Bearish Trigger:
Break below 23.6% retracement (172.271) = early momentum shift
Liquidity likely rests between 170.00–169.00
🎯 Targets:
T1: 169.997
T2: 169.113 (let's do T1, Them will see)
🧠 Context:
JPY strength resurfaces amid macro uncertainty. Volume profile suggests fast price drop once liquidity is triggered below 171.00. Watching for confirmation candle or rejection below 172.20 zone.
“Symmetry leads the setup, but liquidity confirms the move.”
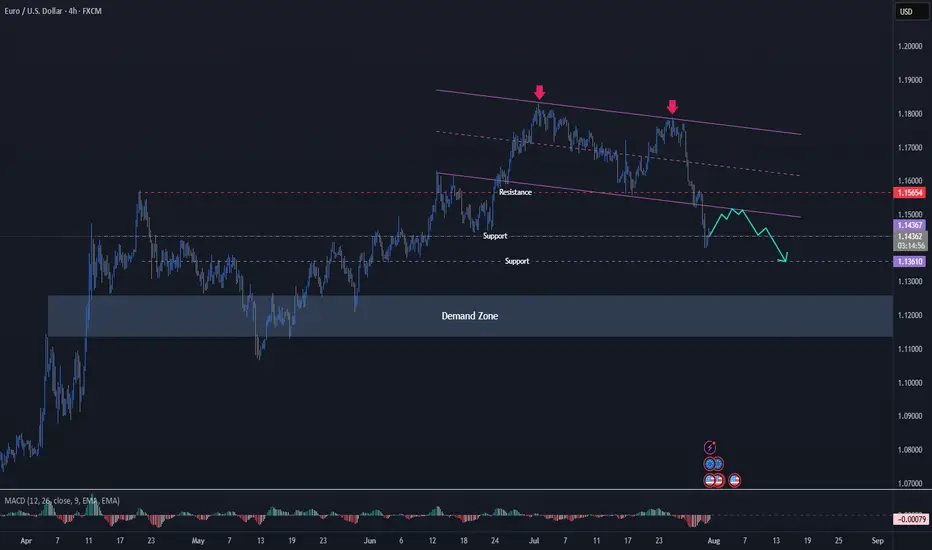
EURUSD Forecast📊 Technical Analysis
● FX:EURUSD EURUSD confirmed a double rejection below long-term resistance with two lower highs and broke channel support at 1.1567.
● Price is now trending within a descending channel toward 1.1363, with lower targets pointing into the 1.12–1.11 demand zone.
💡 Fundamental Analysis
● US Q2 GDP surprised to the upside, reinforcing the Fed’s hawkish tone, while Eurozone CPI inflation cooled below forecast.
● Diverging central bank trajectories continue to widen yield differentials in favor of the dollar, sustaining bearish euro flows.
✨ Summary
Short bias confirmed below 1.1567. Break of 1.1450 opens path to 1.1363 ➜ 1.1200 zone. Watch for rallies to fade below trendline.
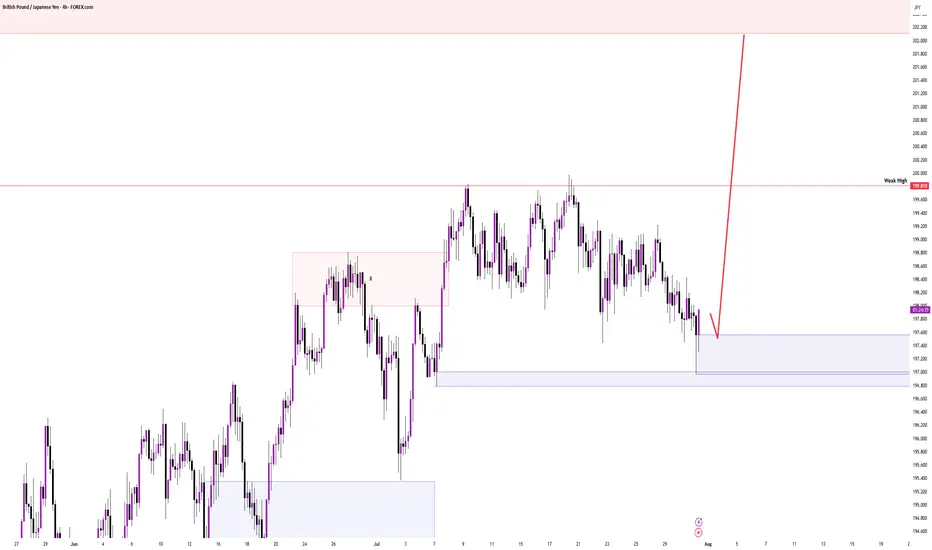
GBPCAD DOUBLE BOTTOMAs CAD currency interest rate didn’t surprise to the market. Hence, it is not favourable to trader and investor. From the daily chart it is remain in upward trend line. Yesterday the chart had break through the Tuesday candle which shows that it has some buyer from there.

Thoughts on EU/USHave some ideas bout this chart. Dont want talk too much& If ur interested in. Just read previous takes in my acc. Feel to cozy, might delete later >/>

The Fed aftermath. US dollar bulls enjoy the moment.The US dollar bulls went in hard after during and after the Fed's press conference. Can the momentum stay? Let's dig in.
MARKETSCOM:DOLLARINDEX
TVC:DXY
Let us know what you think in the comments below.
Thank you.
75.2% of retail investor accounts lose money when trading CFDs with this provider. You should consider whether you understand how CFDs work and whether you can afford to take the high risk of losing your money. Past performance is not necessarily indicative of future results. The value of investments may fall as well as rise and the investor may not get back the amount initially invested. This content is not intended for nor applicable to residents of the UK. Cryptocurrency CFDs and spread bets are restricted in the UK for all retail clients.

AUDUSD Will Go Lower! Sell!
Please, check our technical outlook for AUDUSD.
Time Frame: 9h
Current Trend: Bearish
Sentiment: Overbought (based on 7-period RSI)
Forecast: Bearish
The market is approaching a significant resistance area 0.645.
Due to the fact that we see a positive bearish reaction from the underlined area, I strongly believe that sellers will manage to push the price all the way down to 0.637 level.
P.S
Overbought describes a period of time where there has been a significant and consistent upward move in price over a period of time without much pullback.
Disclosure: I am part of Trade Nation's Influencer program and receive a monthly fee for using their TradingView charts in my analysis.
Like and subscribe and comment my ideas if you enjoy them!

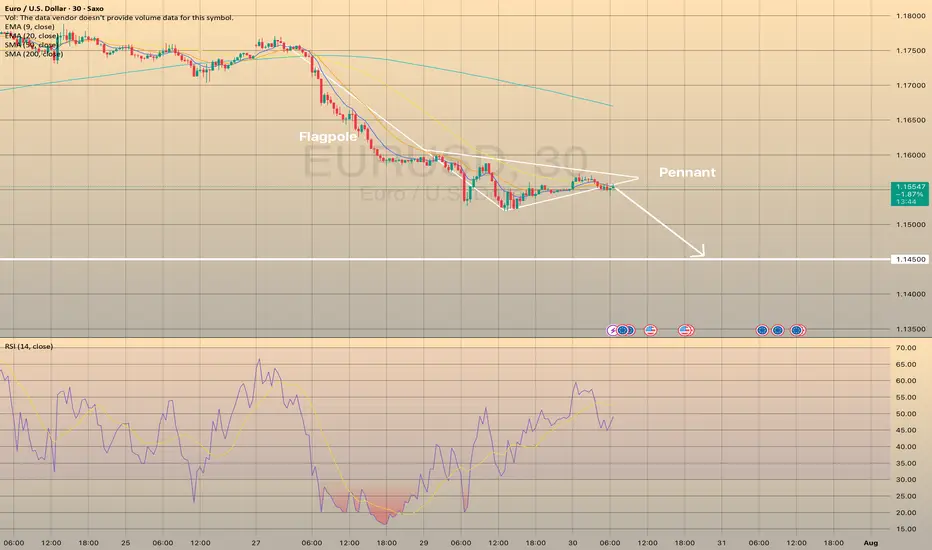
EURUSD FORMED BEARISH PENNANT. THE PRICE IS READY TO DROP.EURUSD FORMED BEARISH PENNANT. THE PRICE IS READY TO DROP.
EURUSD has been trading sideways within the last day, showing lower highs and higher lows. Eventually, the price has formed the pennant chart pattern.
What is a pennant?
A pennant chart pattern is a short-term continuation pattern in technical analysis, resembling a small symmetrical triangle, formed after a strong price movement (flagpole). It consists of converging trendlines, indicating a brief consolidation before the trend resumes. Bullish pennants form after an uptrend, bearish pennants after a downtrend.
The price is expected to decline towards 1.14500 support level
GBPUSD H4 | Bearish continuationThe Cable (GBP/USD) is rising towards the sell entry, which is a pullback resistance that aligns with the 23.6% Fibonacci retracement and could drop lower from this level.
Sell entry is at 1.3317, which is a pullback resistance that lines up with the 23.6% Fibonacci retracement.
Stop loss at 1.3392, which is a pullback resistance that is slightly below the 50% Fibonacci retracement.
Take profit is at 1.3172, which is a swing low support that aligns with the 100% Fibonacci projection.
High Risk Investment Warning
Trading Forex/CFDs on margin carries a high level of risk and may not be suitable for all investors. Leverage can work against you.
Stratos Markets Limited (tradu.com ):
CFDs are complex instruments and come with a high risk of losing money rapidly due to leverage. 65% of retail investor accounts lose money when trading CFDs with this provider. You should consider whether you understand how CFDs work and whether you can afford to take the high risk of losing your money.
Stratos Europe Ltd (tradu.com ):
CFDs are complex instruments and come with a high risk of losing money rapidly due to leverage. 66% of retail investor accounts lose money when trading CFDs with this provider. You should consider whether you understand how CFDs work and whether you can afford to take the high risk of losing your money.
Stratos Global LLC (tradu.com ):
Losses can exceed deposits.
Please be advised that the information presented on TradingView is provided to Tradu (‘Company’, ‘we’) by a third-party provider (‘TFA Global Pte Ltd’). Please be reminded that you are solely responsible for the trading decisions on your account. There is a very high degree of risk involved in trading. Any information and/or content is intended entirely for research, educational and informational purposes only and does not constitute investment or consultation advice or investment strategy. The information is not tailored to the investment needs of any specific person and therefore does not involve a consideration of any of the investment objectives, financial situation or needs of any viewer that may receive it. Kindly also note that past performance is not a reliable indicator of future results. Actual results may differ materially from those anticipated in forward-looking or past performance statements. We assume no liability as to the accuracy or completeness of any of the information and/or content provided herein and the Company cannot be held responsible for any omission, mistake nor for any loss or damage including without limitation to any loss of profit which may arise from reliance on any information supplied by TFA Global Pte Ltd.
The speaker(s) is neither an employee, agent nor representative of Tradu and is therefore acting independently. The opinions given are their own, constitute general market commentary, and do not constitute the opinion or advice of Tradu or any form of personal or investment advice. Tradu neither endorses nor guarantees offerings of third-party speakers, nor is Tradu responsible for the content, veracity or opinions of third-party speakers, presenters or participants.

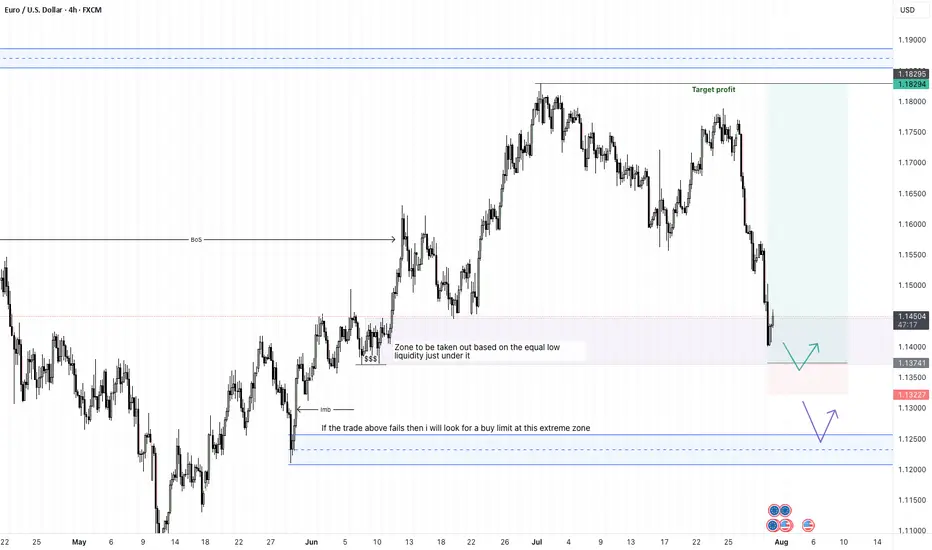
EURUSD - 31/7/25Price has reached a zone that broke the structure - see BoS on the left. Now that price is here in the zone, im not comfortable entering a buy order yet. The full bearish candle into the zone, leaves me with an indication that price may go lower.
+ve:
1. Big bearish candle in to the BoS zone - price may drop lower
2. There is equal low liquidity on the left which sits just below the zone which is expected to be taken out
4. HTF direction is still bullish
-ve:
1. below the equal low liquidity is an efficient zone before some imbalance
2. that imbalance may draw price to it and stop me out
Second trade idea:
Assuming that the first trade does not hold, then my focus will be the extreme zone where i will place a buy limit.
TP: 8.86R
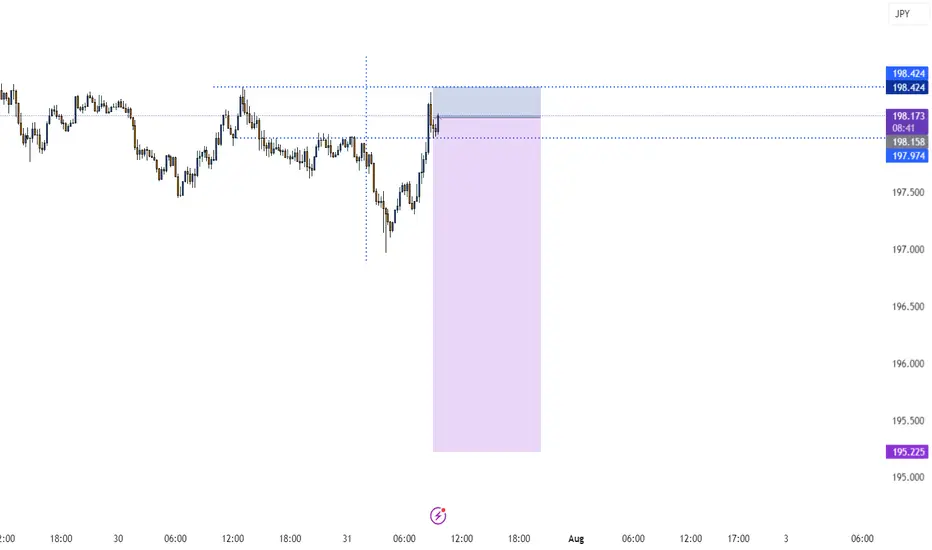
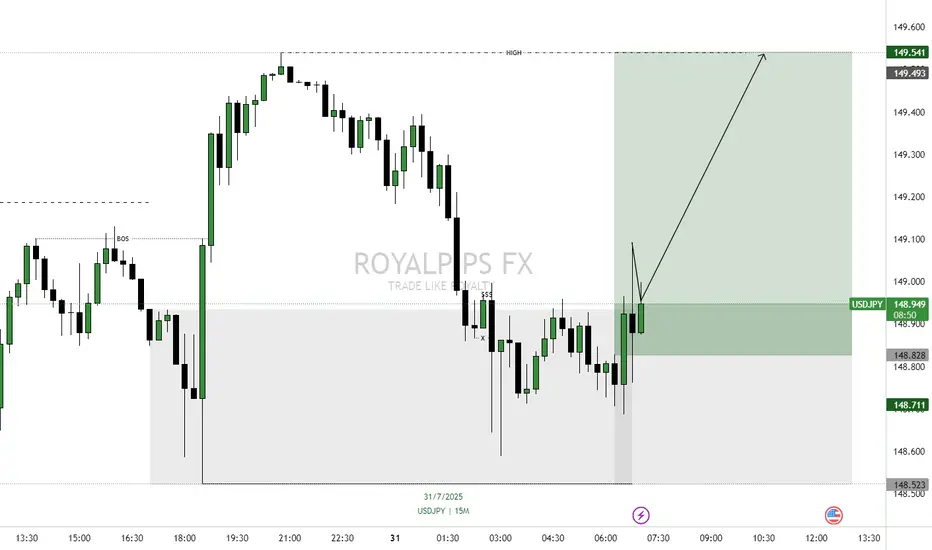
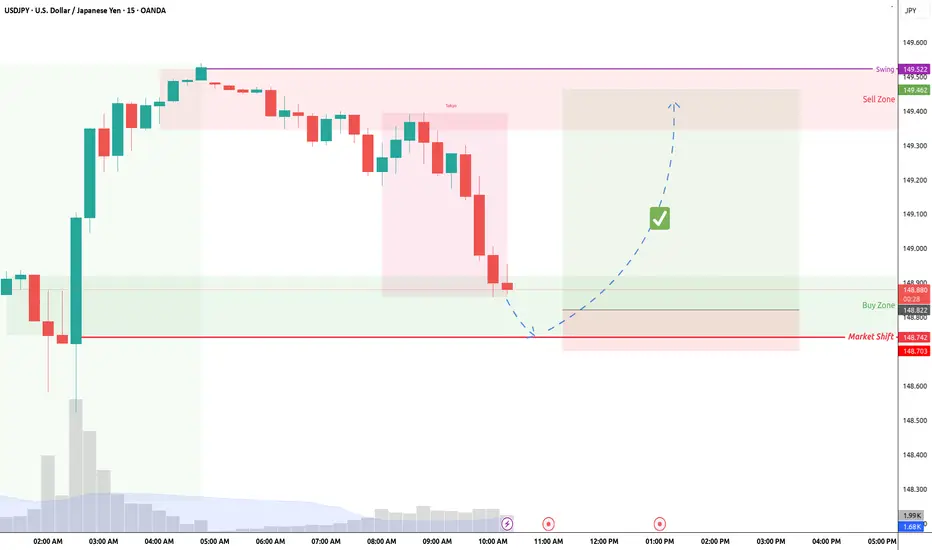
USDJPY POTENTIAL CONTINUATION AFTER A PULLBACKPrice has returned to the recent demand zone after a BOS and is now showing signs of rejection following a pullback (retracement). The mitigation of the DEMAND zone suggests that institutions may have filled their buy orders and are now ready to push price higher.
📉 Execution Plan:
• Entry: On the demand zone
• SL: Just below the demand zone (allow breathing room).
• TP: Next supply zone or based on structure (e.g., swing high, imbalance fill).
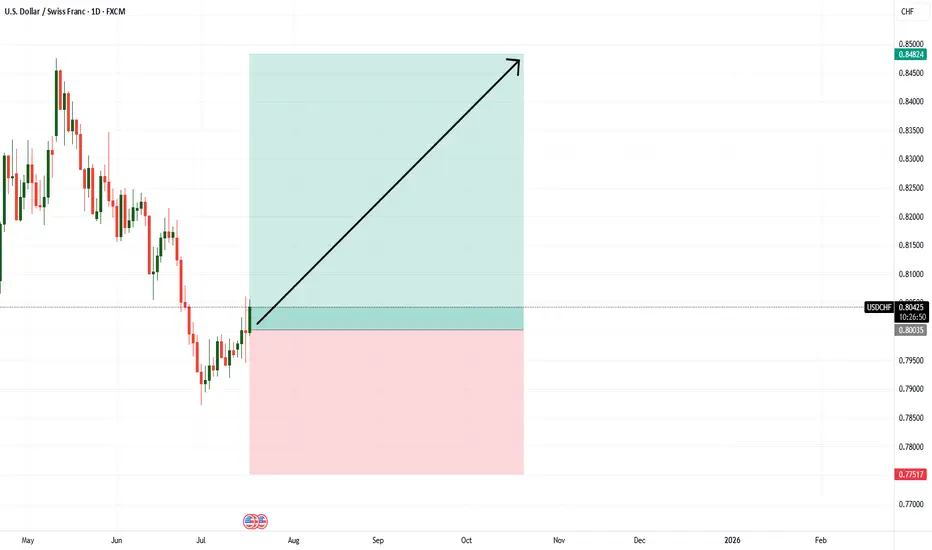
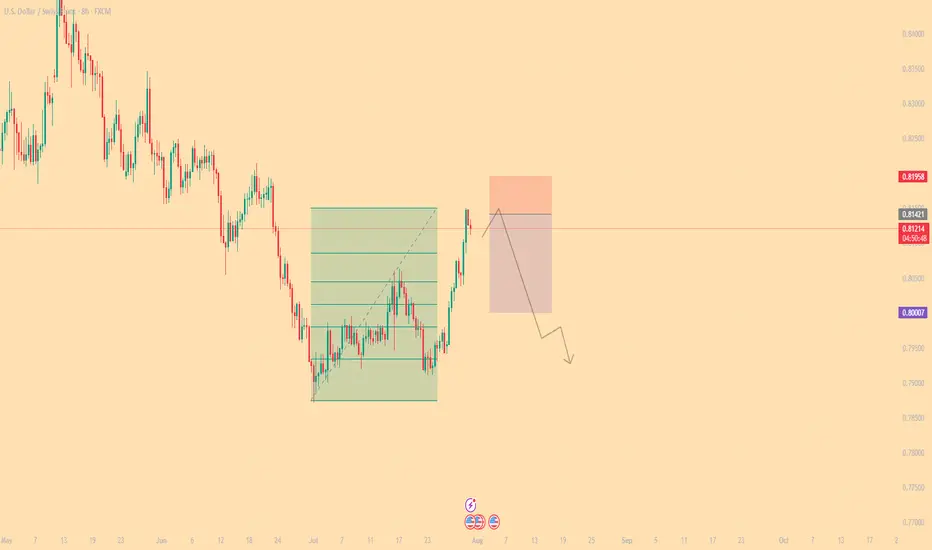
#015: USD/CHF SHORT Investment OpportunityHello readers, I'm Forex Trader Andrea Russo, and today I'd like to share this SHORT investment opportunity I've identified in the USD/CHF pair.
In recent days, USD/CHF has exhibited typical technical exhaustion behavior near key dynamic resistance. The area between 0.81300 and 0.81650 represented a significant supply zone, previously tested with an extended spike and immediately rejected.
The price violated the 200 EMA with an apparent breakout, but without real institutional volume to support the move. This was followed by a rapid retracement below the mean and a sideways movement, suggesting ongoing manipulation and liquidity building.
Meanwhile, global retail sentiment shows a significant anomaly: over 70% of retail traders are long. This imbalance increases the likelihood that market makers are preparing a bearish reversal to target the most fragile positions and restore equilibrium.
The 0.81420 level has been identified as a key point for a possible price reversion to the manipulative zone before the actual directional move. If the price reverts to this level, a technical spike is likely to be executed to complete the hunt for stops before the downtrend begins.
The trade targets a decline towards the 0.80000 area, which represents the first significant level of technical support and a realistic target if the reversal is confirmed.
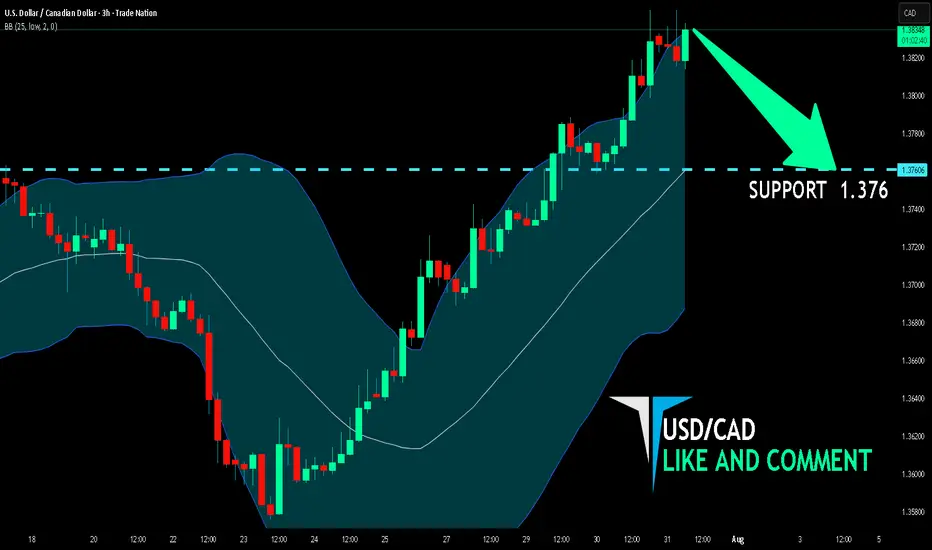
USD/CAD SHORT FROM RESISTANCE
Hello, Friends!
It makes sense for us to go short on USD/CAD right now from the resistance line above with the target of 1.376 because of the confluence of the two strong factors which are the general downtrend on the previous 1W candle and the overbought situation on the lower TF determined by it’s proximity to the upper BB band.
Disclosure: I am part of Trade Nation's Influencer program and receive a monthly fee for using their TradingView charts in my analysis.
✅LIKE AND COMMENT MY IDEAS✅
Trailing Stops:Let trades developTrailing stops are one of the most underused tools in a trader’s playbook. Most traders spend hours obsessing over entries, but then wing the exit or bail too early the moment a red candle appears. That’s where trailing stops come in. They give your trades room to breathe, while gradually reducing risk as price moves in your favour.
If you’ve ever caught a good move and felt unsure about how long to hold it, this one’s for you.
Here are three practical ways to trail your stop, stay in the trade, and help manage profitable trades objectively.
1. Trail Behind Structure
This is the simplest and most intuitive method. As the trade moves in your favour, you move your stop just behind the most recent swing high or low. In a long trade, that means raising your stop to sit just below the latest higher low. In a short, you drop it just above the most recent lower high.
This approach works best in clean, trending conditions. It gives the trade room to develop naturally without forcing you to guess the top. You won’t capture the absolute high, but you’ll often stay in the move longer than most.
It also keeps you in rhythm with the market. If the structure is broken, it’s a pretty good sign that the trend is changing or stalling and that’s a logical place to step aside.
Example:
Here’s a clean example of using structure to trail stops on a momentum trade. The entry came on a break and retest of resistance, with the initial stop placed just below the retest level. As the trade moved higher, a series of higher swing lows developed, providing clear reference points to adjust the stop.
It’s not designed to catch the exact top and that’s fine. The goal is to follow price action with minimal lag, using objective structure rather than guesswork.
EUR/USD Hourly Candle Chart
Past performance is not a reliable indicator of future results
2. Use Moving Averages
Trailing stops don’t have to follow every single swing. Sometimes, a smoother option is better, especially if you want to stay in a move that’s trending hard. That’s where moving averages come in.
A short-term exponential moving average like the 9 or 21 EMA can act as a dynamic trailing stop. As long as price remains above the average, the trend is intact and you stay in. If price closes below the EMA in a long trade, or you get a crossover in the opposite direction, that can signal an exit or at least a scale-down.
This method works best in fast, directional markets. It won’t suit every condition, but when the move is strong, letting a trade run along the moving average keeps things simple and stress-free.
Example:
In this short-term 5-minute chart example, the 21 EMA acts as a dynamic trailing stop. There are two common approaches. You can wait for a candle to close below the 21 EMA, or use a crossover trigger where the 9 EMA crosses under the 21 EMA. The choice depends on how tightly you want to manage the trade and how much room you are willing to give it.
S&P 500 5min Candle Chart
Past performance is not a reliable indicator of future results
3. Volatility-Based Stops (ATR)
When the market gets fast and messy, a fixed stop can either get hit too easily or feel too far away. That’s where volatility-based stops come in. The most common tool for this is the Average True Range (ATR).
Instead of using swing points, you trail your stop a set number of ATRs behind the current price. If ATR is rising, your stop gives the trade more room. If volatility shrinks, the stop tightens naturally. It’s an adaptive approach that works well in conditions where price is expanding or moving fast.
A popular setting is to use two times the current ATR value, but you can adjust it to suit your timeframe or risk tolerance.
Example:
This is a classic wedge breakout setup in gold. A trailing stop set at two times the ATR helps manage risk while giving the trade enough room to breathe. As price moves in your favour, the stop tightens automatically based on volatility. It’s worth remembering that trailing stops are only adjusted in one direction. Once set, they follow the move but are never loosened, which means the stop will eventually take you out as momentum fades or the market turns.
Gold Daily Candle Chart
Past performance is not a reliable indicator of future results
Decide on Your Technique BEFORE You Place the Trade
There’s no perfect way to trail a stop. Each method has its strengths. Structure-based stops keep you aligned with price action. EMAs are smooth and simple. ATR lets volatility do the work for you.
The most important thing is to make a decision before you place the trade. Know whether you’re using a manual swing method or a dynamic indicator. Know what would trigger a move in your stop, and what would keep it steady. Avoid changing the plan just because the trade gets emotional.
Trailing stops give you freedom. They let you step back, protect your capital and give your best trades a real chance to develop. Used properly, they enhance trade management consistency.
Disclaimer: This is for information and learning purposes only. The information provided does not constitute investment advice nor take into account the individual financial circumstances or objectives of any investor. Any information that may be provided relating to past performance is not a reliable indicator of future results or performance. Social media channels are not relevant for UK residents.
Spread bets and CFDs are complex instruments and come with a high risk of losing money rapidly due to leverage. 85.24% of retail investor accounts lose money when trading spread bets and CFDs with this provider. You should consider whether you understand how spread bets and CFDs work and whether you can afford to take the high risk of losing your money.
USDJPY 60/15 Pullback LongOverall up trend. Yesterday session a 'b' market profile. Aways from POC. looking for up continuous. Now is in pullback, montior for long oppoturnity.
If break and stay below market shift, then no go.
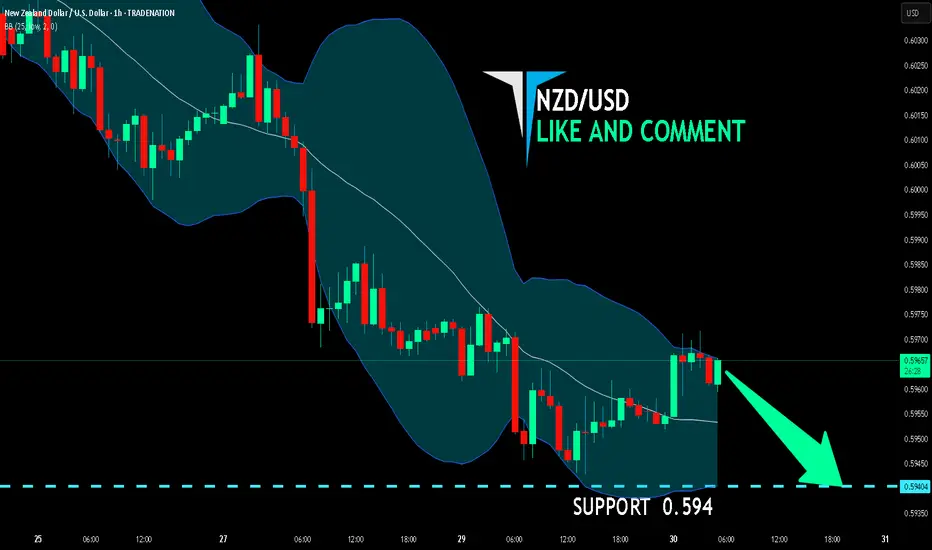
NZD/USD SELLERS WILL DOMINATE THE MARKET|SHORT
Hello, Friends!
NZD-USD uptrend evident from the last 1W green candle makes short trades more risky, but the current set-up targeting 0.594 area still presents a good opportunity for us to sell the pair because the resistance line is nearby and the BB upper band is close which indicates the overbought state of the NZD/USD pair.
Disclosure: I am part of Trade Nation's Influencer program and receive a monthly fee for using their TradingView charts in my analysis.
✅LIKE AND COMMENT MY IDEAS✅
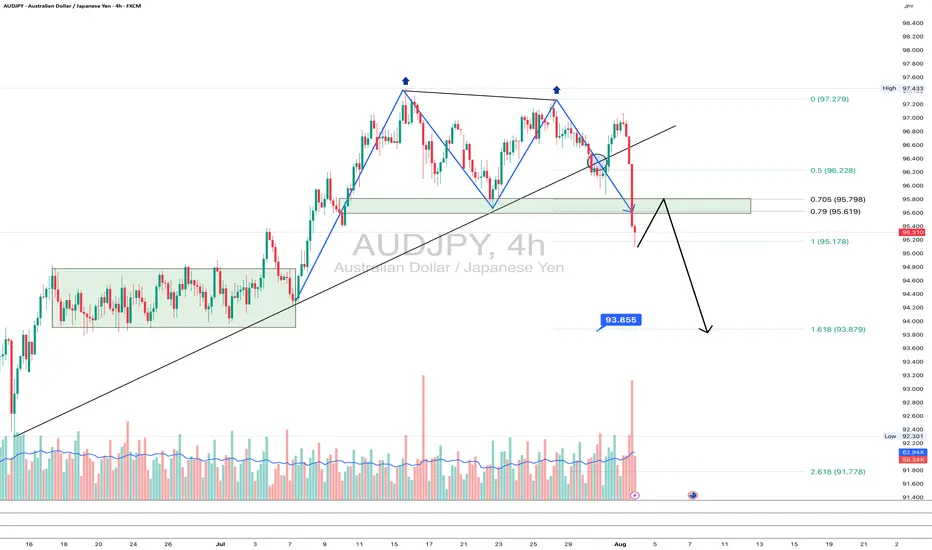
AUDJPY: goodbye uptrend?On the 4H chart, AUDJPY has printed a textbook double top pattern, breaking the rising trendline and diving below the 95.6–95.78 support zone - now acting as resistance. The pair is currently retesting this zone from below, which often provides a clean re-entry point for bears.
This area also aligns with the 0.705–0.79 Fibonacci retracement, reinforcing it as a key resistance. If the price rejects this zone, the next target is 93.85 (1.618 Fibo projection), followed by 93.25 and potentially 91.71 if momentum strengthens.
Fundamentally, the yen gains strength on risk-off flows and diverging rate expectations, while the Australian dollar is pressured by falling commodity prices and a likely pause from the RBA. This widens the rate differential and weakens AUD.
As long as price remains below 95.78, sellers are in control. Watch for a rejection from this retest zone.
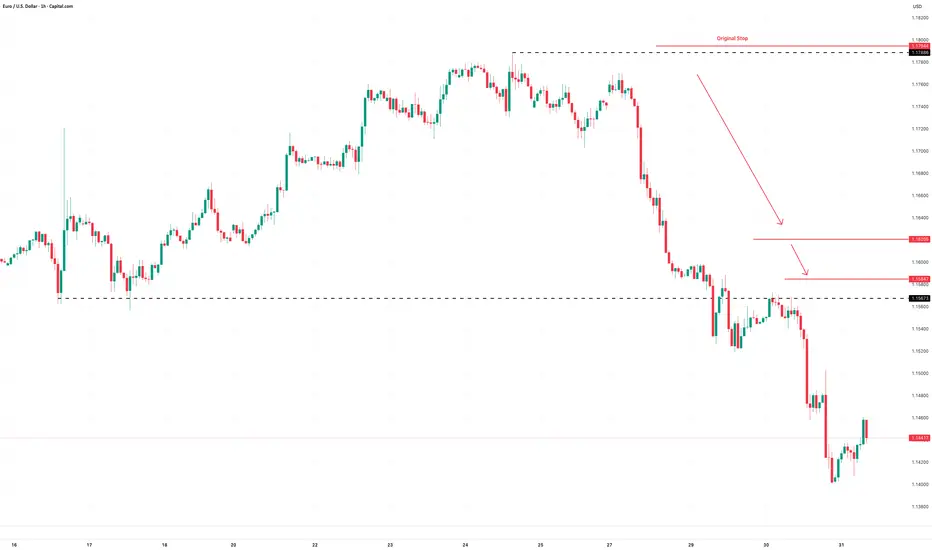
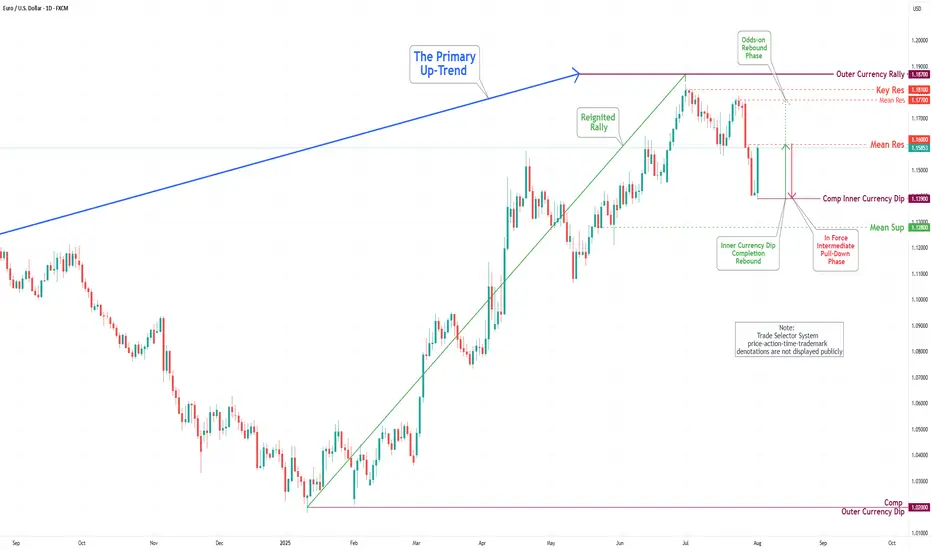
EUR/USD Daily Chart Analysis For Week of August 1, 2025Technical Analysis and Outlook:
In this week's trading session, the Euro experienced a significant drop, reaching the 1.139 level, and completing what is referred to as the Inner Currency Dip. As a result of the completion, the currency reversed direction and made a strong rebound, hitting the Mean Resistance level at 1.160. Recent analyses suggest that the Euro is likely to enter a sustained downward move after retesting the Mean Resistance at 1.160, with the target set to revisit the completed Inner Currency Dip at 1.139. However, it is essential to consider the possibility of continued upward momentum towards the Mean Resistance level of 1.177. Such a movement could trigger a significant rebound and lead to the completion of the Outer Currency Rally at 1.187.
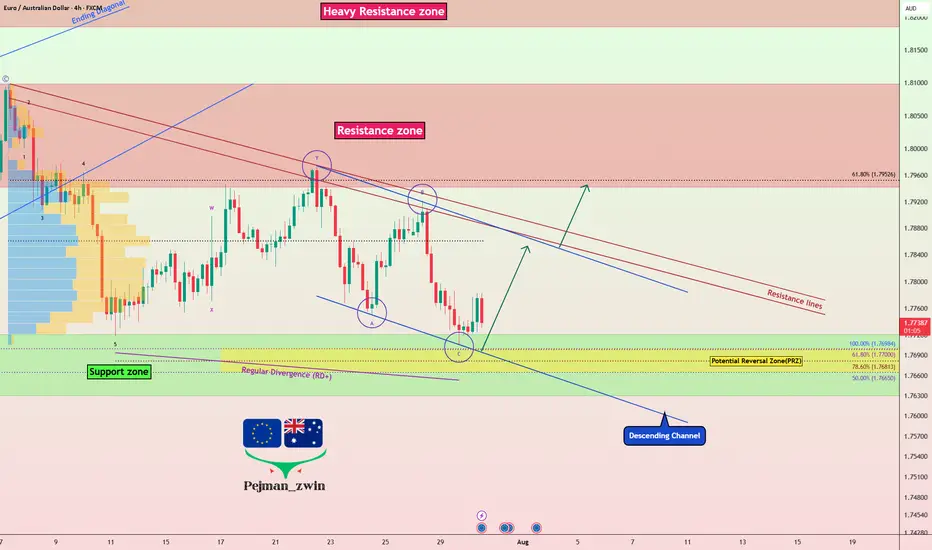
EURAUD Ready to Bounce? Key Support & Fundamentals Aligned!Today I want to share a Long position idea on EURAUD ( OANDA:EURAUD ) with you.
From a fundamental perspective , both the Euro (EUR) and Australian Dollar (AUD) are currently under pressure. However, the Aussie appears fundamentally weaker in the short term, making the EURAUD Long setup more favorable at this stage.
AUD Weakness :
The Reserve Bank of Australia (RBA) has held rates steady at 3.85%, but recent inflation data has dropped to 2.7%, the lowest in over 3 years.
Most economists now expect the RBA to cut rates in its next meeting in August, possibly by 25 basis points.
Slowing economic growth and dovish forward guidance from the central bank are weighing heavily on AUD sentiment.
EUR Outlook :
The European Central Bank (ECB) is also facing weak economic data, but is taking a more cautious approach toward cutting rates.
Despite softer PMIs and sluggish growth in countries like Germany and France, the ECB has not confirmed a near-term rate cut, keeping EUR relatively stable.
This divergence between the RBA’s dovish stance and the ECB’s pause is supportive of EUR strength against AUD.
Summary :
With the RBA likely to ease policy soon and the ECB holding ground for now, the interest rate differential favors EURAUD upside. Fundamentals point toward further weakness in AUD, making the EURAUD Long a strategically sound trade idea for the coming days.
-------------------------------------------
Now let's analyze the conditions of the EURAUD chart on the 4-hour time frame .
EURAUD is currently trading near the Support zone(1.772 AUD-1.763 AUD) , Potential Reversal Zone(PRZ) , and near the lower line of the descending channel .
According to Elliott Wave theory , EURAUD appears to have completed a Zigzag Correction(ABC/5-3-5) .
Also, we can see the Regular Divergence(RD+) between Consecutive Valleys .
I expect EURAUD to rise to at least 1.784 AUD .
Second Target: 1.792 AUD
Note: Stop Loss(SL): 1.762 AUD
Please respect each other's ideas and express them politely if you agree or disagree.
Euro/Australian Dollar Analyze (EURAUD), 4-hour time frame.
Be sure to follow the updated ideas.
Do not forget to put a Stop loss for your positions (For every position you want to open).
Please follow your strategy and updates; this is just my Idea, and I will gladly see your ideas in this post.
Please do not forget the ✅' like '✅ button 🙏😊 & Share it with your friends; thanks, and Trade safe.