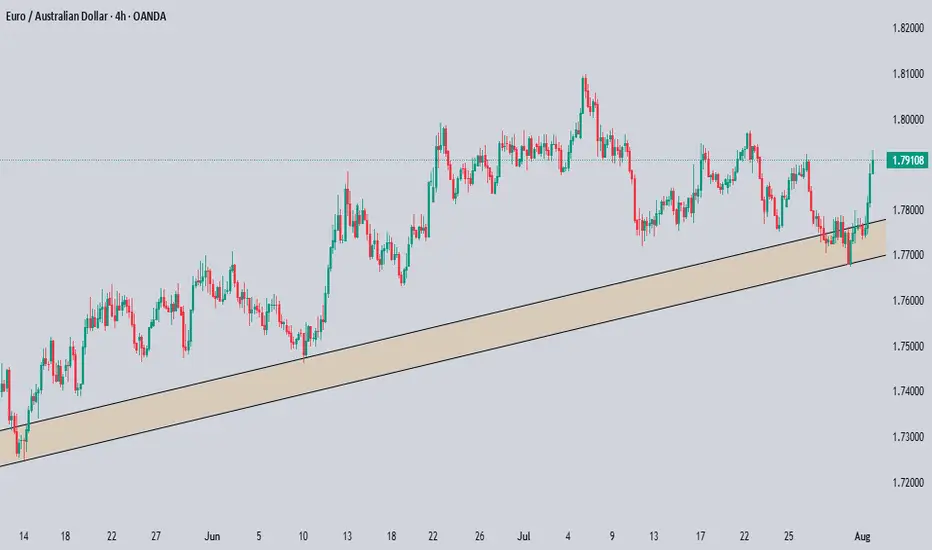
EURAUD BULLISH MOVE CONTINUESOur analysis is based on a multi-timeframe top-down approach and fundamental analysis.
Based on our assessment, the price is expected to return to the monthly level.
DISCLAIMER: This analysis may change at any time without notice and is solely intended to assist traders in making independent investment decisions. Please note that this is a prediction, and I have no obligation to act on it, nor should you.
Please support our analysis with a boost or comment!
Forex market
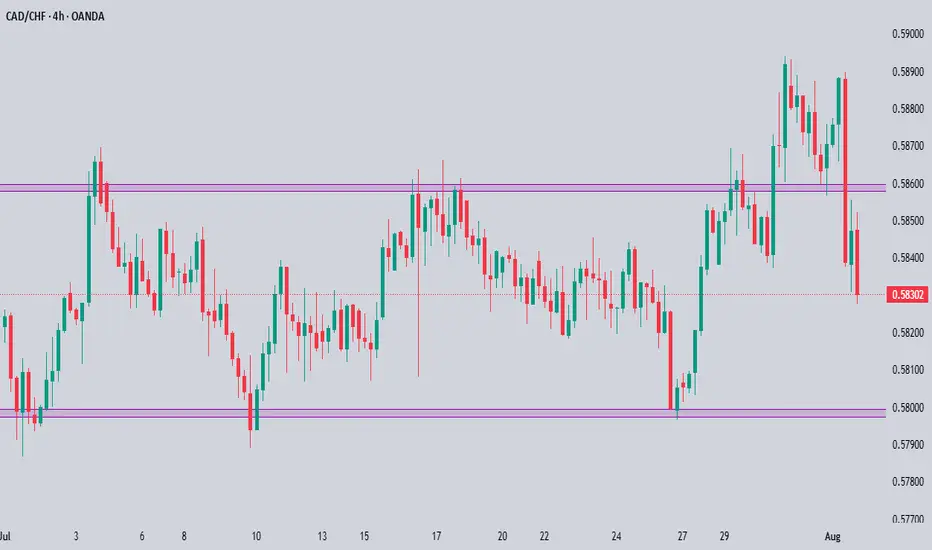
CADCHF Technical & Order Flow AnalysisOur analysis is based on a multi-timeframe top-down approach and fundamental analysis.
Based on our assessment, the price is expected to return to the monthly level.
DISCLAIMER: This analysis may change at any time without notice and is solely intended to assist traders in making independent investment decisions. Please note that this is a prediction, and I have no obligation to act on it, nor should you.
Please support our analysis with a boost or comment!
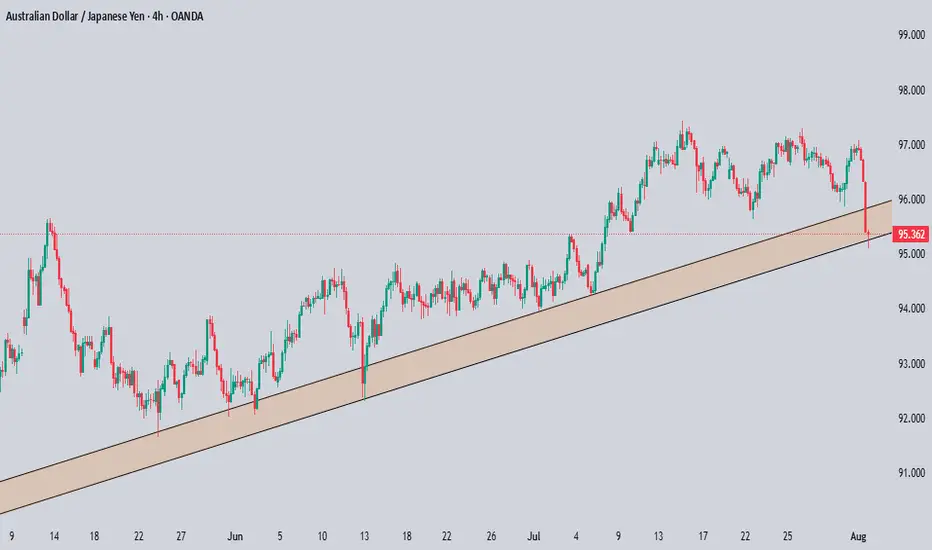
AUDJPY Technical & Order Flow AnalysisOur analysis is based on a multi-timeframe top-down approach and fundamental analysis.
Based on our assessment, the price is expected to return to the monthly level.
DISCLAIMER: This analysis may change at any time without notice and is solely intended to assist traders in making independent investment decisions. Please note that this is a prediction, and I have no obligation to act on it, nor should you.
Please support our analysis with a boost or comment!
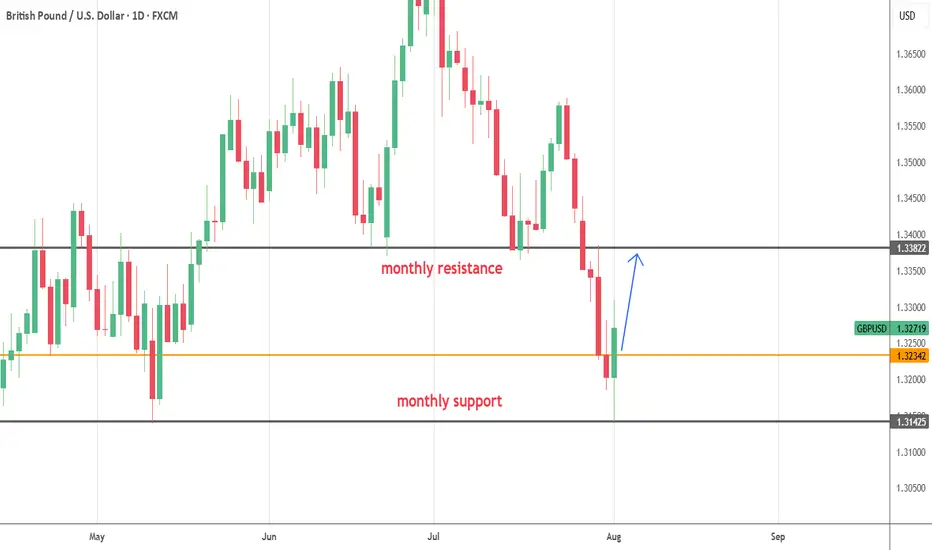
GBPUSD--LONG--02-08-25--Bouncing up from monthly support around1.31425 (black horizantal line),price at least move higher to the monthly resistance around 1.33822(black horizantal line)
--best entry level is between 1.325 and 1.328
Eur/Audin this pair we can buy save i dont see sell signals , any way be cearful use money management

Usd/Cadafter three bottoms its time to go up , return to my last chart on CAD u can see what i have said, buy.

Gbp/jpy sellno wonder its friday , last signal was complete wrong , any way gbp/jpy going up but we must test 192 to 190 at first
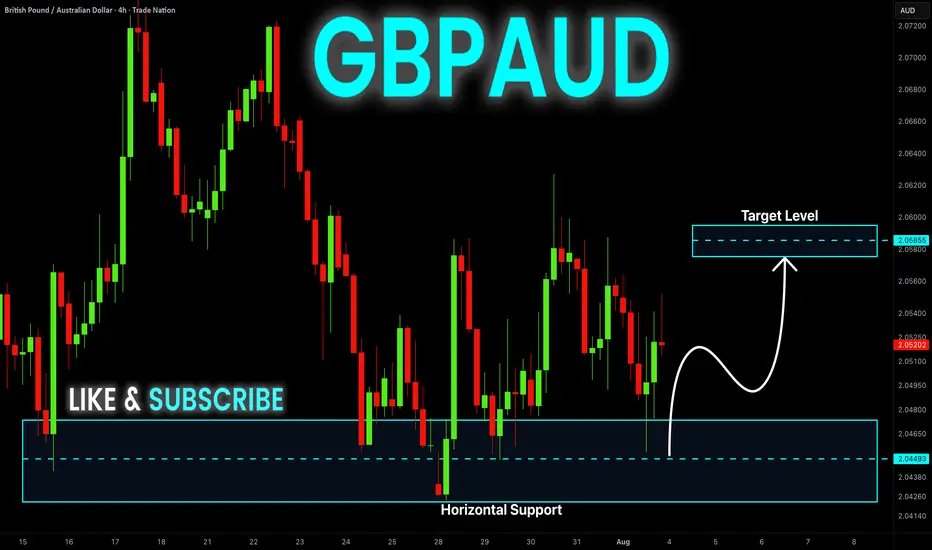
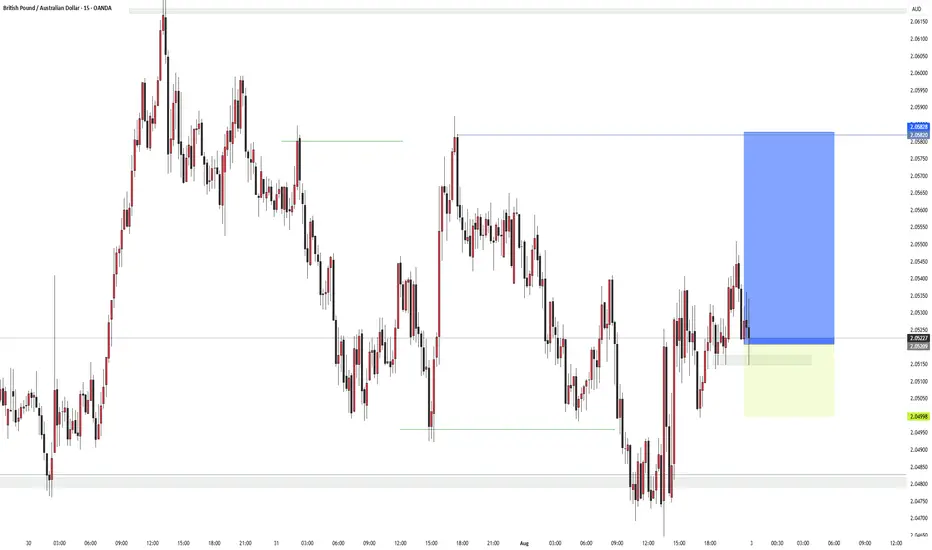
GBP-AUD Growth Ahead! Buy!
Hello,Traders!
GBP-AUD made a retest
Of the horizontal support
Of 2.0420 and we are
Already seeing a bullish
Rebound so we will be
Expecting a further
Bullish move up
Buy!
Comment and subscribe to help us grow!
Check out other forecasts below too!
Disclosure: I am part of Trade Nation's Influencer program and receive a monthly fee for using their TradingView charts in my analysis.
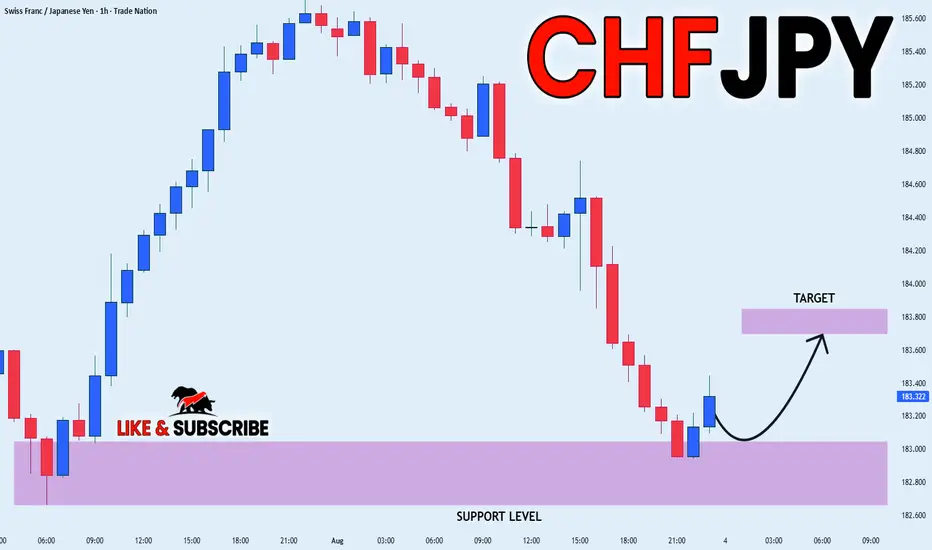
CHF_JPY RISKY LONG|
✅CHF_JPY has retested a key support level of 182.800
And as the pair is already making a bullish rebound
A move up to retest the supply level above at 183.700 is likely
LONG🚀
✅Like and subscribe to never miss a new idea!✅
Disclosure: I am part of Trade Nation's Influencer program and receive a monthly fee for using their TradingView charts in my analysis.
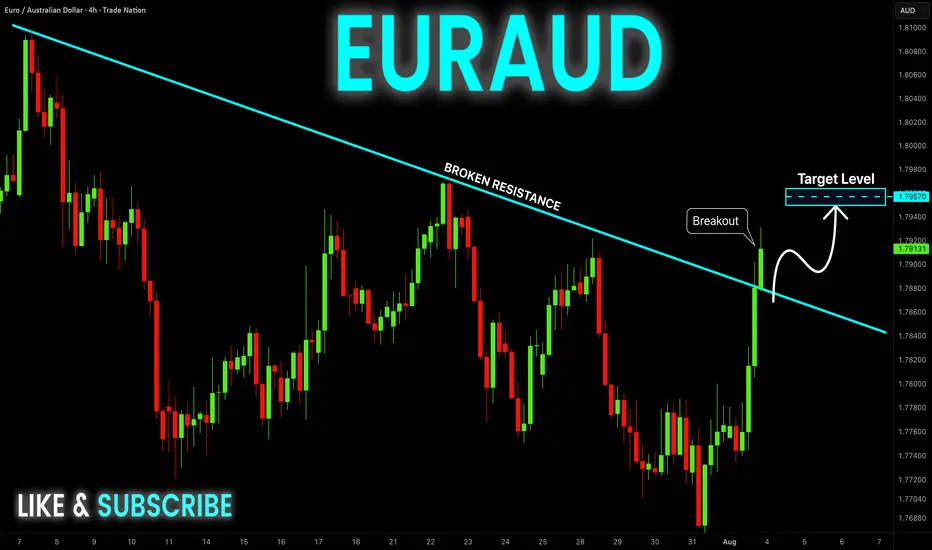
EUR-AUD Bullish Breakout! Buy!
Hello,Traders!
EUR-AUD made a bullish
Breakout of the falling resistance
And the breakout is confirmed
So we are bullish biased
And we will be expecting
A further bullish move up
On Monday!
Buy!
Comment and subscribe to help us grow!
Check out other forecasts below too!
Disclosure: I am part of Trade Nation's Influencer program and receive a monthly fee for using their TradingView charts in my analysis.
GBPAUDSometimes you have to look beyond profit and loss. My previous bias on this trade still stands ,I got stopped out, it happens. But this setup looks solid, and it doesn’t hurt to take another shot.RISK TO REWARD, this will potentially cover the previous trade.
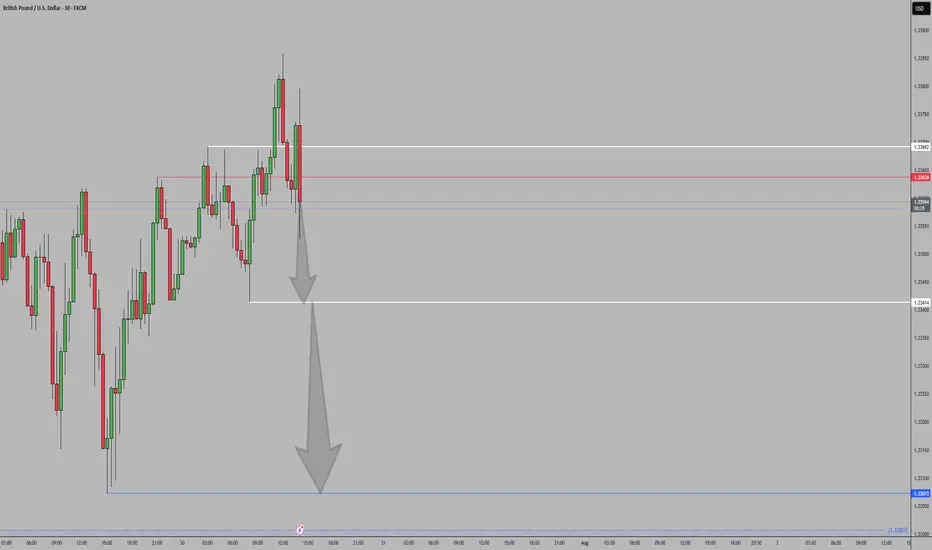
GBPUSDPrice Action: A key support zone has been broken and is now acting as resistance.
Market Structure: Lower highs + lower lows forming → confirms downtrend.
Bias: Bearish while price stays under the broken level.

GBPUSDWeekly review for directional bias
Align trades with institutional positioning
Focus only on setups that confirm sentiment
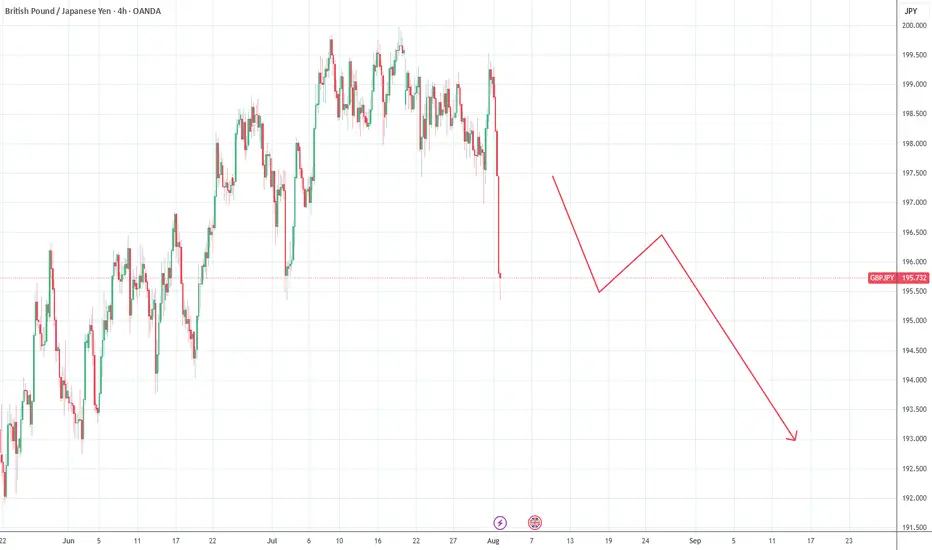
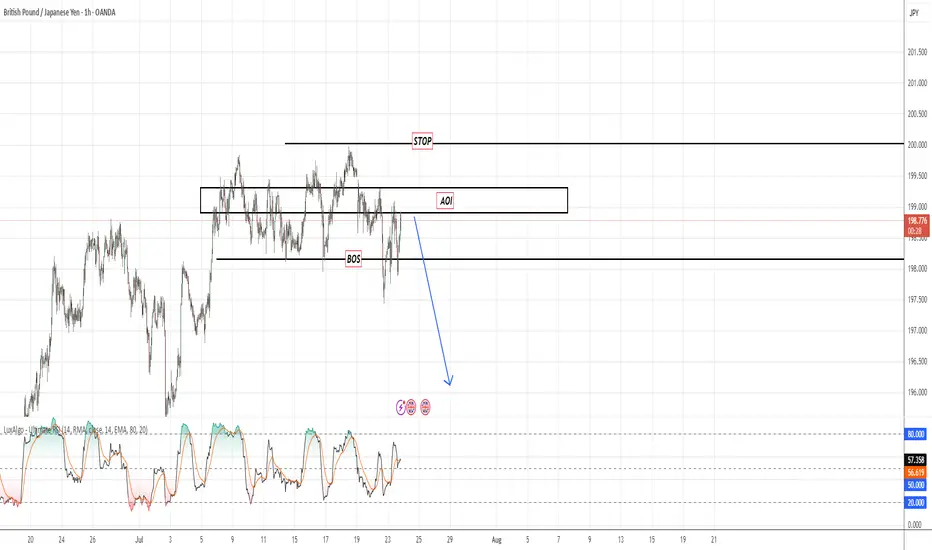
GBPJPY
🧠 Technical Breakdown:
✅ Clear Break of Structure (BoS) around 198.75
🔁 Price retested the Area of Interest (AOI) at previous support now turned resistance
🔻 Strong rejection wick confirms bearish pressure
📉 Expecting continuation toward 195.01 as next major liquidity zone
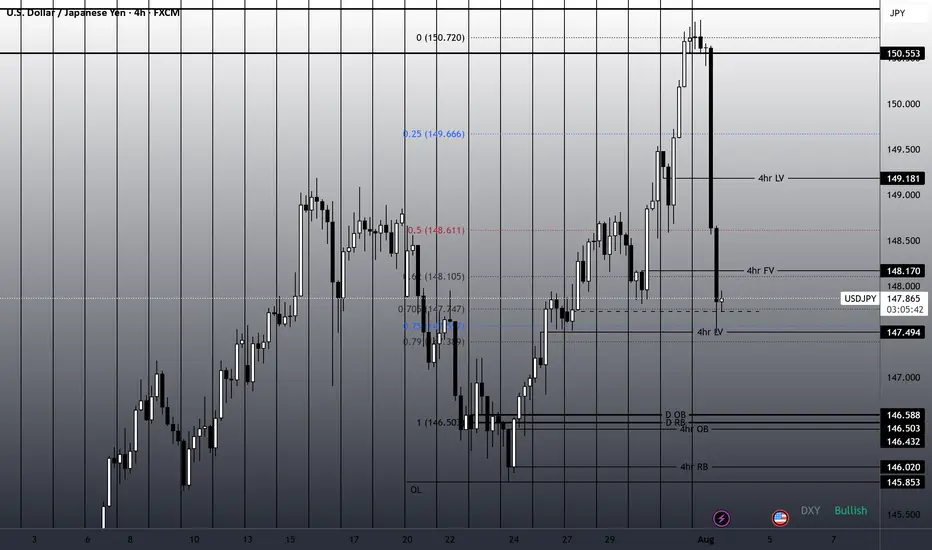
304-PIP Move on USDJPY in One Day - Trading NFP ProfitablyOn August 1st, USDJPY experienced a massive 304-pip drop after a strong impulse into the daily order block. From there, the daily order block was respected, and the retracement was induced by the USD Non-Farm Payrolls news release, leading to a sharp move down to a four-hour liquidity void, hitting the 75% Fibonacci retracement level.
This move highlights the precision of combining institutional levels with news catalysts, capturing a significant move in a short timeframe.
This is Outlier Trading Folks.
AUDCHF: Broken Support, Bearish Flow In Play Timeframe: 1H
Bias: Bearish
Type: Support Turncoat → Breakdown Play
📊 Technical Setup
AUDCHF previously broke the 4H resistance (0.5236) which flipped to support. However, price has now broken below this support, confirming it as a failed demand zone.
• Entry: Market execution or retest of 0.5236
• SL: Above 0.5245
• TP: 0.5189
• RR: ~1:2
• RSI: Below 50 and heading lower = momentum supports downside
📉 Macro & Fundamental Confluence
• AUD Weakness: RBA dovish, conditional score declining, bearish seasonality
• CHF Slightly Less Weak: Despite SNB dovish stance, CHF is outperforming AUD
• COT + Sentiment: AUD CFTC weakening, CHF holding steady
• Risk Sentiment: RISK ON environment reduces CHF demand but AUD still underperforms
🧭 Gameplan
“Support failed to hold. Bearish pressure intensifies. Target previous swing low zone.”
🔔 Watch for retest of 0.5236 for better RR setup before continuing short.

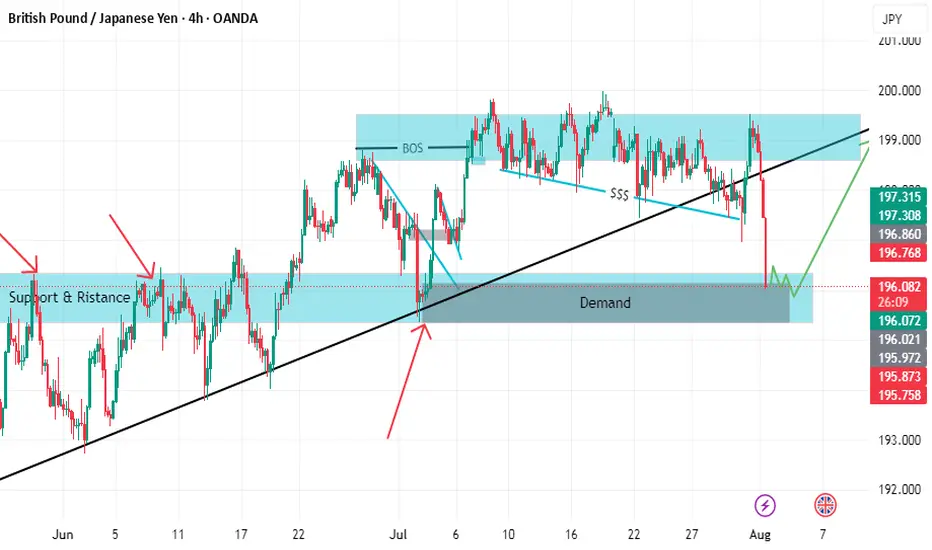
GBPJPY BUY SETUP LOOOOOOOOOOOOONGWELCOME TO YOU
we have support which is strong with retest
and we have demand and before it imbalance if you focus on photo
and the price make bos and take liquidity so i will buy with you .but prefer to be there conformation for buying
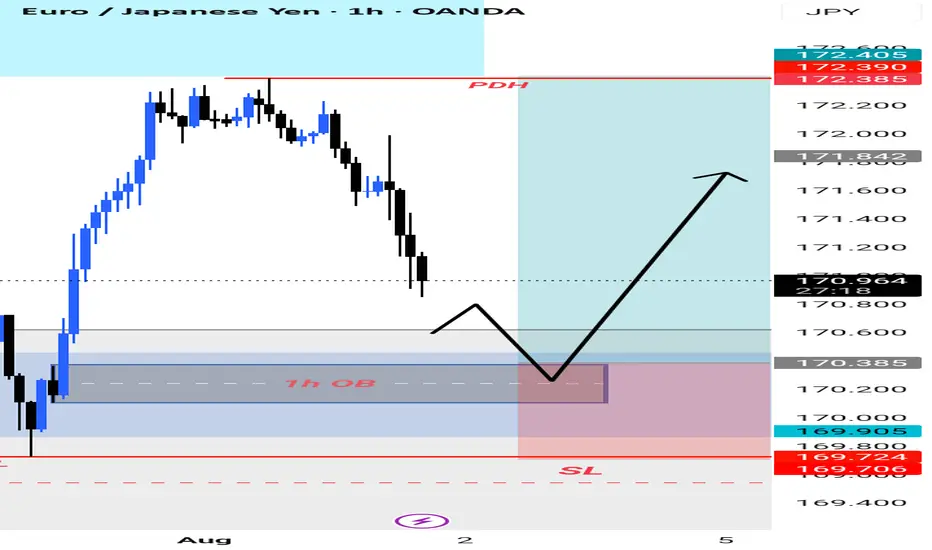
EURJPY Next Trade PlanThis Is not Advice. This is my view for next trade for a Swing, Maybe Market Goes Up With 1H OB. And Next Target Is Today High. It's My Analysis Maybe I,m wrong Because Market Is not 100% predictable.
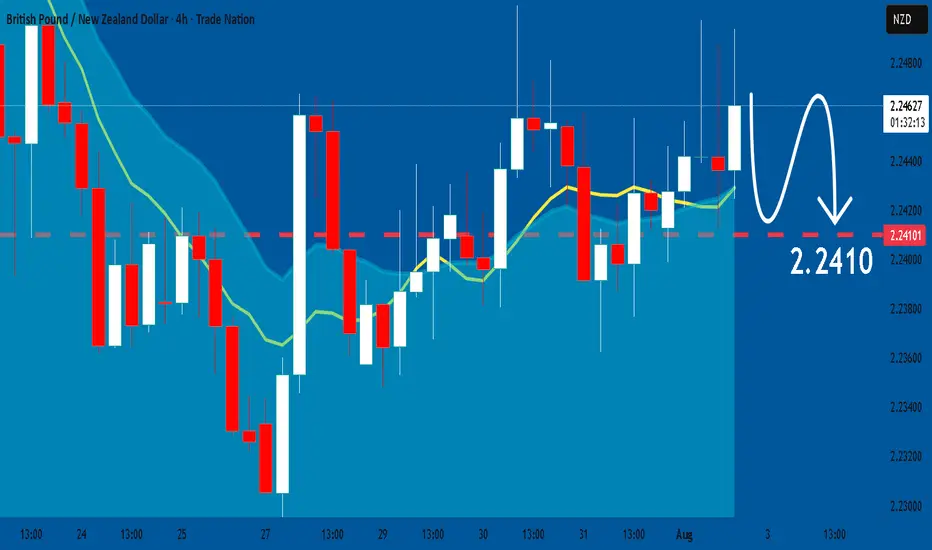
GBPNZD: Will Keep Falling! Here is Why:
The charts are full of distraction, disturbance and are a graveyard of fear and greed which shall not cloud our judgement on the current state of affairs in the GBPNZD pair price action which suggests a high likelihood of a coming move down.
Disclosure: I am part of Trade Nation's Influencer program and receive a monthly fee for using their TradingView charts in my analysis.
❤️ Please, support our work with like & comment! ❤️
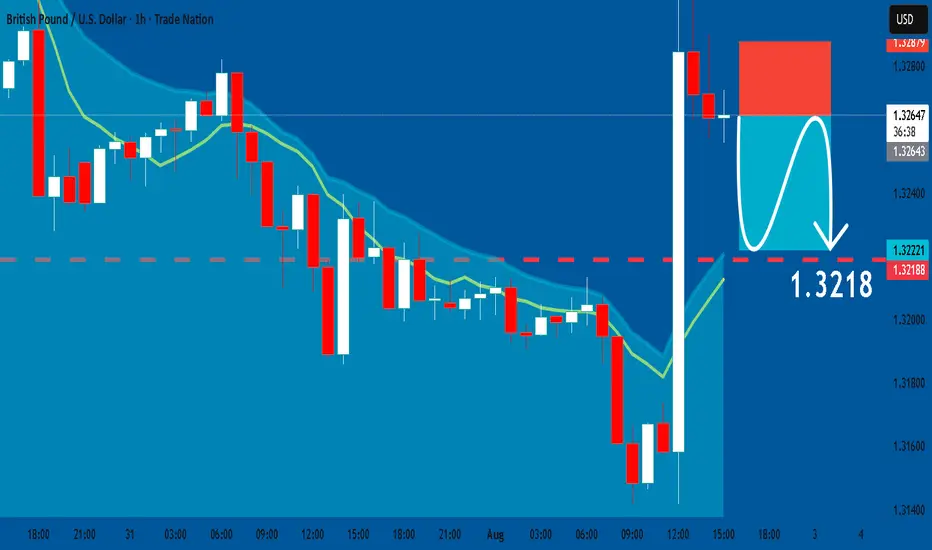
GBPUSD: Bearish Continuation & Short Signal
GBPUSD
- Classic bearish setup
- Our team expects bearish continuation
SUGGESTED TRADE:
Swing Trade
Short GBPUSD
Entry Point - 1.3264
Stop Loss - 1.3287
Take Profit -1.3218
Our Risk - 1%
Start protection of your profits from lower levels
Disclosure: I am part of Trade Nation's Influencer program and receive a monthly fee for using their TradingView charts in my analysis.
❤️Please, support our work with like & comment! ❤️
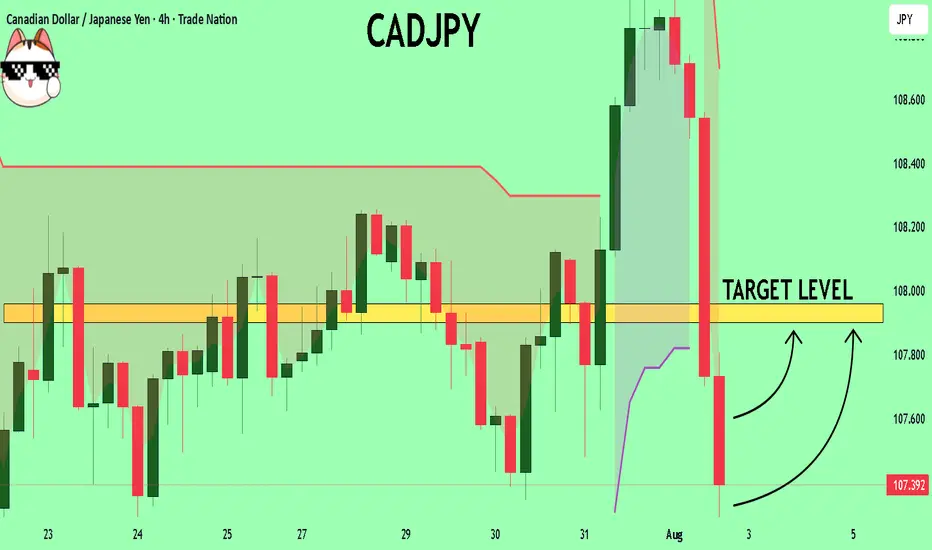
CADJPY Expected Growth! BUY!
My dear friends,
CADJPY looks like it will make a good move, and here are the details:
The market is trading on 107.35 pivot level.
Bias - Bullish
Technical Indicators: Supper Trend generates a clear long signal while Pivot Point HL is currently determining the overall Bullish trend of the market.
Goal - 107.90
About Used Indicators:
Pivot points are a great way to identify areas of support and resistance, but they work best when combined with other kinds of technical analysis
Disclosure: I am part of Trade Nation's Influencer program and receive a monthly fee for using their TradingView charts in my analysis.
———————————
WISH YOU ALL LUCK
EUR/AUD LongLike the long off the bottom the range for a bounce back up off the 1.77250 area to maybe first area of 1.78900 and full take profit of 1.79700
FX:EURAUD
