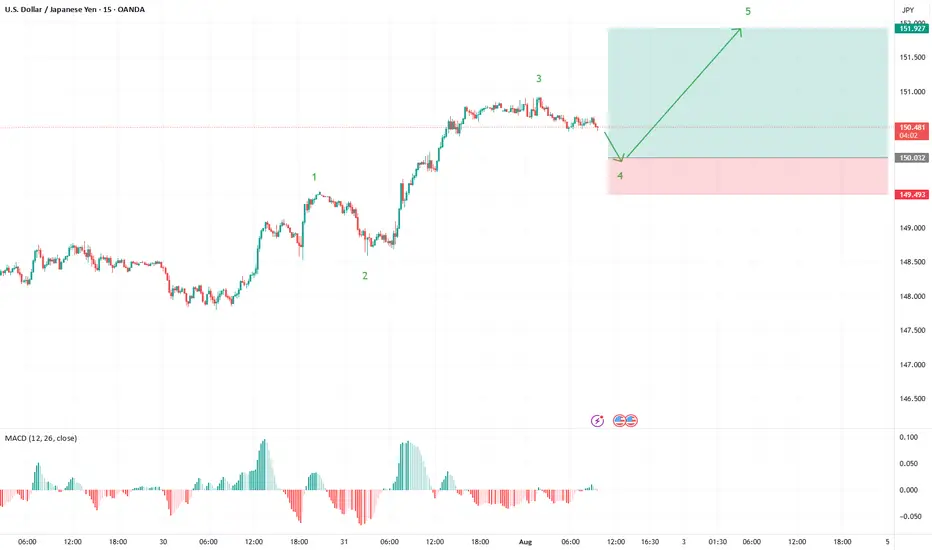
USD/JPY: Fifth Wave Target in SightUSD/JPY is painting a textbook five-wave impulse structure from the recent lows, and we're now positioned for what could be the final act of this motive sequence.
Current Wave Count
✅ Waves 1-3 Complete: Clean impulsive structure with wave 3 showing strong extension
✅ Wave 4 in Progress: Currently correcting from the 150.94 high
🎯 Wave 5 Setup: Targeting completion around 151.95 - 152.20
Key Levels to Watch
Support Zone: 150.00 area (ideal wave 4 retracement)
This aligns with wave principle fourth-wave correction parameters
Provides a healthy pullback without threatening wave 1 overlap
Target: 151.95 - 152.20 zone for wave 5 completion
Classic 5 vs 1+3 projection
Trade Strategy
Monitor for supportive price action near 150.00
Look for an impulsive price action to confirm wave 5 beginning
Structure suggests one more leg higher before a larger correction
The beauty of Elliott Wave: when the count is this clean, the roadmap becomes crystal clear. Let's see if USD/JPY delivers this final push to complete the sequence.
Forex market
The Day AheadWeekly Summary – Key Data & Earnings (Week Ending August 2, 2025):
Economic Data:
US Jobs Report: Job growth slowed slightly; unemployment ticked up. Supports Fed holding rates steady.
US Manufacturing (ISM): Sector still shrinking, showing weakness.
US Car Sales & Construction: Car sales rose; construction spending up, led by infrastructure.
China Manufacturing: Still contracting due to weak demand.
Japan Jobs Data: Job market remains tight and stable.
Italy: Manufacturing down, car sales slightly up, budget and retail sales steady.
Eurozone Inflation: Inflation slowed, increasing chances of ECB rate cuts.
Canada Manufacturing: Slipped into contraction.
Earnings Highlights:
Exxon & Chevron: Mixed—refining strong, but oil prices hurt results.
Linde: Solid growth from healthcare and clean energy demand.
Nintendo: Strong game and digital sales boosted profits.
AXA: Insurance strong, but investment income dipped.
Regeneron: Beat forecasts, thanks to strong drug sales.
Ares: Private credit demand lifted earnings.
Engie: Renewables helped balance weaker thermal output.
Daimler Truck: Demand steady, but profit margins hit by costs.
LyondellBasell: Missed targets due to weak chemicals demand.
Moderna: COVID sales down; focus now on future drug pipeline.
Takeaway:
The global economy is slowing, but US jobs and spending remain resilient. Companies reported mixed earnings. Central banks are likely to stay cautious, with possible rate cuts ahead if weakness continues.
This communication is for informational purposes only and should not be viewed as any form of recommendation as to a particular course of action or as investment advice. It is not intended as an offer or solicitation for the purchase or sale of any financial instrument or as an official confirmation of any transaction. Opinions, estimates and assumptions expressed herein are made as of the date of this communication and are subject to change without notice. This communication has been prepared based upon information, including market prices, data and other information, believed to be reliable; however, Trade Nation does not warrant its completeness or accuracy. All market prices and market data contained in or attached to this communication are indicative and subject to change without notice.
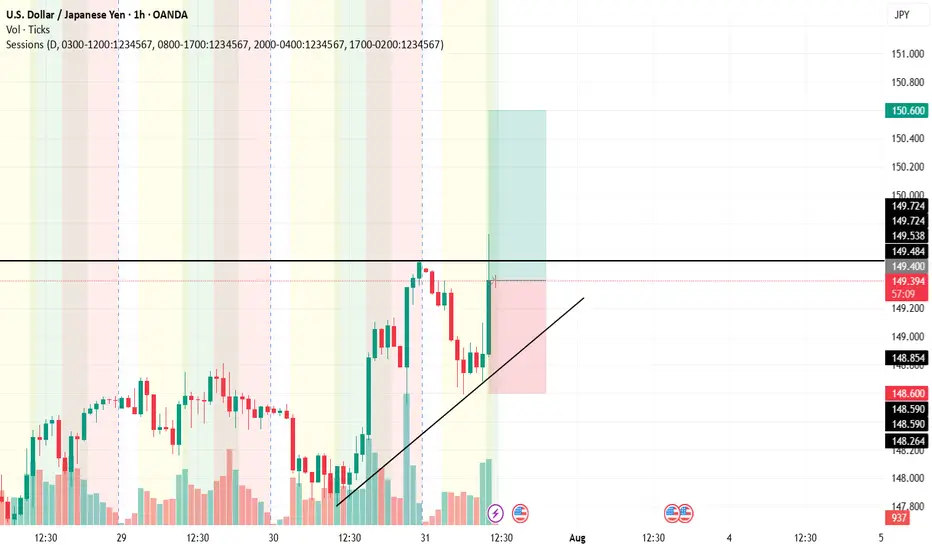
USD/JPY USD/JPY – Bullish Setup in Line with the Prevailing Trend
As the overall trend remains bullish, we are considering a potential long setup on USD/JPY. The structure suggests continued upside momentum, and we aim to close the trade by the end of the European session.
📍 Entry: 149.400
🎯 Target: 150.600
🛑 Stop-loss: 148.600
This idea aligns with current market direction and intraday trend strength. Traders should watch for supportive price action to confirm the move.
Disclaimer: This analysis is for educational purposes only and does not constitute financial advice. Always do your own research and manage risk appropriately.
AUD/USDAUD/USD – Possible Correction Scenario Based on Volume Analysis
This idea presents a potential correction in AUD/USD, based on recent volume behavior suggesting a shift in market sentiment.
Following a strong move, volume has started to decline near the recent lows, hinting at possible seller exhaustion. This may open the path for a short-term bullish correction toward higher value areas.
📍 Entry: 0.64681
🎯 Target: 0.65050
🛑 Stop-loss: 0.64428
This is a possible scenario, not a guaranteed outcome. Always monitor price action and volume for confirmation.
Disclaimer: This analysis is for educational purposes only and does not constitute financial advice. Always do your own research and manage risk appropriately.
Ask ChatGPT

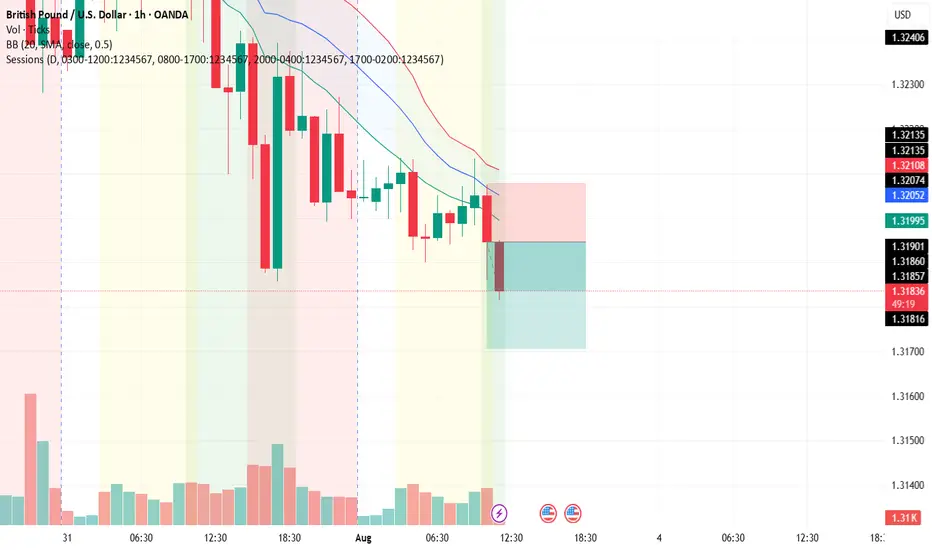
GBP/USDHello traders!
This is a trade setup for GBP/USD, based on volume and trend analysis.
Entry Price: 1.31947
Stop-Loss (SL): 1.32077
Take-Profit (TP): 1.31707
The trade is intended to be executed instantly at the mentioned price, in alignment with both volume behavior and the current trend direction.
Disclaimer: This setup is shared purely for backtesting purposes and to document trade ideas. It is not financial advice. Always perform your own analysis before making any trading decisions.
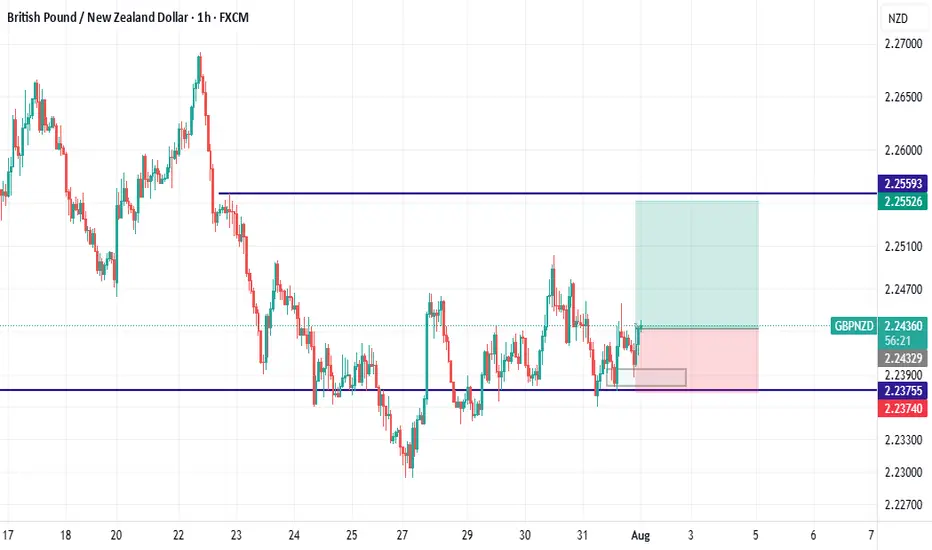
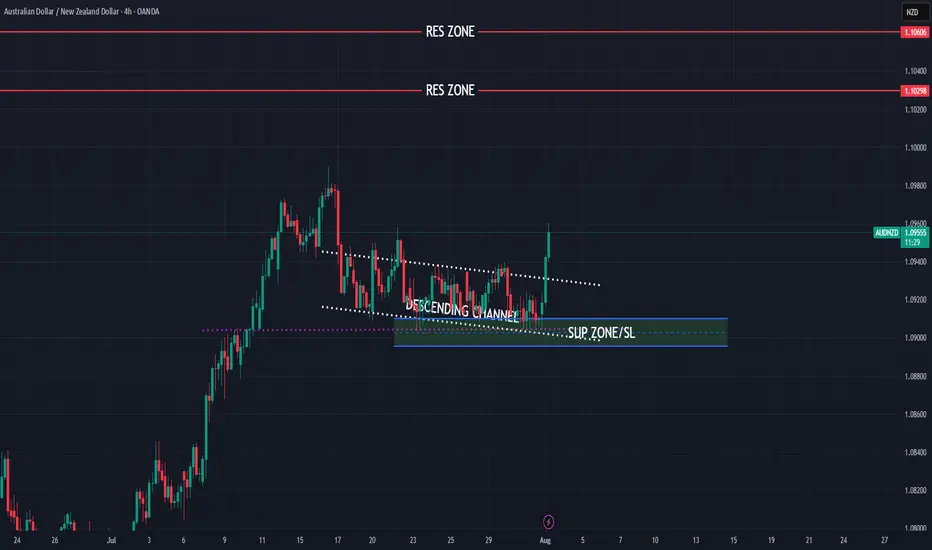
AUDNZD still bullish trend expecting
OANDA:AUDNZD last five analysis accurate (attached), here is new view on AUDNZD, still bullish expecting, price is not break strong zone, bouncing - pushing strongly from same, looks like DESCENDING CHANNEL is breaked.
Here still bullish expectations having.
SUP zone: 1.09100
RES zone: 1.10300, 1.10600
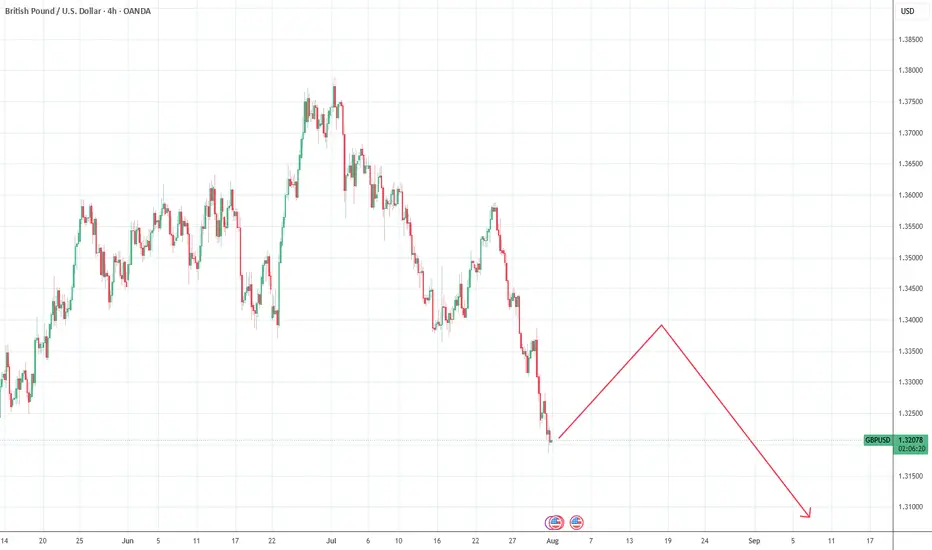
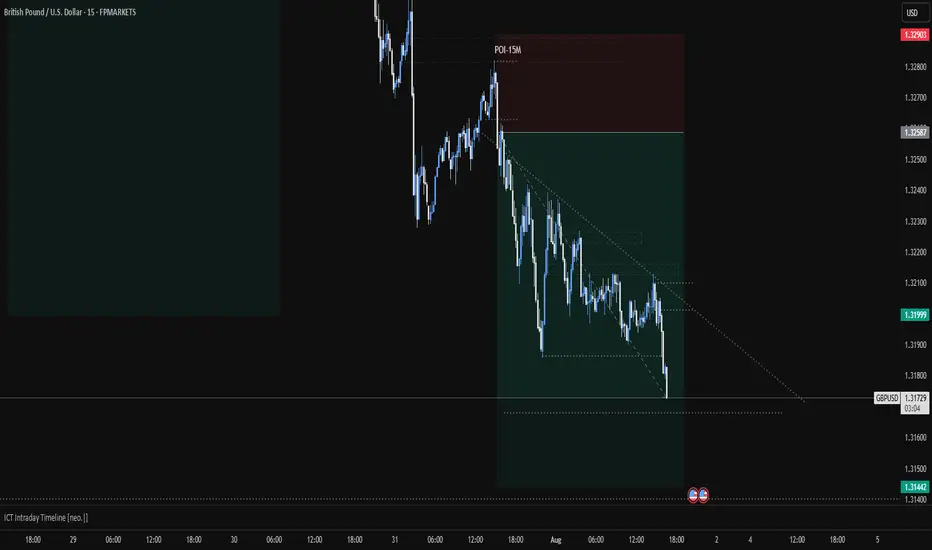
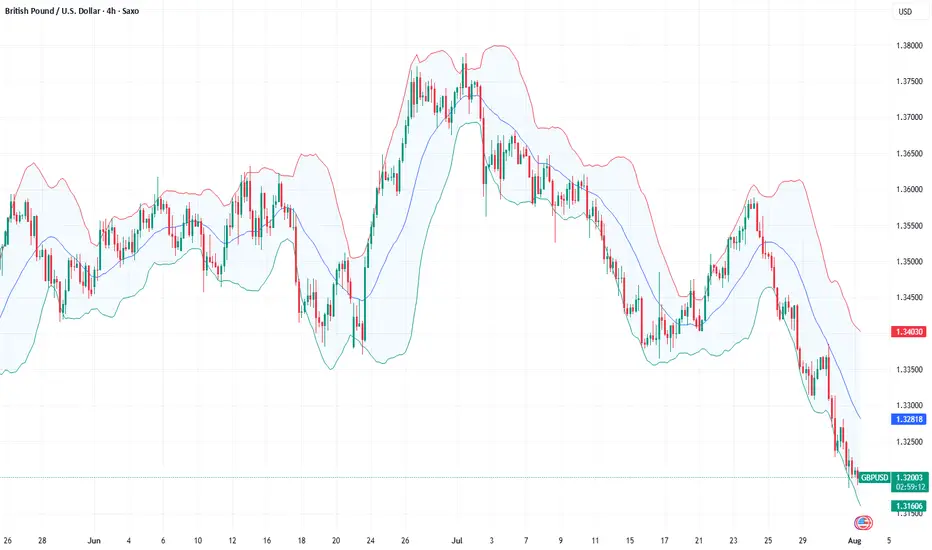
Could GBPUSD break the support at 1.3100?The pound extended its decline amid a stronger dollar and softening UK labour market, which fueled BoE rate cut expectations. From a technical perspective, GBPUSD broke out of the ascending channel and closed below the Ichimoku Cloud. If GBPUSD extends its decline and breaks the support at 1.3100, the price could approach the following swing low at 1.2720. Conversely, a rebound from the support at 1.3100 could prompt a retest of the resistance at 1.3380.
By Li Xing Gan, Financial Markets Strategist Consultant to Exness

GBPUSDAs the USD continues to rise, the GBP is expected to drop further, possibly reaching the previous support at 1.31448.
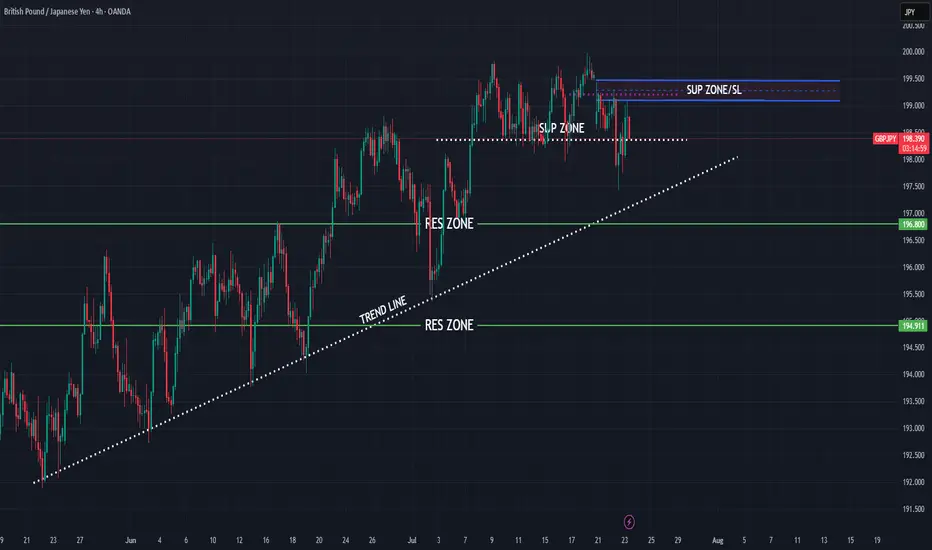
GBPJPY bearish expectations
OANDA:GBPJPY long time bullish trend we are have, currently price in zone, changes on this point expecting
SUP zone: 199.100
RES zone: 196.800, 194.900
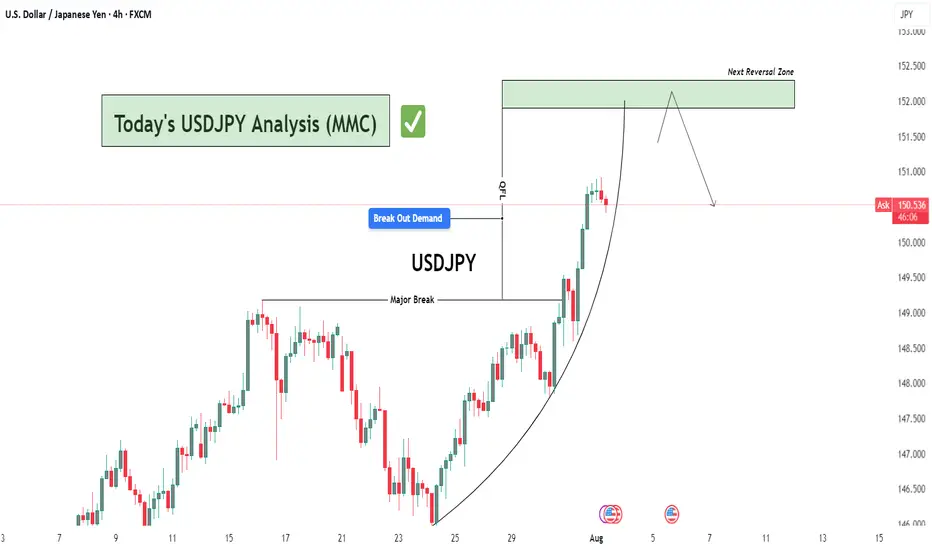
USDJPY Analysis : Key Reversal Zone After Parabolic Rally🧠 Market Psychology & Structure
The USDJPY 4-hour chart reveals a classic parabolic curve pattern signifying an acceleration phase in bullish momentum. This phase typically occurs during the final stages of a bullish move, where price action becomes increasingly steep due to aggressive buyer participation.
The rounded curve drawn on the chart reflects momentum compression—where pullbacks become shallower, and higher highs are formed rapidly. However, this pattern often ends in a blow-off top or a sharp correction, especially when approaching key supply zones.
🧩 Key Technical Highlights
Major Break Zone: The previous resistance around 148.80–149.00 (now flipped to support) was clearly broken with strong bullish candles, confirming trend continuation.
Break Out Demand : Price retested the breakout zone (around 149.80–150.00) before launching higher, validating this level as a new demand zone.
Current Price Action: The pair is currently hovering around 150.50 after a powerful rally, showing early signs of exhaustion with smaller bullish candles and slight upper wicks.
🔍 Target Area – Next Reversal Zone (151.80–152.30)
The green highlighted zone marks a strong supply area / reversal zone, identified from:
Previous price rejections in historical data.
Overbought conditions due to vertical rally.
Completion of the parabolic structure (climax zone).
We can expect price to reach this zone in the coming sessions, where it may:
Face strong selling pressure.
Trigger short positions from institutional sellers.
Lead to distribution or reversal back toward the demand area near 150.00.
🔄 Forecast & Trade Plan
Scenario 1 (High Probability): Price taps into 151.80–152.30, forms bearish engulfing or rejection wick, then pulls back to 150.00 or lower.
Scenario 2 (Invalidation): Strong breakout above 152.30 with momentum—bullish continuation towards 153.00+ possible.
🧠 Trader’s Mindset (MMC Insight)
This chart suggests a matured bullish trend nearing exhaustion. As smart traders, we anticipate rather than react. Wait for the price to reach the supply zone, then observe for confirmation (bearish structure, divergence, candlestick pattern) before shorting.
Avoid chasing longs at these highs—risk-to-reward is no longer favorable. Patience will offer a much cleaner entry if the reversal unfolds as expected.
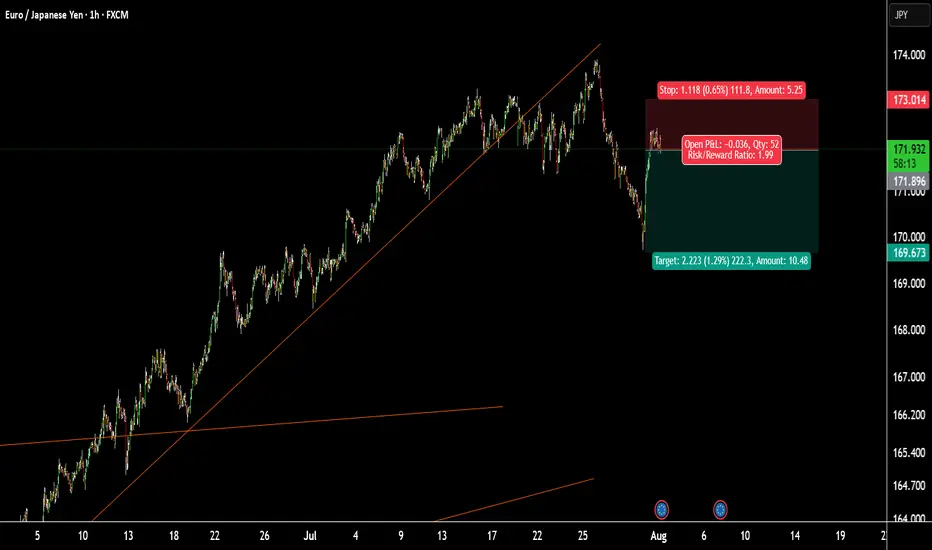
EURJPY SELLas the main trend line is brake and the lower low is accepted. I think it moves down and good for sell
EURJPY
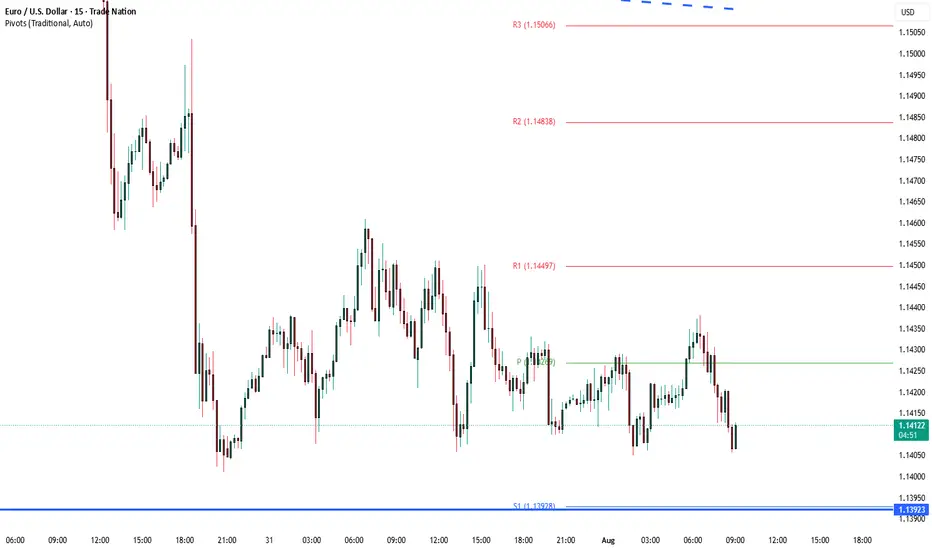
EU LONGCurrently monitoring EUR/USD for potential long opportunities. I’m looking for signs of bullish momentum supported by structure, liquidity sweeps, and alignment with DXY weakness. Waiting for a clean entry confirmation within a key demand or liquidity zone.

Fundamental Market Analysis for August 1, 2025 GBPUSDThe pound remains under pressure due to the strengthening of the dollar and expectations of further easing of the Bank of England's policy at its meeting on August 7. The regulator's rhetoric in June-July pointed to a “gradual and cautious” course of rate cuts amid weak growth, and the market is pricing in the likelihood of another move at the next meeting. The situation is complicated by the fact that July inflation in Britain unexpectedly accelerated, but the regulator interprets it as a temporary consequence of tariff and price shocks, not wanting to tighten financial conditions excessively.
The external environment is also unfavorable for the GBP: the US has imposed new tariffs on a number of trading partners, strengthening demand for the dollar as a risk-free asset. For the UK, the trade implications are mixed: part of the supply chain is focused on the dollar zone, and industry is sensitive to global demand, which, in the context of prolonged uncertainty, is hitting investment and employment expectations. The risks of a decline in private sector business activity remain elevated.
Today, attention is focused on US employment data: if the labor market confirms its stability, the likelihood of a Fed rate cut in September will decrease further, which will keep the dollar in the ascendancy. All these factors combined create a bearish bias for GBPUSD in the short term, with any brief rebounds from local oversold conditions typically being used for selling.
Trading recommendation: SELL 1.32000, SL 1.32500, TP 1.31000

EURAUD waiting for breakoutWe can see a breakout in upside in EURUAD after this consolidation as EA already tested it's support and swept the sell side liquidity. Targeting 1.78500 Zone Again for Testing and also forming a triangle pattern in 4H.
We can take a buy till that trend line test with tight SL.

#USDPJPY BUY#USDJPY currently facing this rejection on the Daily.
Our Expectation; we expect price to a lower level after this week’s rally, gather momentum and break this ceiling. From here, we will have a free run 🏃 to 154 and money will be made. Wait for our next sniper to swing signal next @tspsignals

USDPHP The last straw: Breakout Imminent (2025-2030) Support/Resistance: 60.00 (Last line of defense)
Target: 72.00 - 80.00 (Upper resistance)
Timeframe: 2025-2030
Technical Outlook:
USDPHP is currently positioned at a critical juncture, with the 60.00 level serving as the final resistance before a significant breakout. The pair has been consolidating in a tight range, building momentum for the next major move.
Breakout Scenario:
Once USDPHP decisively breaks above the 60.00 resistance level, we anticipate a rapid acceleration toward the 72.00-80.00 resistance target. This represents a potential 20% move from current levels.
What to Watch:
Volume confirmation on breakout
Momentum indicators (RSI, MACD)
Key resistance levels at 65.00, 68.00, 72.00 and 80.00
Philippine Peso fundamentals and USD strength

USD/JPY - Potential TargetsDear Friends in Trading,
How I see it,
Let me know if anything is unclear.
NFP TODAY - BE SAFE
1) 151.150 holds the key to broader upside at this time.
2) 1st resistance @ 150.730
3) Key support/Strong Demand @ 148.850
Keynote:
In case of a short correction of the previous day candle-
If price can hold above 149.500, potential for more upside remains high.
I sincerely hope my point of view offers a valued insight.
Thank you for taking the time study my analysis.

EURUSD 8H – 15% Yearly Channel Move, But Is This the Retest?EURUSD has been riding a clean parallel channel since early 2025, printing a steady +15.88% climb from the lower boundary to the upper resistance.
After mid-year rejection at the top of the range, we’re now testing the midline and eyeing the lower channel boundary. Structure still holds, but the next few candles may confirm if this is just a healthy retest or a bigger breakdown brewing.
Big macro structure. Simple levels. Watching for signs of momentum reclaim or deeper drift.

EUR NZD LONG SETUP Price was trading in a broadening falling wedge which is a bullish pattern and in Confluence with the supply zones above to be filled was why I entered the long trade from the support and demand zone.
Will see how price moves first, currently looks like it might hold the first supply zone also in Confluence with Bearish channel.
_THE_KLASSIC_TRADER_.