USDJPY Wave Analysis – 31 July 2025- USDJPY broke resistance zone
- Likely rise to resistance level 152.00
USDJPY currency pair recently broke the resistance zone located between the resistance level 148.85 (which stopped earlier waves A and i) and the 50% Fibonacci correction of the downward impulse from January.
The breakout of this resistance zone accelerated the active impulse wave c, which belongs to medium-term ABC correction (2) from April.
USDJPY currency pair can be expected to rise further to the next resistance level 152.00 (target price for the completion of the active impulse wave C).
Forex market

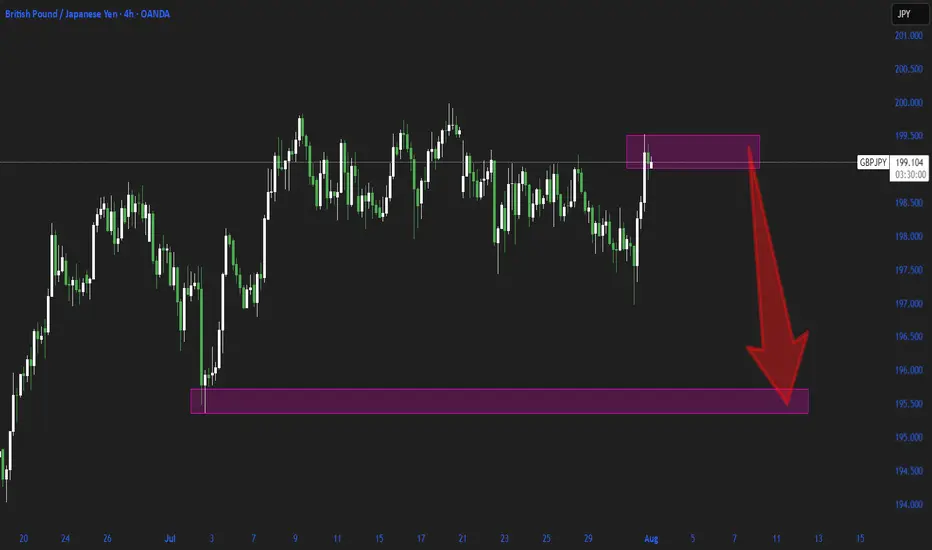
GBP JPY Another sell opportunityIn my previous analysis, I mentioned that GBP/JPY would turn bearish — and it dropped beautifully, around 280 pips.
Now, a new sell opportunity is setting up, and we can look to enter another short position.
JPY/USD — Long-Term Technical Setup & Market Outlook💱 JPY/USD — Long-Term Technical Setup & Market Outlook
1. 🧭 Market Context & Catalysts
US-Japan monetary divergence: The Fed remains rate-tight while the BoJ maintains ultra-loose policy, putting persistent downside pressure on the yen.
Economic drivers: Strong US economic data (growth, labor, inflation) supports USD strength; Japan’s macro data remains soft.
Sentiment signals: Hawkish Fed tone continues; safe-haven flows may limit further USD gains in geopolitical risk shifts.
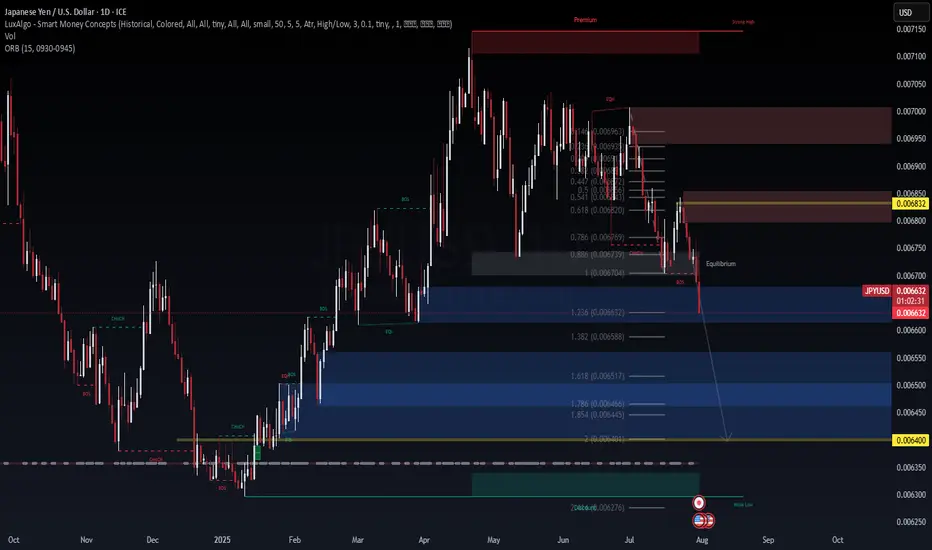
2. 🧱 Technical Structure (Daily Timeframe)
Break of structure (BOS) below 0.00700 signaled the dominant bearish regime.
The price retraced into the 0.786–0.886 Fibonacci zone (~0.00676–0.00679), then resumed selling—textbook re-entry into areas of liquidity (Equilibrium).
Current price sits near 0.006631, just below BOS and equilibrium zone—suggesting continuation of bearish order flow.
Fibonacci extensions show projected targets at 0.006632 (1.236), 0.006588 (1.382), 0.006517 (1.618), and potential support area at ~0.006400.
A stronger support zone exists near 0.006276 (Weak low / domain demand zone).
3. 📝 Trade Plan & Risk Controls
Continuation Setup: Look to enter on a clean bearish candle close near ~0.00665. Target the Fibonacci extensions at 1.236, 1.382, and 1.618—approximately 0.006632, 0.006588, and 0.006517 respectively. A deeper extension into the 0.006400 zone is also possible. Place the stop-loss just above 0.00670, as this level invalidates the recent break of structure and implies rejection of downside continuation.
Pullback Re-entry Setup: If price retraces higher, consider a re-entry short near ~0.00680. Use the same Fibonacci targets as above. Invalidate the setup if price breaks above 0.00680, which would suggest a shift toward bullish structure or absorption of the prior supply zone.
4. ⚠️ Watch Key Risks & Signals
If price breaks above the 0.786 zone or creates a higher high above equilibrium, bearish thesis fails.
Monitor US data releases: FOMC minutes, inflation or jobs data—shifts could accelerate USD momentum.
Geopolitical shocks or risk-off flows could trigger yen strength reversal.
✅ Summary Outlook
JPYUSD remains firmly bearish with technical integrity intact.
Valid corrective levels now become sell zones toward continuation targets.
Extended downside toward 0.00640 area is plausible, with further drop to 0.006276 zone if trend continues strongly.
GBPUSD BUYGBP/USD rebounds from lows, back above 1.3200
GBP/USD now alternates gains with losses in the low-1.3200s, reversing an early pullback to the 1.3180 zone. Meanwhile, Cable's inconclusive tone is accompanied by some renewed selling pressuron on the the US Dollar in the wake of US data releases.
Robust macroeconomic data releases from the United States (US) and the Federal Reserve's (Fed) cautious tone on policy-easing fuelled a bullish rally in the US Dollar (USD) midweek, causing GBP/USD to decline sharply.
The US Bureau of Economic Analysis' (BEA) first estimate showed that the United States' (US) economy staged an impressive comeback following the 0.5% contraction seen in the first quarter. The Gross Domestic Product (GDP) grew at an annual rate of 3% in the second quarter, surpassing the market expectation of 2.4%. Additionally, ADP Employment Change came in at 104,000 in July, beating analysts' estimate of 78,000 by a wide margin.
Later in the day, the Fed announced that it maintained the policy rate at the range of 4.25%-4.5% in a widely expected decision. The policy statement showed that Governor Christopher Waller and Governor Michelle Bowman dissented, preferring a 25 basis points (bps) rate cut, which was also anticipated.
In the post-meeting press conference, Fed Chairman Jerome Powell refrained from confirming a rate cut at the next meeting in September, citing heathy conditions in the labor market and explaining that the current policy stance as being appropriate to guard against inflation risks. Moreover, Powell said that the policy was not holding back the economy despite being still modestly restrictive.
According go the CME FedWatch Tool, the probability of a 25 basis points Fed rate cut in September dropped toward 40% from above-60% before the Fed event. In turn, US Treasury bond yields pushed higher and the USD outperformed its rivals during the American trading hours.
The BEA will release Personal Consumption Expenditures (PCE) Price Index data for June on Thursday. Powell said that they expect the annual PCE inflation and Core PCE inflation to come in at 2.5% and 2.7%, respectively. Weekly Initial Jobless Claims will also be featured in the US economic calendar. Ahead of Friday's critical July employment report, investors could remain hesitant to take large positions based on this data.
It's important to note that month-end flows on the last day of July could ramp up volatility toward the end of the European session and trigger irregular movements in the pair.
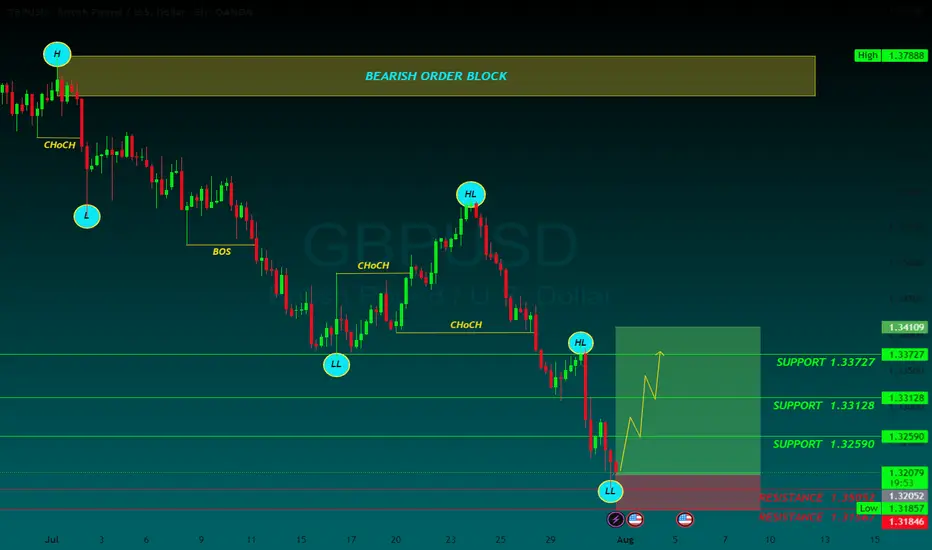
SUPPORT 1.33727
SUPPORT 1.33128
SUPPORT 1.32590
RESISTANCE 1.3052
RESISTANCE 1.31567
USD/INR pullback possible, USD/MXN eyes 18.95 USD/INR surged from 86.30 to nearly 87.85 in just over a week, driven by U.S. President Donald Trump announcing plans to impose a 25% tariff on select Indian exports.
The latest 4H candles show signs of exhaustion, with price stalling near the highs and forming small-bodied candles with upper wicks—suggesting weakening bullish momentum. A break below 87.45 could trigger a deeper pullback toward 87.20. However, if price reclaims 87.65, bulls may attempt another push toward 87.85 or new highs.
USD/MXN reversed from its late July low near 18.48 and has been climbing steadily, reaching 18.85 after the U.S. agreed to extend its current trade deal with Mexico by 90 days.
The trend potentially remains bullish on the 4H timeframe, with higher lows and clean upward structure. Price recently broke above short-term resistance near 18.80 and is now retesting the zone. A successful hold above this area could open room for a move toward 18.95. Failure to hold 18.75 could lead to a corrective drop back toward 18.70.

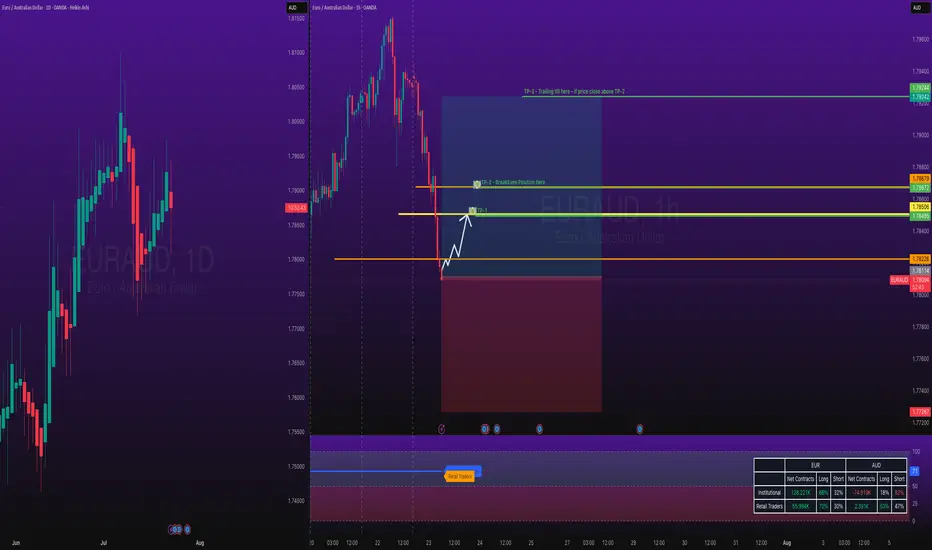
EURAUD Long TradeOANDA:EURAUD Long trade, with my back testing of this strategy, it hits multiple possible take profits, manage your position accordingly.
TP-1 is high probability.
This is good trade, don't overload your risk like greedy, be disciplined trader, this is good trade.
Use proper risk management
Looks like good trade.
Lets monitor.
Use proper risk management.
Disclaimer: only idea, not advice
sell cadchfwe reach to a resistance and then break the last low and pullback to broken low and then we enter....

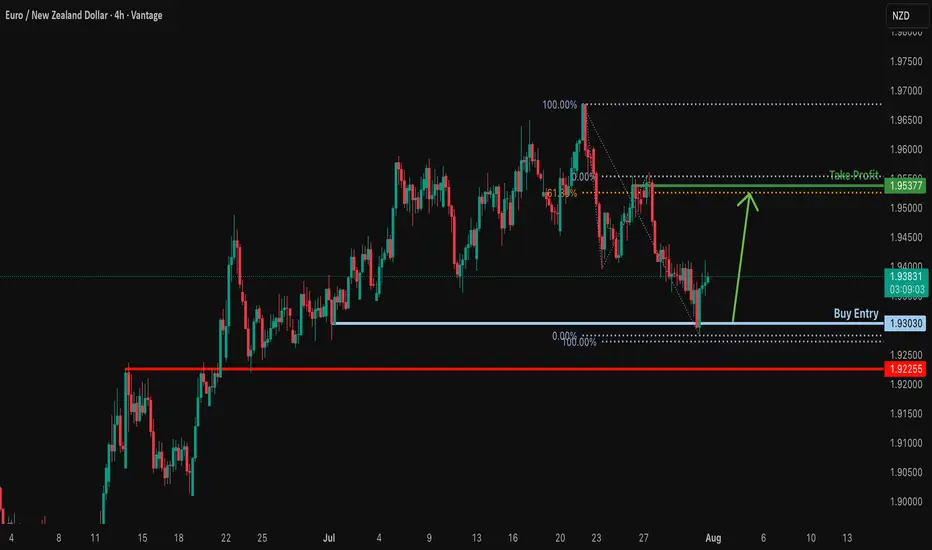
Bullish bounce off pullback support?EUR/NZD has bounced off the support level, which is a pullback support and could rise from this level to our take profit.
Entry: 1.93030
Why we like it:
There is a pullback support.
Stop loss: 1.92255
Why we like it:
There is an overlap support
Take profit: 1.95377
Why we like it:
There is a swing high resistance that lines up with the 61.8% Fibonacci retracement.
Enjoying your TradingView experience? Review us!
Please be advised that the information presented on TradingView is provided to Vantage (‘Vantage Global Limited’, ‘we’) by a third-party provider (‘Everest Fortune Group’). Please be reminded that you are solely responsible for the trading decisions on your account. There is a very high degree of risk involved in trading. Any information and/or content is intended entirely for research, educational and informational purposes only and does not constitute investment or consultation advice or investment strategy. The information is not tailored to the investment needs of any specific person and therefore does not involve a consideration of any of the investment objectives, financial situation or needs of any viewer that may receive it. Kindly also note that past performance is not a reliable indicator of future results. Actual results may differ materially from those anticipated in forward-looking or past performance statements. We assume no liability as to the accuracy or completeness of any of the information and/or content provided herein and the Company cannot be held responsible for any omission, mistake nor for any loss or damage including without limitation to any loss of profit which may arise from reliance on any information supplied by Everest Fortune Group.
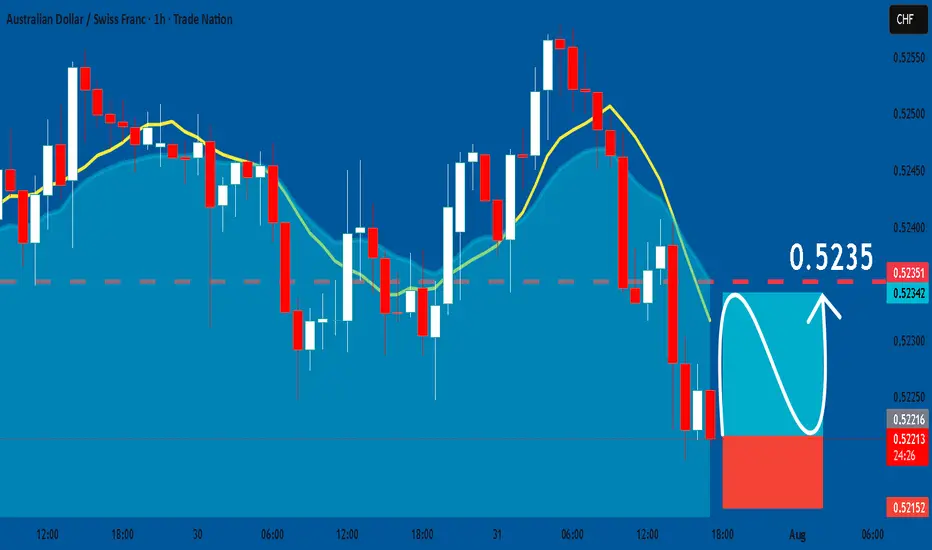
AUDCHF: Bullish Continuation & Long Signal
AUDCHF
- Classic bullish formation
- Our team expects pullback
SUGGESTED TRADE:
Swing Trade
Long AUDCHF
Entry - 0.5221
Sl - 0.5215
Tp - 0.5235
Our Risk - 1%
Start protection of your profits from lower levels
Disclosure: I am part of Trade Nation's Influencer program and receive a monthly fee for using their TradingView charts in my analysis.
❤️ Please, support our work with like & comment! ❤️
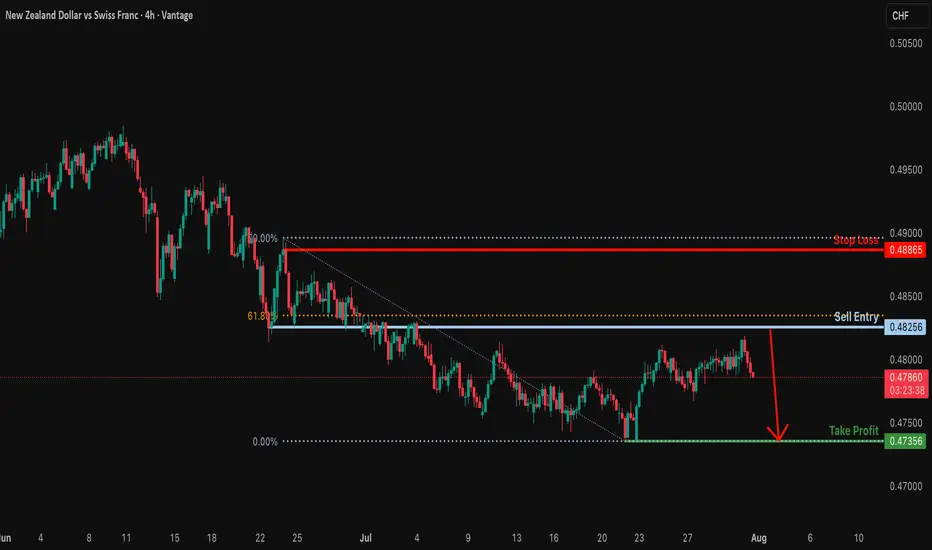
Bearish drop?The NZD/CHF is rising towards the resistance level, which is a pullback resistance that is slightly below the 61.8% Fibonacci retracement. It could drop from this level to our take-profit.
Entry: 0.48256
Why we like it:
There is a pullback resistance that is slightly below the 61.8% Fibonacci retracement.
Stop loss: 0.48865
Why we like it:
There is a pullback resistance.
Take profit: 0.47356
Why we like it:
There is a swing low support.
Enjoying your TradingView experience? Review us!
Please be advised that the information presented on TradingView is provided to Vantage (‘Vantage Global Limited’, ‘we’) by a third-party provider (‘Everest Fortune Group’). Please be reminded that you are solely responsible for the trading decisions on your account. There is a very high degree of risk involved in trading. Any information and/or content is intended entirely for research, educational and informational purposes only and does not constitute investment or consultation advice or investment strategy. The information is not tailored to the investment needs of any specific person and therefore does not involve a consideration of any of the investment objectives, financial situation or needs of any viewer that may receive it. Kindly also note that past performance is not a reliable indicator of future results. Actual results may differ materially from those anticipated in forward-looking or past performance statements. We assume no liability as to the accuracy or completeness of any of the information and/or content provided herein and the Company cannot be held responsible for any omission, mistake nor for any loss or damage including without limitation to any loss of profit which may arise from reliance on any information supplied by Everest Fortune Group.
Sell EURUSD after BRD the level of 1.15This market is started the down move by forming a very
strong bearish bars
break down the level 1.15
so I opend short with RR=1:2.6
then after a 100 points in profit I added to
this short position another one with RR=1:2

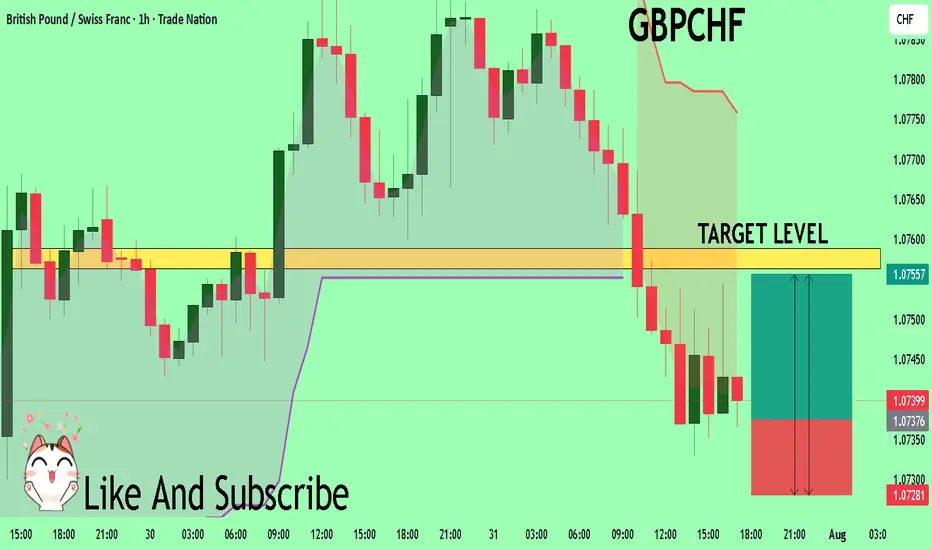
GBPCHF Trading Opportunity! BUY!
My dear followers,
This is my opinion on the GBPCHF next move:
The asset is approaching an important pivot point 1.0737
Bias - Bullish
Safe Stop Loss - 1.0728
Technical Indicators: Supper Trend generates a clear long signal while Pivot Point HL is currently determining the overall Bullish trend of the market.
Goal - 1.0756
About Used Indicators:
For more efficient signals, super-trend is used in combination with other indicators like Pivot Points.
Disclosure: I am part of Trade Nation's Influencer program and receive a monthly fee for using their TradingView charts in my analysis.
———————————
WISH YOU ALL LUCK
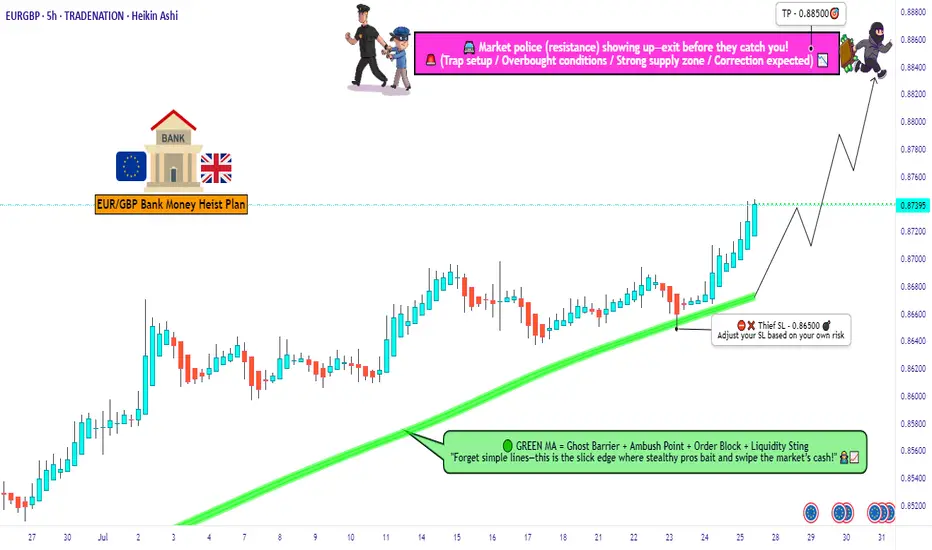
EUR/GBP Thief Trade: Swipe Profits Before Overbought Trap!🦹♂️ EUR/GBP "THE CHUNNEL HEIST" – BULLISH LOOT IN PROGRESS! 🚨💰
(Thief Trading Strategy – Escape Before the Cops Arrive!)
🎯 DEAR MARKET PIRATES & PROFIT SNATCHERS,
Based on our 🔥Thief Trading Style Analysis🔥, we’re executing a bullish heist on EUR/GBP ("The Chunnel"). The vault is wide open—time to swipe the loot before the high-risk resistance police barricade (aka overbought trap) shuts us down!
📜 THE MASTER PLAN:
✔ Entry (📈): "The Bullish Vault is Unlocked!"
Buy Limit Orders (15-30min TF) near recent swing lows/highs.
Thief’s DCA Trick: Layer entries like a pro robber—multiple limit orders for max loot.
✔ Stop Loss (🛑): "Hide Your Stash Wisely!"
SL at nearest 4H candle wick (0.86500)—adjust based on your risk appetite & lot size.
Remember: A good thief always has an escape route!
✔ Target (🎯): 0.88500 (or escape earlier if the cops get suspicious!)
🔎 SCALPERS & SWING BANDITS – LISTEN UP!
Scalpers: Stick to LONG-ONLY heists! Use trailing SL to protect profits.
Swing Thieves: If you’re low on cash, join the slow robbery—DCA & hold!
📡 WHY THIS HEIST IS HOT:
Bullish momentum in play (but BEWARE of overbought traps!).
Fundamental Drivers: Check COT Reports, Macro Data, & Sentiment.
🚨 TRADING ALERT: NEWS = POLICE RAID RISK!
Avoid new trades during high-impact news.
Trailing SL = Your Getaway Car! Lock profits before volatility strikes.
💥 BOOST THIS HEIST – STRENGTHEN THE GANG!
👉 Smash the LIKE & BOOST button to fuel our next market robbery!
👉 Follow for more heists—profit awaits! 🚀💰
🦹♂️ Stay Sharp, Stay Ruthless… See You on the Next Heist!
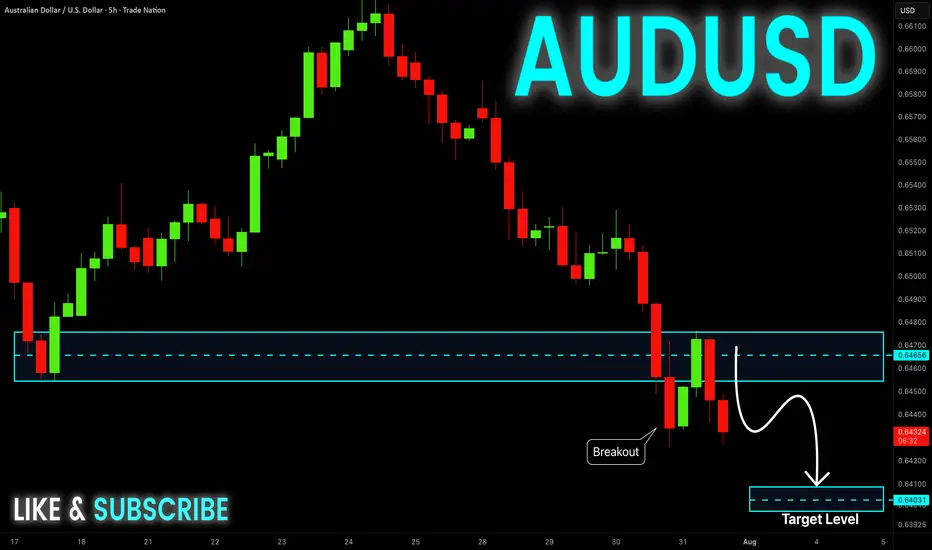
AUD-USD Will Go Down! Sell!
Hello,Traders!
AUD-USD is trading in a
Downtrend and the pair
Broke the key horizontal
Level of 0.6470 which is
Now a resistance then
Made a retest and a
Confident pullback which
Reinforces our bearish
Bias and makes us expect
A further bearish move down
Sell!
Comment and subscribe to help us grow!
Check out other forecasts below too!
Disclosure: I am part of Trade Nation's Influencer program and receive a monthly fee for using their TradingView charts in my analysis.
Determining HTF Bias For Next Candle (CRT)The image shows candlestick patterns for determining HTF bias for the next candle based on close and wick positions relative to price levels:
1. Close Above - Higher Price: White candle closing above a key level (bullish bias, suggests upward continuation).
2. Close Below - Lower Price: Black candle closing below a key level (bearish bias, suggests downward continuation).
3. Wick Above - Lower Price: Long upper wick rejected above a level (bearish bias, indicates seller control).
4. Wick Below - Higher Price: Long lower wick rejected below a level (bullish bias, indicates buyer support).

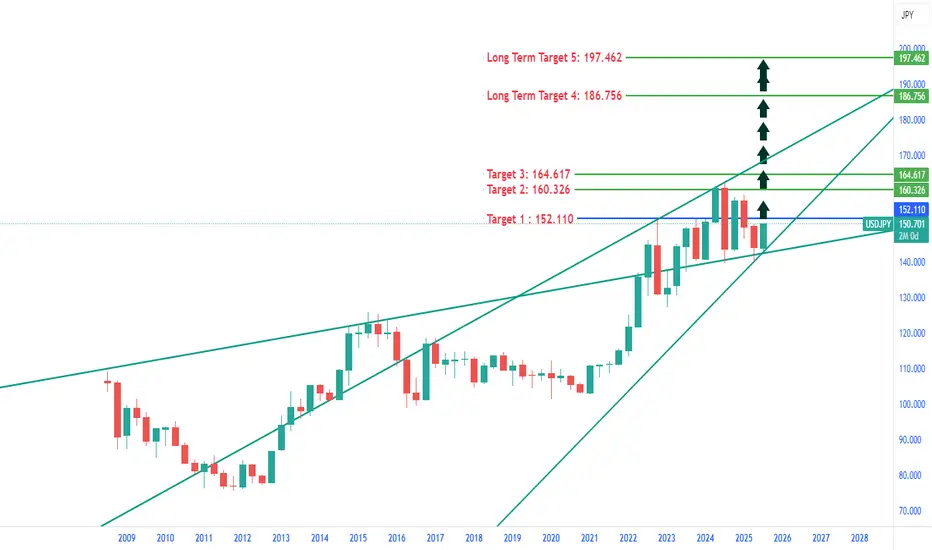
USDJPY : Where the price can reach? Long Term Scene.USDJPY Could soar to:
Target 1: 152.110
Target 2: 155 - 160.326
Target 4: 164.617
Target 5: 197.462
Trade at your own risk. Market can behave differently due to various factors.
NZDUSD in bearish trend NZDUSD in bearish trend with bullish RSI diversion and 91% long bias, entry with a Buy stop above the last Lower High RR 1:1
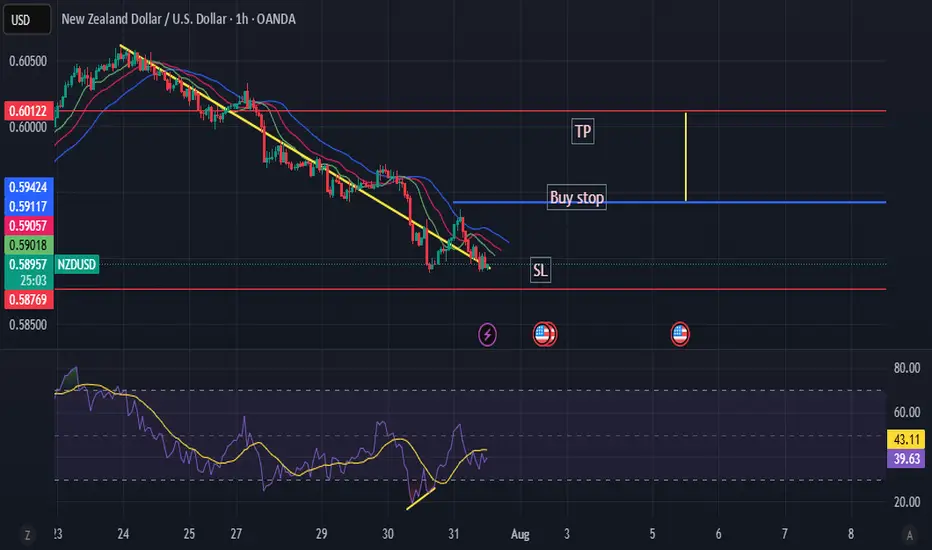
ENTRY NZDUSDDisclaimer:
This is merely a chart-based analytical trading idea and is not considered investment advice. Please manage your risks carefully and conduct your own research before making any trading decisions.
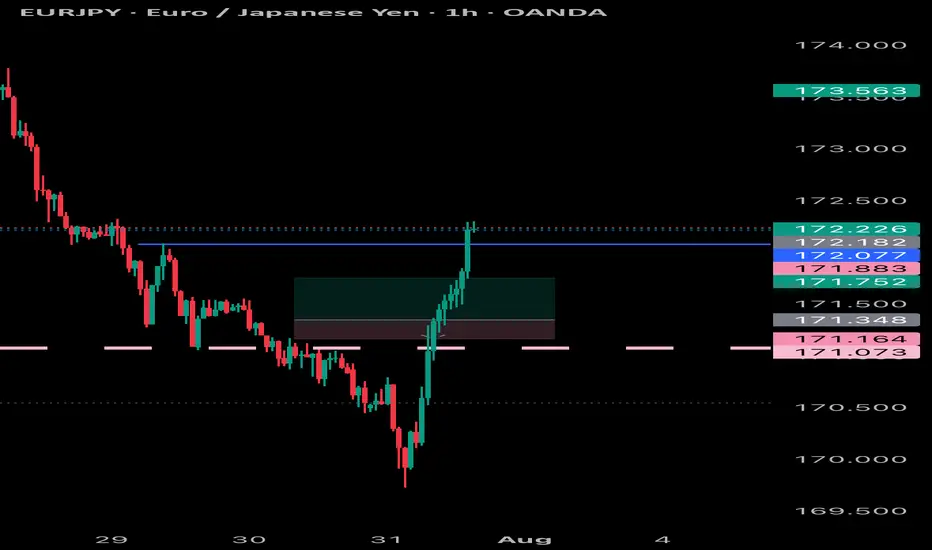
EURJPY SWEET BLUESEurjpy has hit all take profits with very little drawdown and huge profits very quickly nice pattern, simply followed
GBPUSD BEARISH POTENTIAL The daily time frame for GBPUSD is showing me that price has formed a head & shoulders pattern, breaking through the former support now resistance level. Price is currently sinking to my 1.31000 mid level, once the level is reached it will either breakthrough or bounce off of it to retrace and continue to build bearish structure.

GBPCHF - BullishGBPCHF - forming double bottom with divergence. Sentiments look bullish buyers seem to be in strong position. Seasonals are not in favor.

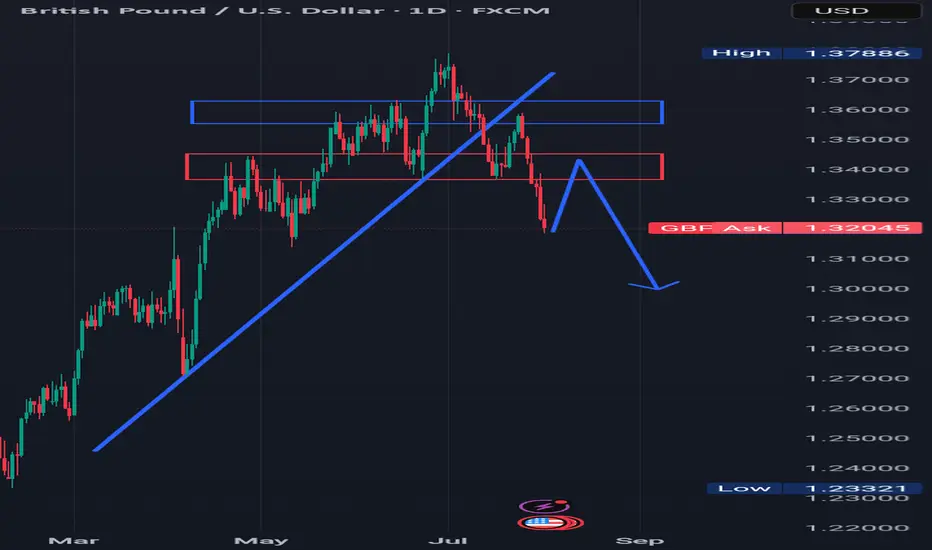
MORE DOWNSIDE AHEAD Looking at the GBPUSD pair, we can see that the trend has reversed to the downside.
The pair broke a rising trendline to the downside in the past and also formed a head and shoulder pattern.
Also in the past,price broke a resistance which is indicated with blue rectangle and a support which is indicated with a red rectangle to the downside.
I'm seeing price retracing to retest the previously broken structure or support which is indicated with a red rectangle and turning it to resistance, and thereby continuing the downtrend