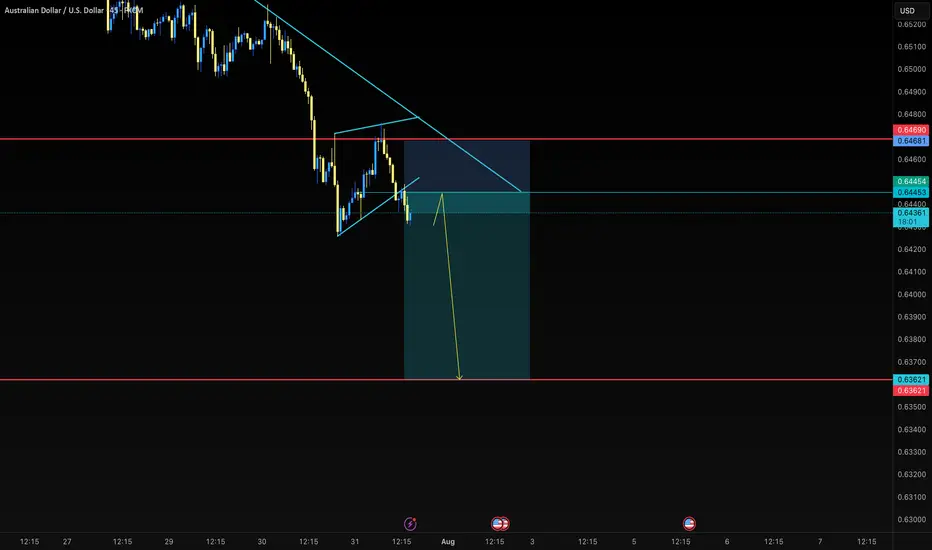
AUDUSD Outlook – From Bias to Execution Previous day closed bearish, leading to a sell bias, On the 1H, I then identified a familiar price action pattern, a rising wedge breakdown.
Forex market
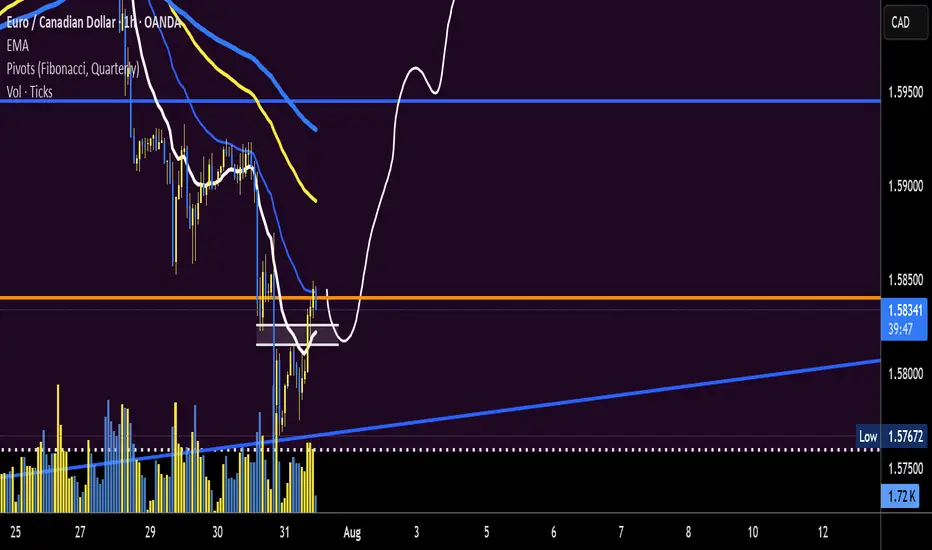
EUR/CAD a potential leg up formingEUR/CAD trend line seems to be holding. look for a entry signal up after pull back. 14 ema and 34 ema may offer resistance on 15 min chart. monitor volume decrease on pull back and spike for upward force and continuation
I am targeting CHFJPY to fibo 423.6CHFJPY is literally a all uptrend pair. Now price rejecting with good reversal formation, it almost a good one to long. Though I late on this one, going to wait for LTF retraces to go long, project to the last fibo level. Let's go!

GBPCAD corrective pullback supported at 1.8240The GBPCAD remains in a bullish trend, with recent price action showing signs of a corrective pullback within the broader uptrend.
Support Zone: 1.8240 – a key level from previous consolidation. Price is currently testing or approaching this level.
A bullish rebound from 1.8240 would confirm ongoing upside momentum, with potential targets at:
1.8510 – initial resistance
1.8600 – psychological and structural level
1.8690 – extended resistance on the longer-term chart
Bearish Scenario:
A confirmed break and daily close below 1.8240 would weaken the bullish outlook and suggest deeper downside risk toward:
1.8160 – minor support
1.8076 – stronger support and potential demand zone
Outlook:
Bullish bias remains intact while the GBPCAD holds above 1.8240. A sustained break below this level could shift momentum to the downside in the short term.
This communication is for informational purposes only and should not be viewed as any form of recommendation as to a particular course of action or as investment advice. It is not intended as an offer or solicitation for the purchase or sale of any financial instrument or as an official confirmation of any transaction. Opinions, estimates and assumptions expressed herein are made as of the date of this communication and are subject to change without notice. This communication has been prepared based upon information, including market prices, data and other information, believed to be reliable; however, Trade Nation does not warrant its completeness or accuracy. All market prices and market data contained in or attached to this communication are indicative and subject to change without notice.

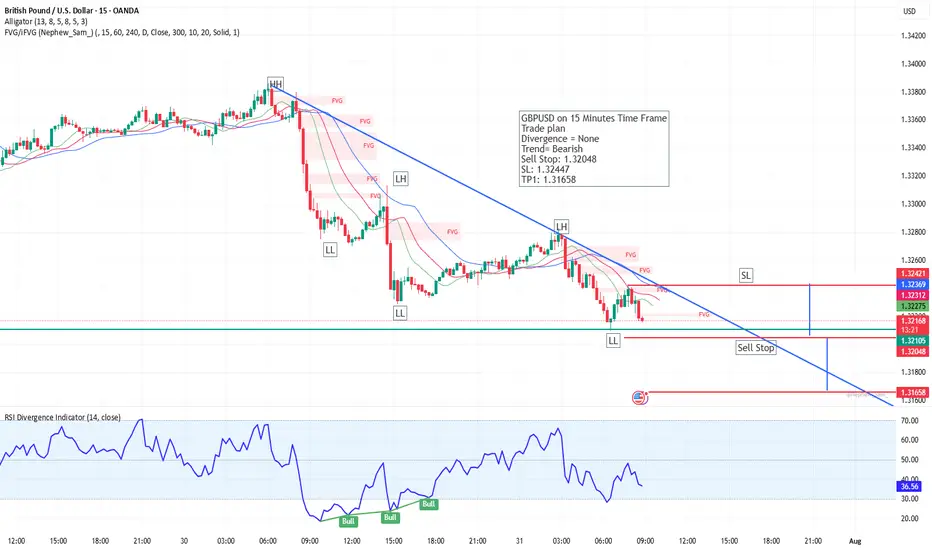
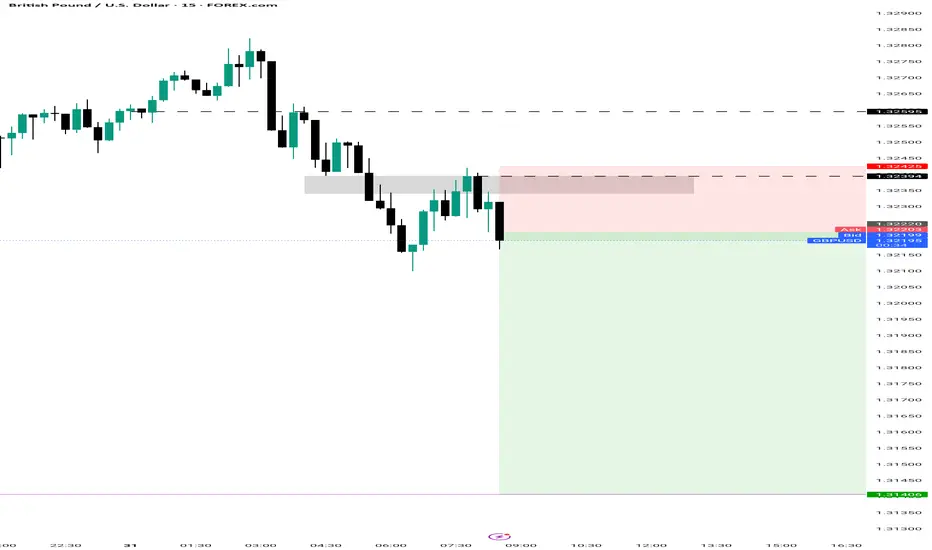
15-minute timeframe analysis of GBP/USD Trend & Structure:
Overall Trend: Bearish, confirmed by the consistent series of Lower Highs (LH) and Lower Lows (LL).
Downtrend Line: A blue diagonal trendline is drawn connecting recent LHs, acting as dynamic resistance.
Indicators & Tools Used:
Alligator Indicator: Comprising three smoothed moving averages (13, 8, 5) – the lines are wide apart and aligned downward, confirming the downtrend.
Fair Value Gaps (FVG): Marked in red zones showing potential imbalances or inefficiencies in price action where price may return. Recent FVGs are appearing near LHs, implying selling pressure.
RSI Divergence Indicator (14, close):
Current RSI value: 37.72 → indicates bearish momentum.
Previous Bullish Divergences were marked on the RSI where price made lower lows but RSI made higher lows – however, these failed to reverse the downtrend sustainably.
Trade Plan (as per annotation on chart):
Setup: Sell Stop Entry
Entry Level: 1.32048
Stop Loss (SL): 1.32447 (above recent FVG and LH)
Take Profit 1 (TP1): 1.31658 (below last LL)
Rationale: Selling continuation in bearish trend structure without divergence on RSI, supported by trendline and fair value gaps.
Key Support/Resistance Zones:
Resistance Levels:
1.32441 (Stop Loss Zone / recent LH)
1.32386 and 1.32333 (Alligator and FVG overlap)
Support Zone:
1.31658 (TP1 and potential previous demand zone)
Conclusion:
This chart illustrates a trend-following sell setup in a clear bearish structure. The trader is planning to enter short upon a breakdown below 1.32048, anticipating a move toward 1.31658. The lack of current RSI divergence supports the momentum-based bearish continuation.
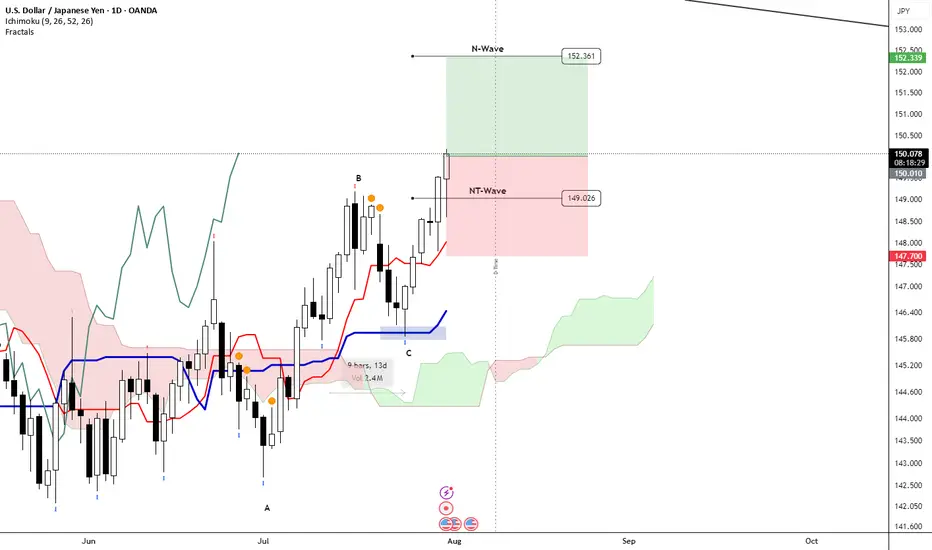
Ichimoku N-WaveI had taken this trade from just before the NT and added after NT. This looks like an N-Wave for those familiar with Wave Theory. I have calculated D as 08.08.25. Thus is a projection only based on Time and Wave Theory. Risk manage aggressively approaching NFP tomorrow.
Trade Idea: I’m bullish on EURNZD.Euro Finds a Tailwind, Kiwi Faces a Crosswind 🌬️💶🐑
The euro just got a major boost — not from within, but across the Atlantic. With the US-EU tariff deal now secured, one weight has been lifted off Europe’s shoulders. Meanwhile, New Zealand’s momentum is slowing under the weight of rate cut expectations. This divergence could be tradable.
📈 Trade Idea: I’m bullish on EURNZD.
Why I’m backing euro strength over the kiwi right now:
✅ The US-EU tariff deal is done, removing a major external risk for Europe
🧊 ECB is holding steady after eight cuts — signaling policy stability
📉 RBNZ is expected to resume rate cuts, with a 2.75% target by year-end
🔁 Business confidence in NZ is high, but consumer sentiment remains soft
💬 Speculators are net long EUR, and net short NZD
The Eurozone isn’t booming — but it’s stabilizing. Industrial production is up, inflation is cooling, and a fresh wave of investor optimism is lifting sentiment. With tariffs no longer hanging over the ECB’s head, the pressure to cut further eases. That’s a fundamental tailwind.
On the other hand, New Zealand is in limbo. Domestic confidence is improving, but the RBNZ is stuck in a global game — and that game still favors more easing. Markets are already positioning for it, with speculative bets on the kiwi flipping negative.
EURNZD is one of the cleanest expressions of central bank divergence and shifting macro sentiment right now.
Are you with the fortress or the flock? Let me know your view. 🧱🐑👇

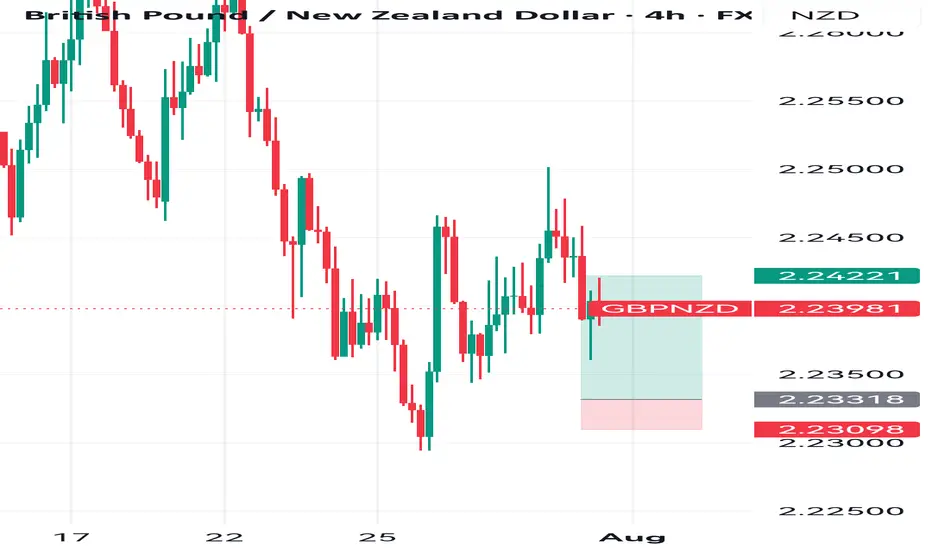
GBPNZD 4hour SetupPossible trade buy on G-N
Targeting FVG below 4hours CRT.
Stop loss below Weekly CRT.
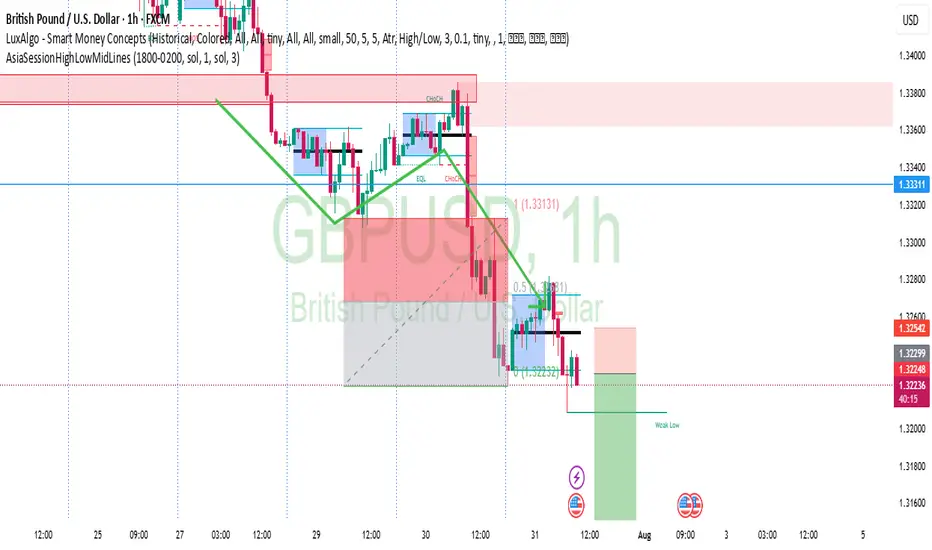
Continue Short GBPUSDhi ever1 we have new entry for today in short, we hope get 50-60 points, Best Regards
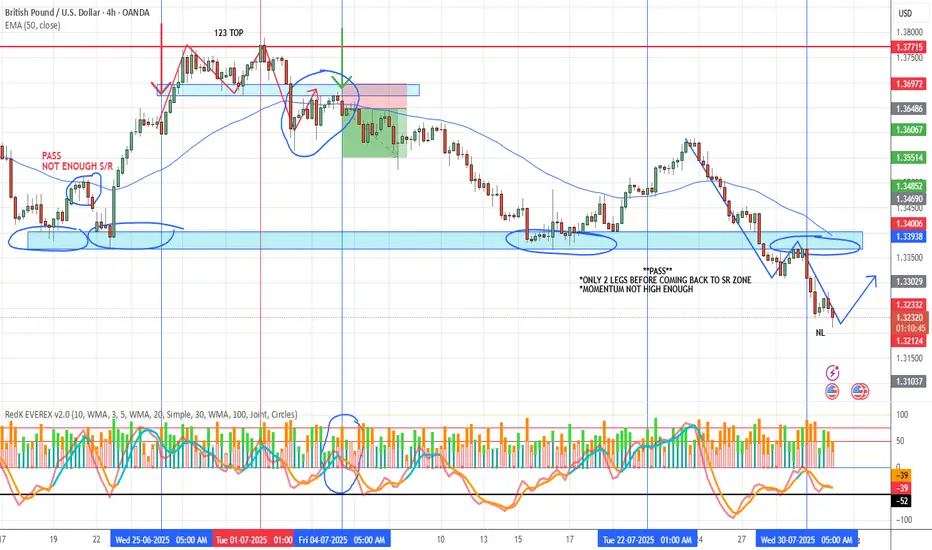
GBP/USD EVALUATION = PASSGBP/USD EVALUATION = PASS This pair has been on our watchlist and it finally made a break below support with a good pullback into a strong resistance zone, timing was great (morning session), volume was great, engulfing candle great, S/R zone great.......but, momentum was low and although it made the hook, it was not strong enough. Also, we feel the market structure was only in a 2 leg and not 3 leg.
Not every setup deserves our attention — and that’s the point.
This is exactly where most traders go wrong — they force it.
But if we’re truly following a strategy rooted in alignment, discipline means saying no just as confidently as we say yes.
Passing on trades isn’t a missed opportunity.
It’s a mark of growth.
CADJPY Short Day Trade OANDA:CADJPY Short Day Trade, with my back testing of this strategy, it hits multiple possible take profits, manage your position accordingly.
Note: Manage your risk yourself, its risky trade, see how much your can risk yourself on this trade.
Use proper risk management
Looks like good trade.
Lets monitor.
Use proper risk management.
Disclaimer: only idea, not advice

Trade-Uni GBPCHFGBPCHF (1.07497) - a sell stop at 1.07440 looks good as prices look to retest range support.

CAD/JPY reaccumulationI am looking for reaccumulation here, since we are in a higher time frame model 1 with an orderflow objective of 111.550. My model 2 POI is the extreme demand. In case there is no confirmation i am watching the liquidity+demand below for a model 1. If none of it confirms i will wait for lower levels.


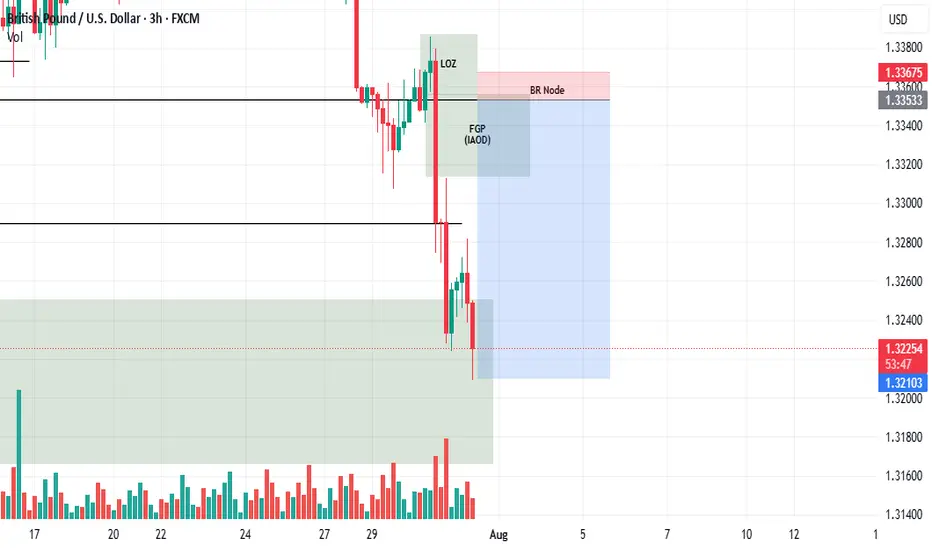
Short idea!Hey all. In my idea, market needs a very deep levels in GBPUSD, as you see Dollar is on a very strong movement and we should look at just for selling. Nodes works great most of the time. be happy(wink).
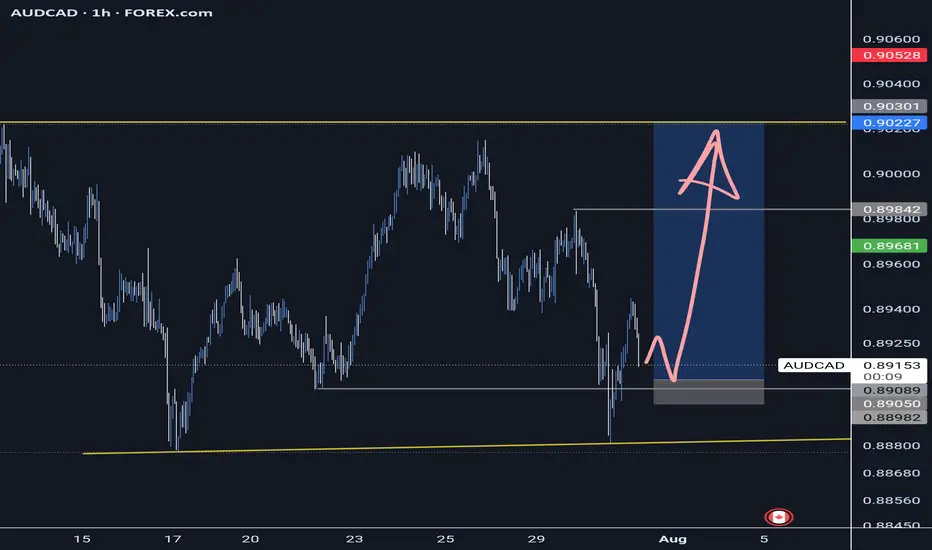
AUDCAD - Buyers ready to step in AUDCAD is in moving in LTF consolidation before next impulsive phase. Couple highs to target a good R ratio.
Good Luck
GBPCHF oversold bounce backs capped at 1.0826The GBPCHF pair is currently trading with a bearish bias, aligned with the broader downward trend. Recent price action shows a retest of the falling resistance, suggesting a temporary relief rally within the downtrend.
Key resistance is located at 1.0826, a prior consolidation zone. This level will be critical in determining the next directional move.
A bearish rejection from 1.0826 could confirm the resumption of the downtrend, targeting the next support levels at 1.0653, followed by 1.0607 and 1.0545 over a longer timeframe.
Conversely, a decisive breakout and daily close above 1.0826 would invalidate the current bearish setup, shifting sentiment to bullish and potentially triggering a move towards 1.0870, then 1.0936.
Conclusion:
The short-term outlook remains bearish unless the pair breaks and holds above 1.0826 Traders should watch for price action signals around this key level to confirm direction. A rejection favours fresh downside continuation, while a breakout signals a potential trend reversal or deeper correction.
This communication is for informational purposes only and should not be viewed as any form of recommendation as to a particular course of action or as investment advice. It is not intended as an offer or solicitation for the purchase or sale of any financial instrument or as an official confirmation of any transaction. Opinions, estimates and assumptions expressed herein are made as of the date of this communication and are subject to change without notice. This communication has been prepared based upon information, including market prices, data and other information, believed to be reliable; however, Trade Nation does not warrant its completeness or accuracy. All market prices and market data contained in or attached to this communication are indicative and subject to change without notice.

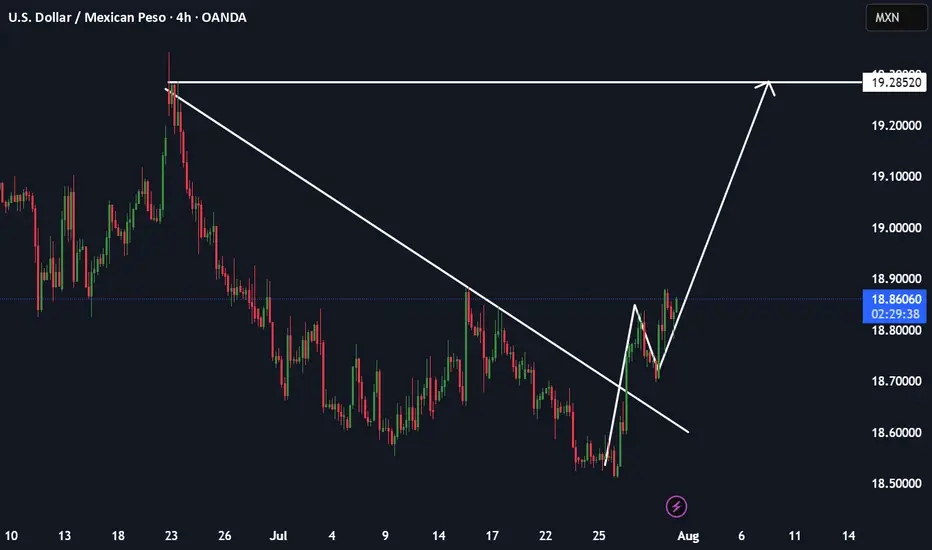
USDMXN longAs DXY looks bullish, this pair is clearly showing signs of a bullish trend. As we can see, there is a breakout and retest. I expect it to reach 19.30 (next resistance).
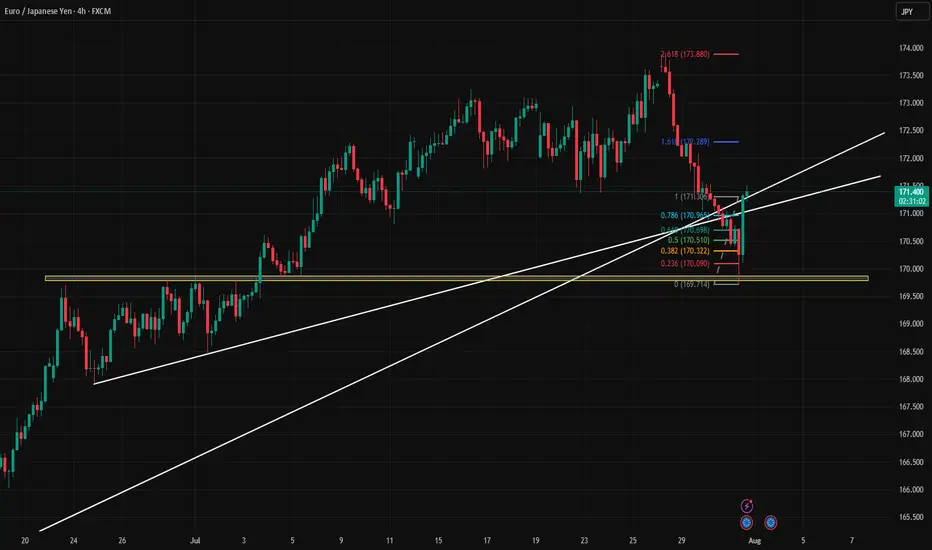
Long EJEJ showed false break the trendline with nice rejection, fulfills my criteria to go long with fibo. Anticipate with TP at fibo 261.8
GBPUSD 30.07.2025+ US data Beat (ADP Nonfarm, GDP QoQ, Core PCE)
~+ Timing: Pre-Fed Rate Decision
~+ Latest UK Retail Sales Miss
~+ BoE is in dovish tilt (MPC 6-3 vs 6-2 expected)

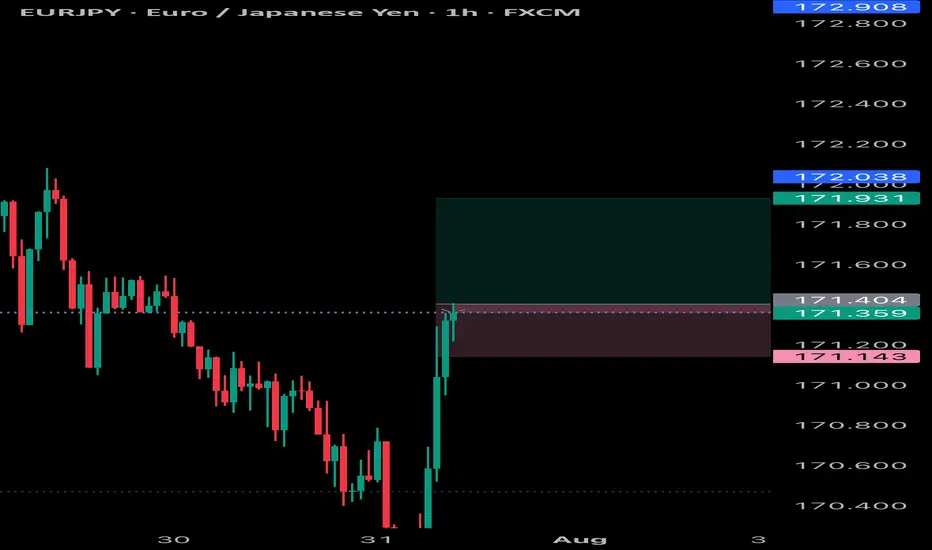
UP TREND EURJPYEurjpy will be buying and scalping will be moving my SL to BE or swing with it all the way to the top as it cannot sell forever
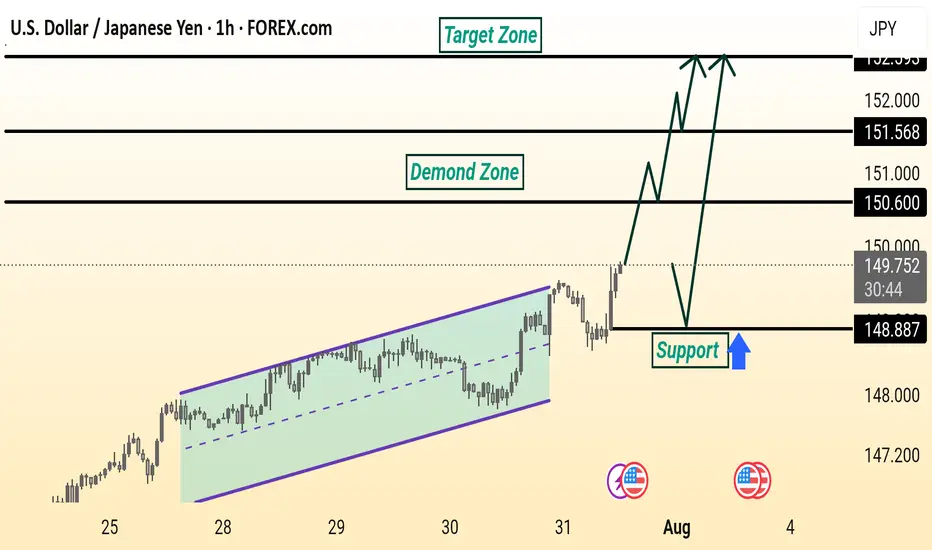
USD/JPY Analysis is Ready USD/JPY is showing a bullish setup. Price broke out of a rising channel and is expected to retest the 148.887 support level before moving higher toward the 150.600 and 151.568 resistance zones, targeting the 152.000 area. The demand zone adds strength to the potential upside.