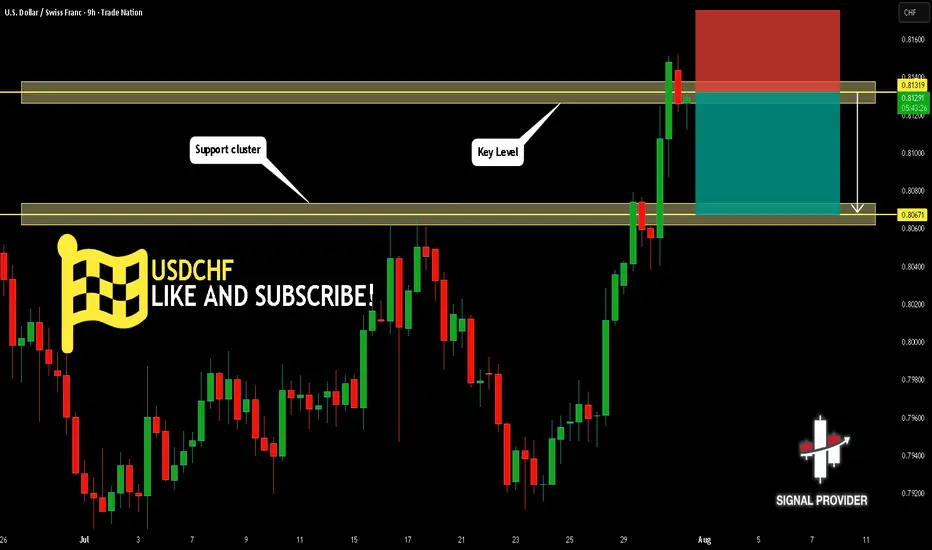
USDCHF Will Go Down From Resistance! Short!
Take a look at our analysis for USDCHF.
Time Frame: 9h
Current Trend: Bearish
Sentiment: Overbought (based on 7-period RSI)
Forecast: Bearish
The market is approaching a key horizontal level 0.813.
Considering the today's price action, probabilities will be high to see a movement to 0.806.
P.S
We determine oversold/overbought condition with RSI indicator.
When it drops below 30 - the market is considered to be oversold.
When it bounces above 70 - the market is considered to be overbought.
Disclosure: I am part of Trade Nation's Influencer program and receive a monthly fee for using their TradingView charts in my analysis.
Like and subscribe and comment my ideas if you enjoy them!
Forex market
AUDUSD Will Go Lower! Sell!
Please, check our technical outlook for AUDUSD.
Time Frame: 9h
Current Trend: Bearish
Sentiment: Overbought (based on 7-period RSI)
Forecast: Bearish
The market is approaching a significant resistance area 0.645.
Due to the fact that we see a positive bearish reaction from the underlined area, I strongly believe that sellers will manage to push the price all the way down to 0.637 level.
P.S
Overbought describes a period of time where there has been a significant and consistent upward move in price over a period of time without much pullback.
Disclosure: I am part of Trade Nation's Influencer program and receive a monthly fee for using their TradingView charts in my analysis.
Like and subscribe and comment my ideas if you enjoy them!

CADCHF 4HThis CADCHF 4H chart shows a clear market structure shift (MSS) from bearish to bullish, confirming a possible trend reversal. Price has broken structure to the upside and is now pulling back into a bullish order block zone.
What’s likely to happen:
- Price is expected to retest one of the order blocks (preferably the second/lower one) before continuing upward.
- The green zone marks the potential take profit or target area.
What to do next:
1. Wait for a bullish reaction from one of the order blocks — like a bullish engulfing candle or a strong rejection wick.
2. Once confirmed, enter a buy trade with SL below the order block and TP around the top of the green zone.
3. Manage your risk wisely — don’t rush the entry. Wait for confirmation.
This setup is clean and shows smart money interest. Let the market come to your zone. Patience = precision.

EURGBP Steps Into A Correction Within Ongoing RecoveryEURGBP is sharply down after reaching April highs for wave »v« of an impulse into wave A. As expected, the pair is now unfolding a three-wave abc corrective setback within higher-degree wave B. Currently, EURGBP is breaking below the channel support line in a sharp and impulsive projected wave »a«. A corrective recovery in wave »b« may follow, considering that RSI is already at the lower side of its range. Overall, we are still tracking this correction toward the 0.85x support area, which could act as a base before a potential bullish continuation higher into wave C.

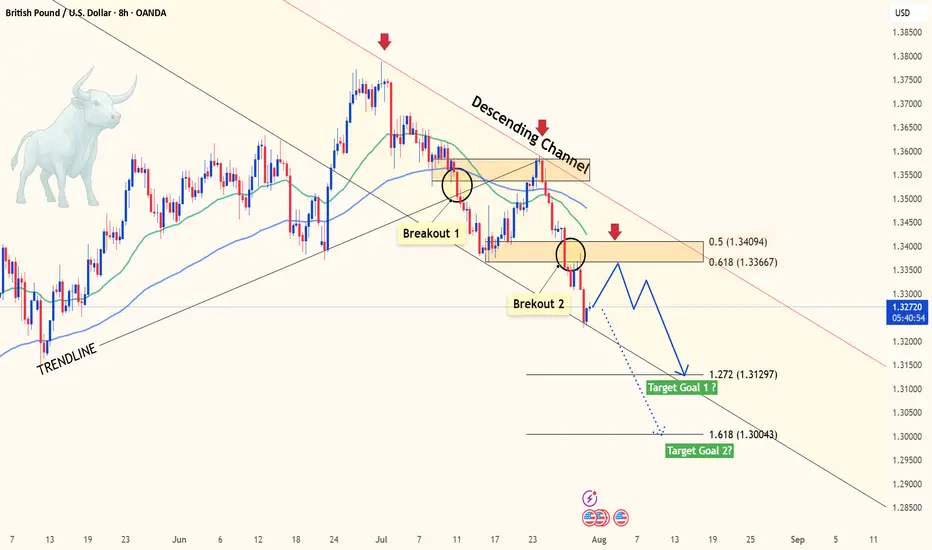
GBPUSD slipping fast – Is 1.30 the next magnet?Hey traders, what’s your take on GBPUSD today?
Overall, the pair is deepening its bearish trend after losing the key 1.3400 level. At the time of writing, GBPUSD is hovering around 1.3272 with no signs of a short-term bottom in sight.
The main catalyst for this drop is the strong bullish momentum of the U.S. dollar. A series of upbeat U.S. economic data – including jobs reports, personal consumption expenditures (PCE), and consumer confidence – all exceeded expectations, fueling USD strength. Meanwhile, the Bank of England (BoE) remains cautious amid slowing growth and cooling inflation, offering little support for the pound.
From a technical perspective, momentum has clearly shifted in favor of the bears. Price remains pressured below both the 34 and 89 EMAs, confirming strong downside momentum. The previous break below the rising trendline and failure to hold above the prior support zone – around the 0.5–0.618 Fibonacci retracement – further supports the ongoing bearish bias.
Looking ahead, if the selling pressure continues and the current support gives way, GBPUSD could fall toward the 1.272 Fibonacci extension at 1.3129. If that level fails to hold, 1.3004 (Fibo 1.618) becomes the next key downside target. These are crucial zones to monitor for potential price reactions in the coming sessions.
In short, the probability of further downside is higher than a meaningful recovery. With both technical and macro forces favoring the bears, GBPUSD may remain under pressure in the days ahead – unless a strong catalyst from the UK emerges to shift sentiment. What’s your outlook on this scenario? Let’s discuss in the comments below!
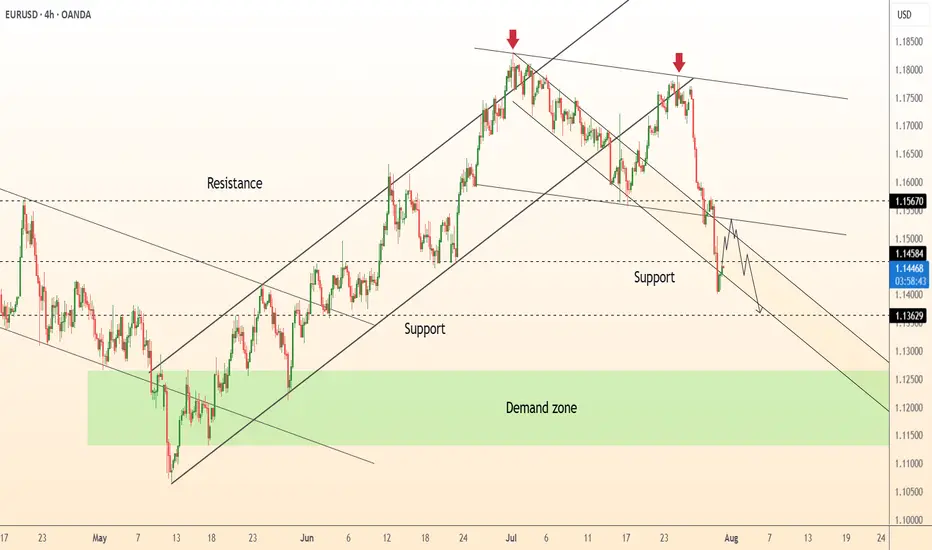
DeGRAM | EURUSD dropped below the support level📊 Technical Analysis
● EURUSD confirmed a double rejection below long-term resistance with two lower highs and broke channel support at 1.1567.
● Price is now trending within a descending channel toward 1.1363, with lower targets pointing into the 1.12–1.11 demand zone.
💡 Fundamental Analysis
● US Q2 GDP surprised to the upside, reinforcing the Fed’s hawkish tone, while Eurozone CPI inflation cooled below forecast.
● Diverging central bank trajectories continue to widen yield differentials in favor of the dollar, sustaining bearish euro flows.
✨ Summary
Short bias confirmed below 1.1567. Break of 1.1450 opens path to 1.1363 ➜ 1.1200 zone. Watch for rallies to fade below trendline.
-------------------
Share your opinion in the comments and support the idea with a like. Thanks for your support!
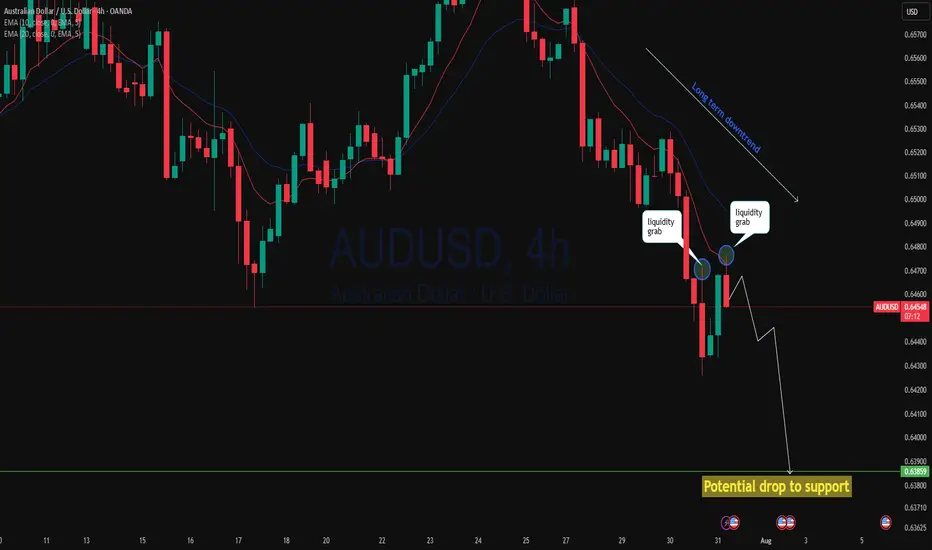
AUDUSD 2 step liquidity grab and drop?AUDUSD 4h has rejected twice from a key area after yesterday's massive breakdown with AUD negative data. Price has done a narrow pullback then this session is rejecting again with a stronger momentum could continue to drop to support. As 4h price action showing strong bearish move we may see continuation of the down trend!
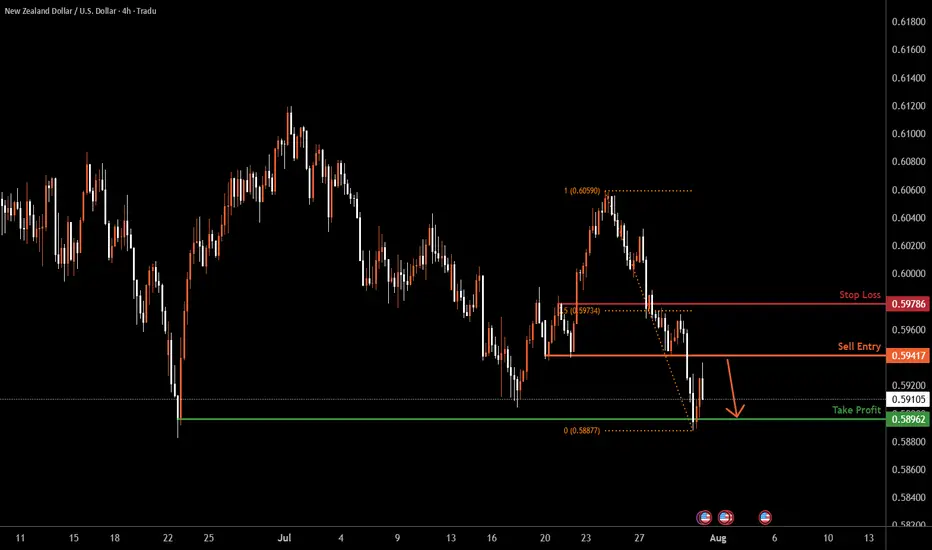
NZDUSD H4 | Bearish drop off 50% Fibonacci resistanceNZD/USD is rising towards the sell entry, which serves as a pullback resistance and could potentially reverse lower.
Sell entry is at 0.5941, which is a pullback resistance.
Stop loss is at 0.5978, which is a pullback resistance that lines up with the 50% Fibonacci retracement.
Take profit is at 0.5896, which is a swing low support.
High Risk Investment Warning
Trading Forex/CFDs on margin carries a high level of risk and may not be suitable for all investors. Leverage can work against you.
Stratos Markets Limited (tradu.com ):
CFDs are complex instruments and come with a high risk of losing money rapidly due to leverage. 65% of retail investor accounts lose money when trading CFDs with this provider. You should consider whether you understand how CFDs work and whether you can afford to take the high risk of losing your money.
Stratos Europe Ltd (tradu.com ):
CFDs are complex instruments and come with a high risk of losing money rapidly due to leverage. 66% of retail investor accounts lose money when trading CFDs with this provider. You should consider whether you understand how CFDs work and whether you can afford to take the high risk of losing your money.
Stratos Global LLC (tradu.com ):
Losses can exceed deposits.
Please be advised that the information presented on TradingView is provided to Tradu (‘Company’, ‘we’) by a third-party provider (‘TFA Global Pte Ltd’). Please be reminded that you are solely responsible for the trading decisions on your account. There is a very high degree of risk involved in trading. Any information and/or content is intended entirely for research, educational and informational purposes only and does not constitute investment or consultation advice or investment strategy. The information is not tailored to the investment needs of any specific person and therefore does not involve a consideration of any of the investment objectives, financial situation or needs of any viewer that may receive it. Kindly also note that past performance is not a reliable indicator of future results. Actual results may differ materially from those anticipated in forward-looking or past performance statements. We assume no liability as to the accuracy or completeness of any of the information and/or content provided herein and the Company cannot be held responsible for any omission, mistake nor for any loss or damage including without limitation to any loss of profit which may arise from reliance on any information supplied by TFA Global Pte Ltd.
The speaker(s) is neither an employee, agent nor representative of Tradu and is therefore acting independently. The opinions given are their own, constitute general market commentary, and do not constitute the opinion or advice of Tradu or any form of personal or investment advice. Tradu neither endorses nor guarantees offerings of third-party speakers, nor is Tradu responsible for the content, veracity or opinions of third-party speakers, presenters or participants.
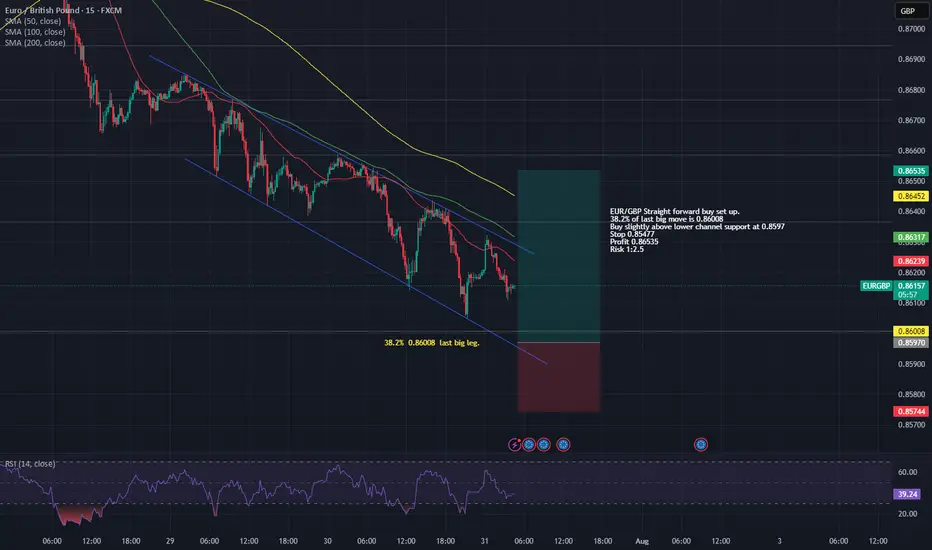
Straight forward EUR/GBP buy set up.EUR/GBP has been in a large decline against the recent trend and looks to be in some sort of leading diagonal pattern.
Major Fib 38.2% comes in at 0.86008 so buy slightly below but above lower trend line with profit risk of 1:2.5
Buy 0.8597
Stop 0.85744
Profit 0.86535 or more depending on strength.
The Day AheadThursday July 31 - Market Summary
United States:
June personal income rose by 0.2 percent.
June personal spending increased by 0.3 percent.
Core PCE inflation was up 0.2 percent, showing steady disinflation.
The Federal Reserve is likely to stay cautious; no immediate rate cuts expected.
Japan:
The Bank of Japan kept its interest rate at 0.5 percent.
Policymakers signaled possible rate hikes later this year if inflation remains strong.
The yen strengthened, and Japanese equities posted small gains.
China:
Official July PMIs remained weak, with manufacturing below the 50 threshold.
Signals continued sluggish growth momentum.
United Kingdom:
The Lloyds Business Barometer showed slightly improved sentiment in July.
Eurozone:
July inflation figures and June unemployment rate due later today.
Markets watching for signs of inflation persistence or labor market softness.
Canada:
May GDP expected today, with modest economic growth forecast.
Market Implications:
US dollar remains firm due to strong data and delayed Fed rate cut expectations.
Japanese yen is stronger on expectations of further tightening by the Bank of Japan.
US equities are supported by strong earnings and soft inflation trends.
Bond markets are stable with little movement in yields.
Commodities face downward pressure due to weak Chinese data.
Key data to watch today includes US jobless claims, Chicago PMI, Eurozone inflation, and Canadian GDP.
This communication is for informational purposes only and should not be viewed as any form of recommendation as to a particular course of action or as investment advice. It is not intended as an offer or solicitation for the purchase or sale of any financial instrument or as an official confirmation of any transaction. Opinions, estimates and assumptions expressed herein are made as of the date of this communication and are subject to change without notice. This communication has been prepared based upon information, including market prices, data and other information, believed to be reliable; however, Trade Nation does not warrant its completeness or accuracy. All market prices and market data contained in or attached to this communication are indicative and subject to change without notice.
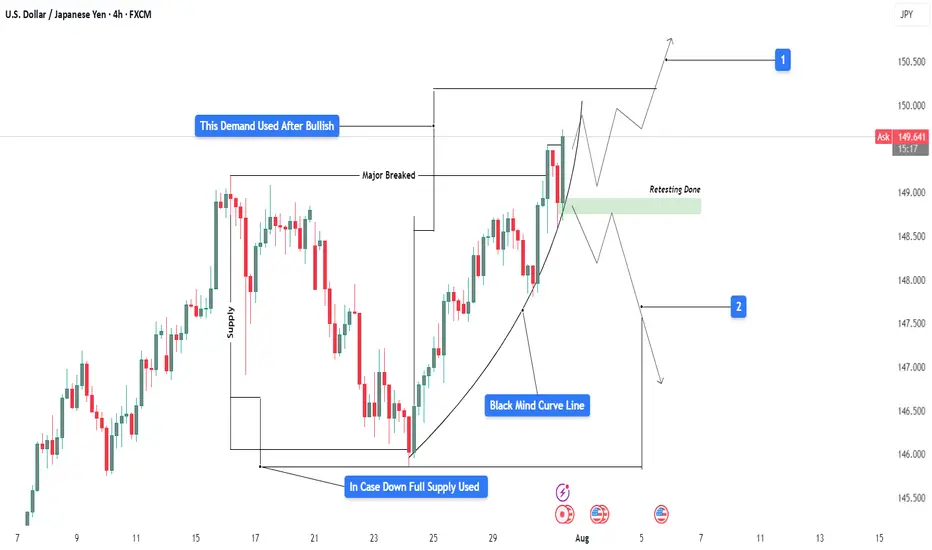
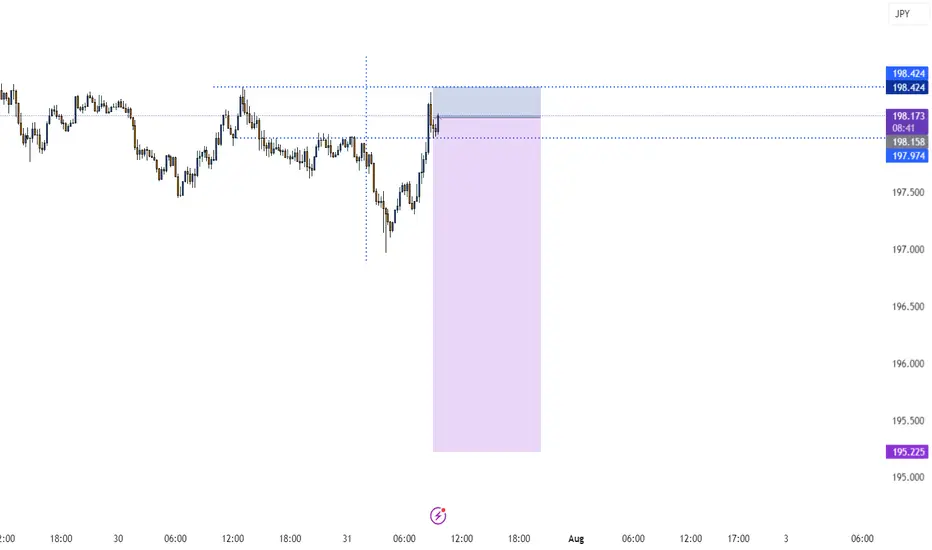
USDJPY 4H Analysis : Curve Breakout & Retest Completed + Bullish"Momentum Building Above Retested Demand – Will Bulls Take Control?"
📊 Market Structure Overview:
USDJPY has shown a clean bullish structure in recent sessions, supported by a strong demand retest and a steady parabolic curve formation (Black Mind Curve Line). The pair has successfully broken above a major resistance, retested it, and is now holding higher ground—suggesting potential for continued upside if current structure holds.
🧱 Detailed Technical Breakdown:
🔹 1. Demand & Retesting Behavior
The chart highlights a key demand zone (green box) that was previously used after a bullish move.
Price recently returned to this zone for a clean retest, validating its role as a strong support.
This type of retesting behavior is critical in smart money analysis, confirming that accumulation has occurred and sellers have been absorbed.
🔹 2. Major Breakout Confirmation
The previous major structure level has been decisively broken to the upside.
This level now acts as support, increasing the probability that the bullish move will sustain.
🔹 3. Black Mind Curve Line (Parabolic Structure)
A parabolic curved trendline supports the current price action, showing how bulls are gradually gaining momentum.
This curve represents buyer interest increasing over time, which often leads to an aggressive breakout when paired with retest confirmation.
📍 Key Price Zones:
Type Price Level (Approx.) Description
🔹 Retesting Zone ~148.800 – 149.100 Support zone after major breakout
🔺 Resistance Target (1) ~150.500 Bullish breakout target (short-term)
🔻 Downside Risk (2) ~147.000 – 146.500 Bearish invalidation zone if demand fails
🔹 Full Supply Area ~145.000 – 145.500 Historical supply zone if price fails completely
🔮 Trade Scenarios:
✅ Scenario 1 – Bullish Continuation (Primary Bias)
Retest is complete, and price is holding above the curve and demand zone.
If bullish momentum continues:
📈 Target 1: 150.50 – Near-term resistance and liquidity area
📈 Target 2: 151.20+ – Extension target if buyers dominate
Bullish Confirmation:
Price must stay above ~149.00 and continue forming higher highs.
Entry ideas: Wait for minor consolidation above current price or bullish breakout from mini range.
⚠️ Scenario 2 – Bearish Rejection
If price rejects from current level and breaks below the curve and demand zone (~148.80):
📉 First downside target: 147.00 (minor support)
📉 Final bearish target: 145.50 (full supply zone)
Bearish Confirmation:
Breakdown of curve support and close below the retesting zone with momentum.
Such a move would suggest buyers failed, and market may rotate lower.
🧠 Market Sentiment & Psychology:
Smart Money Behavior: Demand was filled cleanly and retested, indicating possible institutional interest at that level.
Momentum Curve: As shown by the black curve, momentum is rising gradually—this reflects confidence building among buyers.
However, price is near psychological resistance (150.00–150.50 zone), where heavy sell orders might be placed.
The market is in a decision zone, where confirmation of strength or failure will dictate the next 200–300 pip move.
🎯 Summary:
USDJPY is showing a bullish structure supported by:
A valid retest of demand
A clean breakout of major resistance
An ascending parabolic curve
If bulls defend the current zone, we may see a powerful continuation toward 150.50+. If price fails to hold above the retest zone, downside risks open toward 147.00 and potentially the full supply at 145.00.
📌 Trade Smart: Wait for price confirmation, manage risk with stop placement below the demand zone or structure lows, and avoid chasing the move.
Aussie H4 | Bearish reversal off pullback resistanceBased on the H4 chart analysis, we can see that the price is reacting off the sell entry, which acts as a pullback resistance that aligns with the 23.6% Fibonacci retracement and could drop lower from this level.
Sell entry is at 0.6467, which is a pullback resistance that lines up with the 23.6% Fibonacci retracement.
Stop loss is at 0.6525, which is a pullback resistance that aligns with the 50% Fibonacci retracement.
Take profit is at 0.6389, which is a swing low support that aligns with the 138.2% Fibonacci extension.
High Risk Investment Warning
Trading Forex/CFDs on margin carries a high level of risk and may not be suitable for all investors. Leverage can work against you.
Stratos Markets Limited (tradu.com ):
CFDs are complex instruments and come with a high risk of losing money rapidly due to leverage. 65% of retail investor accounts lose money when trading CFDs with this provider. You should consider whether you understand how CFDs work and whether you can afford to take the high risk of losing your money.
Stratos Europe Ltd (tradu.com ):
CFDs are complex instruments and come with a high risk of losing money rapidly due to leverage. 66% of retail investor accounts lose money when trading CFDs with this provider. You should consider whether you understand how CFDs work and whether you can afford to take the high risk of losing your money.
Stratos Global LLC (tradu.com ):
Losses can exceed deposits.
Please be advised that the information presented on TradingView is provided to Tradu (‘Company’, ‘we’) by a third-party provider (‘TFA Global Pte Ltd’). Please be reminded that you are solely responsible for the trading decisions on your account. There is a very high degree of risk involved in trading. Any information and/or content is intended entirely for research, educational and informational purposes only and does not constitute investment or consultation advice or investment strategy. The information is not tailored to the investment needs of any specific person and therefore does not involve a consideration of any of the investment objectives, financial situation or needs of any viewer that may receive it. Kindly also note that past performance is not a reliable indicator of future results. Actual results may differ materially from those anticipated in forward-looking or past performance statements. We assume no liability as to the accuracy or completeness of any of the information and/or content provided herein and the Company cannot be held responsible for any omission, mistake nor for any loss or damage including without limitation to any loss of profit which may arise from reliance on any information supplied by TFA Global Pte Ltd.
The speaker(s) is neither an employee, agent nor representative of Tradu and is therefore acting independently. The opinions given are their own, constitute general market commentary, and do not constitute the opinion or advice of Tradu or any form of personal or investment advice. Tradu neither endorses nor guarantees offerings of third-party speakers, nor is Tradu responsible for the content, veracity or opinions of third-party speakers, presenters or participants.

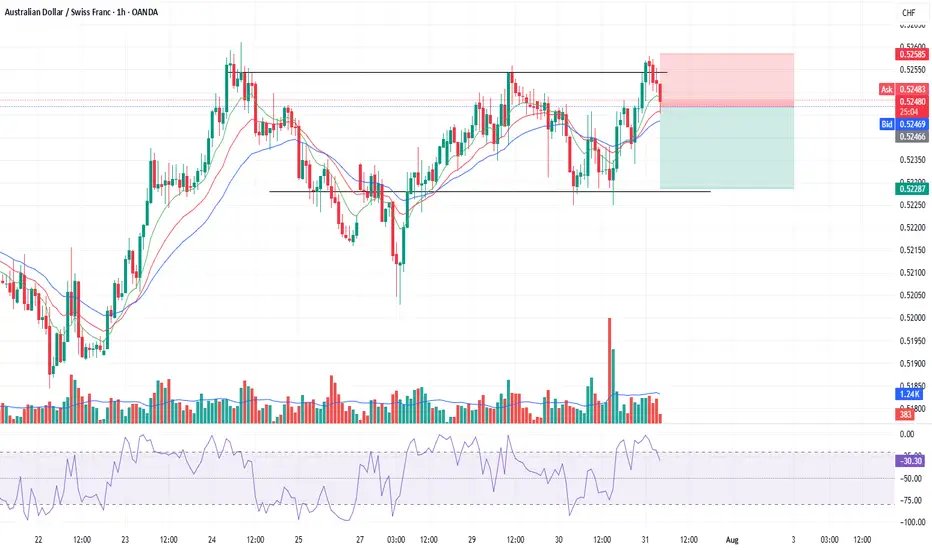
Short AUDCHFRR 1:1.5
Reason:
Selling pressure observed on Range Top.
Target Range Bottom
AUDCH Sell Trade based on William's Alligator and William's %R on Daily Time frame for bias and 1hr time frame for trade idea.
USDCHF H4 | Bearish reversalBased on the H4 chart analysis, we can see that the price has rejected off the sell entry and could drop from this level towards the take profit.
Sell entry is at 0.8153. which is a pullback resistance that lines up with the 161.8% Fibonacci extension.
Stop loss is at 0.8243, which is a swing high resistance.
Take profit is at 0.8067, which is an overlap support that lines up with the 38.2% Fibonacci retracement.
High Risk Investment Warning
Trading Forex/CFDs on margin carries a high level of risk and may not be suitable for all investors. Leverage can work against you.
Stratos Markets Limited (tradu.com ):
CFDs are complex instruments and come with a high risk of losing money rapidly due to leverage. 65% of retail investor accounts lose money when trading CFDs with this provider. You should consider whether you understand how CFDs work and whether you can afford to take the high risk of losing your money.
Stratos Europe Ltd (tradu.com ):
CFDs are complex instruments and come with a high risk of losing money rapidly due to leverage. 66% of retail investor accounts lose money when trading CFDs with this provider. You should consider whether you understand how CFDs work and whether you can afford to take the high risk of losing your money.
Stratos Global LLC (tradu.com ):
Losses can exceed deposits.
Please be advised that the information presented on TradingView is provided to Tradu (‘Company’, ‘we’) by a third-party provider (‘TFA Global Pte Ltd’). Please be reminded that you are solely responsible for the trading decisions on your account. There is a very high degree of risk involved in trading. Any information and/or content is intended entirely for research, educational and informational purposes only and does not constitute investment or consultation advice or investment strategy. The information is not tailored to the investment needs of any specific person and therefore does not involve a consideration of any of the investment objectives, financial situation or needs of any viewer that may receive it. Kindly also note that past performance is not a reliable indicator of future results. Actual results may differ materially from those anticipated in forward-looking or past performance statements. We assume no liability as to the accuracy or completeness of any of the information and/or content provided herein and the Company cannot be held responsible for any omission, mistake nor for any loss or damage including without limitation to any loss of profit which may arise from reliance on any information supplied by TFA Global Pte Ltd.
The speaker(s) is neither an employee, agent nor representative of Tradu and is therefore acting independently. The opinions given are their own, constitute general market commentary, and do not constitute the opinion or advice of Tradu or any form of personal or investment advice. Tradu neither endorses nor guarantees offerings of third-party speakers, nor is Tradu responsible for the content, veracity or opinions of third-party speakers, presenters or participants.

GBPCAD DOUBLE BOTTOMAs CAD currency interest rate didn’t surprise to the market. Hence, it is not favourable to trader and investor. From the daily chart it is remain in upward trend line. Yesterday the chart had break through the Tuesday candle which shows that it has some buyer from there.

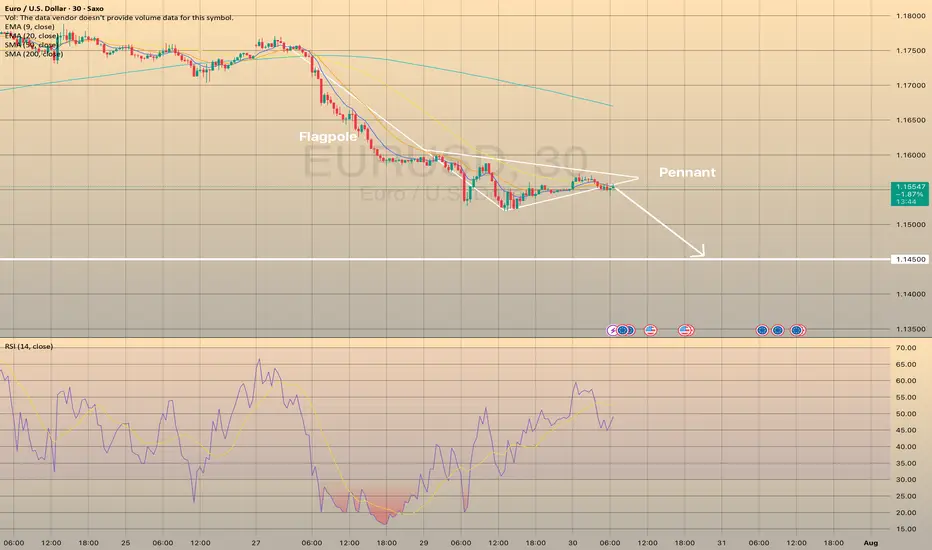
EURUSD FORMED BEARISH PENNANT. THE PRICE IS READY TO DROP.EURUSD FORMED BEARISH PENNANT. THE PRICE IS READY TO DROP.
EURUSD has been trading sideways within the last day, showing lower highs and higher lows. Eventually, the price has formed the pennant chart pattern.
What is a pennant?
A pennant chart pattern is a short-term continuation pattern in technical analysis, resembling a small symmetrical triangle, formed after a strong price movement (flagpole). It consists of converging trendlines, indicating a brief consolidation before the trend resumes. Bullish pennants form after an uptrend, bearish pennants after a downtrend.
The price is expected to decline towards 1.14500 support level
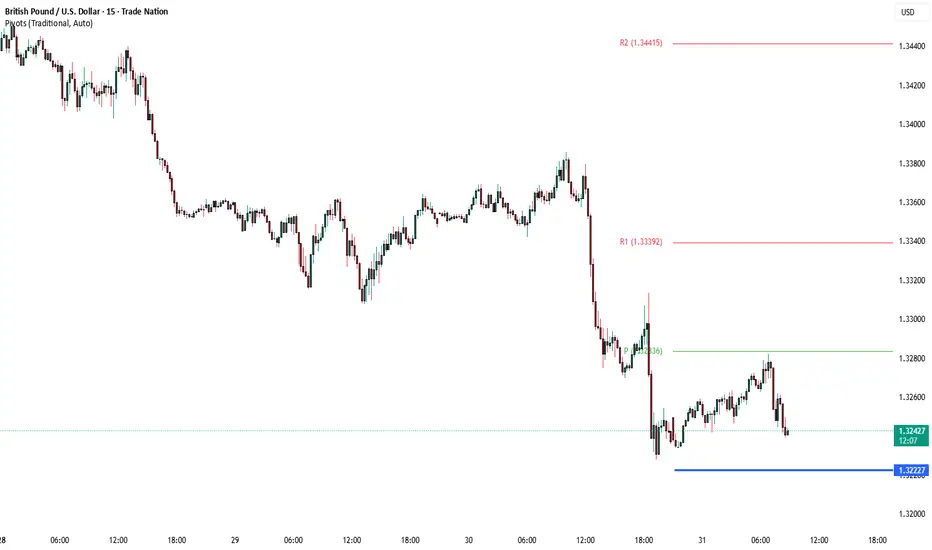
GBPUSD H4 | Bearish continuationThe Cable (GBP/USD) is rising towards the sell entry, which is a pullback resistance that aligns with the 23.6% Fibonacci retracement and could drop lower from this level.
Sell entry is at 1.3317, which is a pullback resistance that lines up with the 23.6% Fibonacci retracement.
Stop loss at 1.3392, which is a pullback resistance that is slightly below the 50% Fibonacci retracement.
Take profit is at 1.3172, which is a swing low support that aligns with the 100% Fibonacci projection.
High Risk Investment Warning
Trading Forex/CFDs on margin carries a high level of risk and may not be suitable for all investors. Leverage can work against you.
Stratos Markets Limited (tradu.com ):
CFDs are complex instruments and come with a high risk of losing money rapidly due to leverage. 65% of retail investor accounts lose money when trading CFDs with this provider. You should consider whether you understand how CFDs work and whether you can afford to take the high risk of losing your money.
Stratos Europe Ltd (tradu.com ):
CFDs are complex instruments and come with a high risk of losing money rapidly due to leverage. 66% of retail investor accounts lose money when trading CFDs with this provider. You should consider whether you understand how CFDs work and whether you can afford to take the high risk of losing your money.
Stratos Global LLC (tradu.com ):
Losses can exceed deposits.
Please be advised that the information presented on TradingView is provided to Tradu (‘Company’, ‘we’) by a third-party provider (‘TFA Global Pte Ltd’). Please be reminded that you are solely responsible for the trading decisions on your account. There is a very high degree of risk involved in trading. Any information and/or content is intended entirely for research, educational and informational purposes only and does not constitute investment or consultation advice or investment strategy. The information is not tailored to the investment needs of any specific person and therefore does not involve a consideration of any of the investment objectives, financial situation or needs of any viewer that may receive it. Kindly also note that past performance is not a reliable indicator of future results. Actual results may differ materially from those anticipated in forward-looking or past performance statements. We assume no liability as to the accuracy or completeness of any of the information and/or content provided herein and the Company cannot be held responsible for any omission, mistake nor for any loss or damage including without limitation to any loss of profit which may arise from reliance on any information supplied by TFA Global Pte Ltd.
The speaker(s) is neither an employee, agent nor representative of Tradu and is therefore acting independently. The opinions given are their own, constitute general market commentary, and do not constitute the opinion or advice of Tradu or any form of personal or investment advice. Tradu neither endorses nor guarantees offerings of third-party speakers, nor is Tradu responsible for the content, veracity or opinions of third-party speakers, presenters or participants.

The Fed aftermath. US dollar bulls enjoy the moment.The US dollar bulls went in hard after during and after the Fed's press conference. Can the momentum stay? Let's dig in.
MARKETSCOM:DOLLARINDEX
TVC:DXY
Let us know what you think in the comments below.
Thank you.
75.2% of retail investor accounts lose money when trading CFDs with this provider. You should consider whether you understand how CFDs work and whether you can afford to take the high risk of losing your money. Past performance is not necessarily indicative of future results. The value of investments may fall as well as rise and the investor may not get back the amount initially invested. This content is not intended for nor applicable to residents of the UK. Cryptocurrency CFDs and spread bets are restricted in the UK for all retail clients.

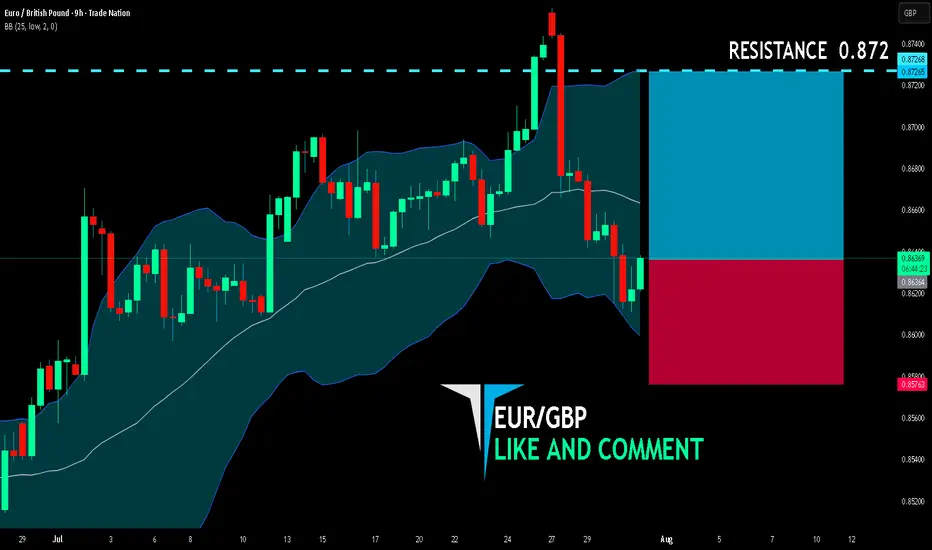
EUR/GBP BULLS ARE STRONG HERE|LONG
EUR/GBP SIGNAL
Trade Direction: long
Entry Level: 0.863
Target Level: 0.872
Stop Loss: 0.857
RISK PROFILE
Risk level: medium
Suggested risk: 1%
Timeframe: 9h
Disclosure: I am part of Trade Nation's Influencer program and receive a monthly fee for using their TradingView charts in my analysis.
✅LIKE AND COMMENT MY IDEAS✅
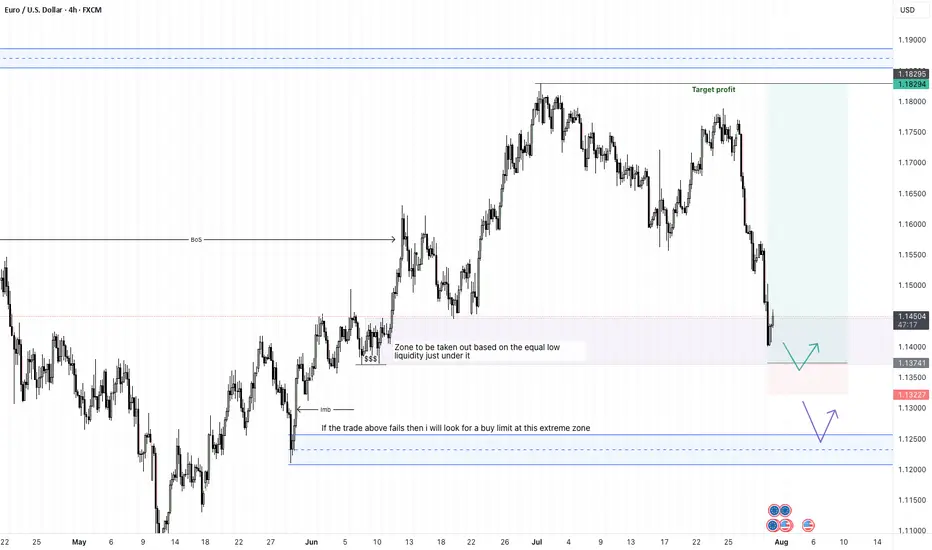
EURUSD - 31/7/25Price has reached a zone that broke the structure - see BoS on the left. Now that price is here in the zone, im not comfortable entering a buy order yet. The full bearish candle into the zone, leaves me with an indication that price may go lower.
+ve:
1. Big bearish candle in to the BoS zone - price may drop lower
2. There is equal low liquidity on the left which sits just below the zone which is expected to be taken out
4. HTF direction is still bullish
-ve:
1. below the equal low liquidity is an efficient zone before some imbalance
2. that imbalance may draw price to it and stop me out
Second trade idea:
Assuming that the first trade does not hold, then my focus will be the extreme zone where i will place a buy limit.
TP: 8.86R
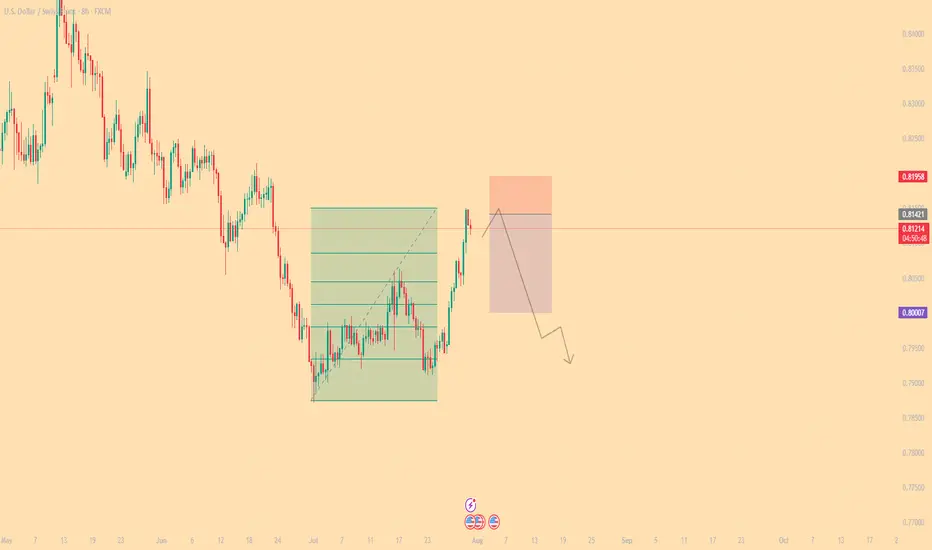
#015: USD/CHF SHORT Investment OpportunityHello readers, I'm Forex Trader Andrea Russo, and today I'd like to share this SHORT investment opportunity I've identified in the USD/CHF pair.
In recent days, USD/CHF has exhibited typical technical exhaustion behavior near key dynamic resistance. The area between 0.81300 and 0.81650 represented a significant supply zone, previously tested with an extended spike and immediately rejected.
The price violated the 200 EMA with an apparent breakout, but without real institutional volume to support the move. This was followed by a rapid retracement below the mean and a sideways movement, suggesting ongoing manipulation and liquidity building.
Meanwhile, global retail sentiment shows a significant anomaly: over 70% of retail traders are long. This imbalance increases the likelihood that market makers are preparing a bearish reversal to target the most fragile positions and restore equilibrium.
The 0.81420 level has been identified as a key point for a possible price reversion to the manipulative zone before the actual directional move. If the price reverts to this level, a technical spike is likely to be executed to complete the hunt for stops before the downtrend begins.
The trade targets a decline towards the 0.80000 area, which represents the first significant level of technical support and a realistic target if the reversal is confirmed.
31.07.25 Morning ForecastPairs on Watch -
FX:GBPAUD
FX:AUDCAD
FX:AUDCHF
A short overview of the instruments I am looking at for today, multi-timeframe analysis down to what I will be looking at for an entry. Enjoy!
