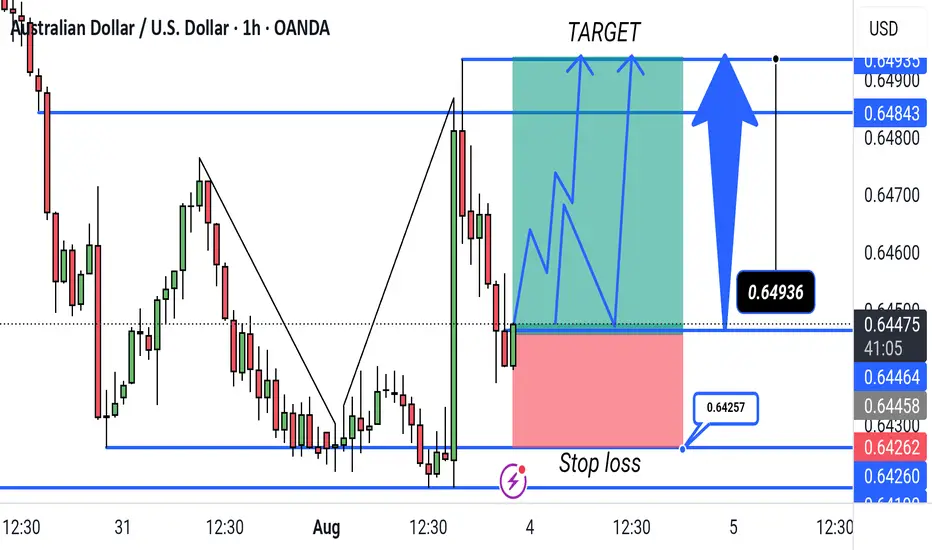
"AUD/USD Bullish Breakout Setup – 1H Timeframe. This chart shows a bullish trade setup for AUD/USD on the 1-hour timeframe. The entry is near 0.64464, with a target at 0.64843 and a stop loss at 0.64257. The trade aims to capitalize on a potential upward breakout following a support bounce.
Forex market
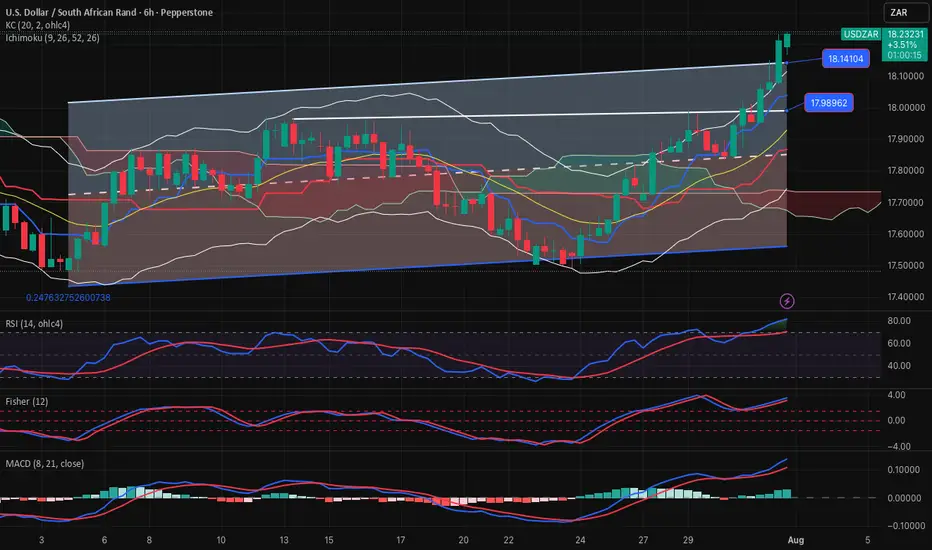
USDZAR-SELL strategy 6 hourly chart Reg. ChannelSame as the USDX of course, the pair is overbought. i felt yesterday we may see higher, but was not convinced to belong, however, we can add to our SELL, or have SELL position up here. The Reg. Channel is violated amidst this overbought status provides a good warning of potential corrective action.
Strategy SELL @ 18.2000-18.2500 and take profit near 18.0350 for now.
AUDCAD / GBPAUD Trade Recaps 01.08.25A tester trade on AUDCAD with the reasons explained as to why this was a test position, and a short position executed on GBPAUD. Solid setup that this time around just didn't commit.
Full explanation as to why I executed on these positions and the management plan with both.
Any questions you have just drop them below 👇

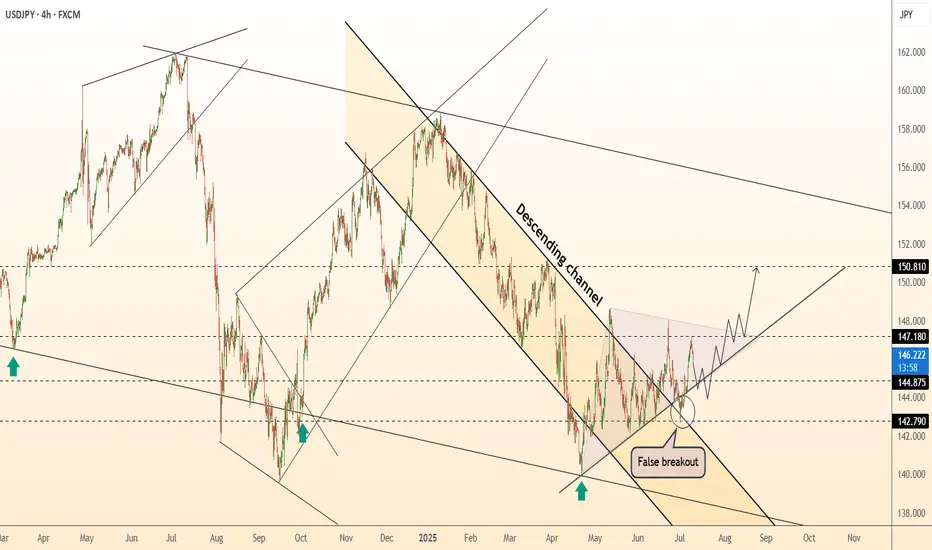
DeGRAM | USDJPY fixed above the descending channel📊 Technical Analysis
● Dollar-yen has punched through the 16-month descending channel top and twice retested it as support (false-break tags), carving a rising trend line that now guides price away from 144.90.
● Inside the break zone a smaller pennant is forming; a 4 h close above 147.18 completes the pattern and activates the channel-height target at 150.80 near the November swing cap.
💡 Fundamental Analysis
● US 2-yr yields pushed to a three-month high after hotter CPI core-services and Barkin’s “inflation progress has stalled”, while the BoJ July minutes flagged only “gradual” QT—widening the policy gap and reviving carry demand for yen shorts.
✨ Summary
Long 145.2-146.2; pennant break >147.18 targets 150.80. Bias void on a 4 h close below 142.80.
-------------------
Share your opinion in the comments and support the idea with like. Thanks for your support!
Simple Psychology Tips Using Volume for Better TradingMany newer traders assume that when someone says "psychology" in trading, they are referring to mindset.
It is also widely believed that trading is about the BEST entries.
Now, think of it this way. It is not about winning trades, it is actually about managing losses well to allow you to take the winners over and over again. You might think that a 3 to 1 risk-to-reward strategy is boring, you might have gone all in on your favourite crypto project. But what makes the difference between gambling and trading is actually very, very simple. So simple, in fact, many overlook it or simply ignore it.
Most seek a silver bullet - high win rates and perfectly timed entries, then they overleverage and move stops on the one "good trade" they are seeking to make.
Whilst doing this, they tend to overload the 6 monitors they have purchased to trade with a thousand indicators, which they don't really need.
The candlesticks tell a story, volume supports that story. When you learn any technique from Elliott Waves to Wyckoff, they all have a dependence on volume - even if the correlation is not apparent.
Look at this first image.
Price had moved down since the vertical line, the AD line also moved down - sell-off, in full swing. But then volume starts to shift before the AD line starts to increase.
Now, look at what happens next...
As we move forward and the new vertical line shows where volume spiked, the AD line starts to decrease as the price continues to rise.
This is enough of a story to start your analysis.
We then get a move with a lower high formed.
As this plays out, the sell-side volume rises, creating momentum for the short position.
Look a little closer and you will see, that the volume on the move up just before the drop was also decreasing. Making a divergence to price.
You might feel that the market is against you, or that the big players are single-handedly seeking your stops. But the truth is, the psychology in moves such as this one shown is where most retail traders either have greed that markets will only go up for ever or the fear that they are missing out on a market that only goes up forever.
It is that herd mentality that generates the liquidity for the professionals.
Losing 1% on a trade, is part of the process, risking 80%> on a single move will make you paper rich for about 10 minutes before the real losses set in.
This is where the psychology and the basic techniques such as risk management and understanding what candlesticks and volume bars are telling you, will make a world of difference to your results.
A/D line and volume are free on @TradingView and to be fair you don't need to overcomplicate it more than that!
Stay safe, have a great weekend all!!!
Disclaimer
This idea does not constitute as financial advice. It is for educational purposes only, our principal trader has over 25 years' experience in stocks, ETF's, and Forex. Hence each trade setup might have different hold times, entry or exit conditions, and will vary from the post/idea shared here. You can use the information from this post to make your own trading plan for the instrument discussed. Trading carries a risk; a high percentage of retail traders lose money. Please keep this in mind when entering any trade. Stay safe.
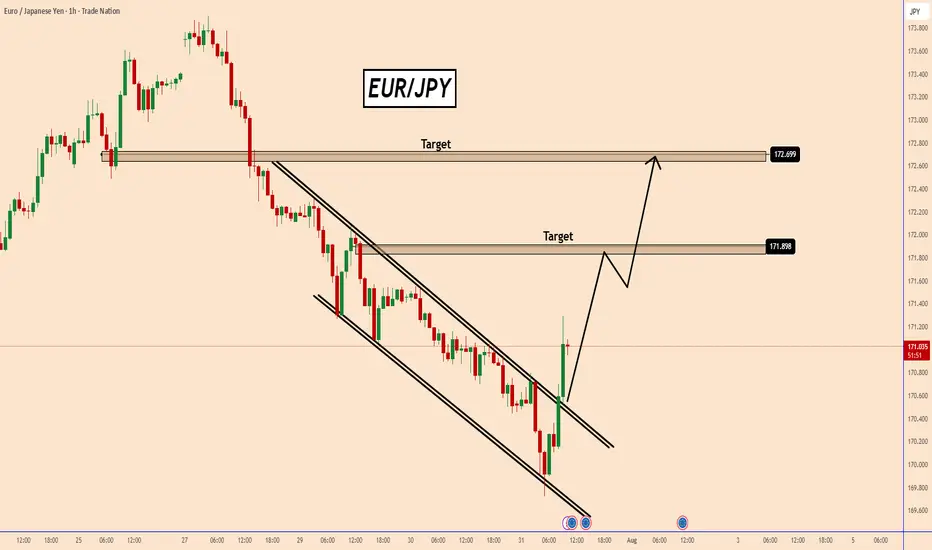
EURJPY Poised to test the top after the BOJ Rate DecisionEURJPY Poised to test the top after the BOJ Rate Decision
EURJPY broke out of a descending type of channel pattern or something similar.
The last two candles confirmed the bullish movement in a clear way and the odds are that EURJPY may rise further during the coming hours.
However this movement is also supported by BOJ Interst Rate decision.
BOJ kept rates unchanged at 0.5% as expected and they didn't change anything at all in their comments.
News - reported by forexlive
The Japanese Yen weakened across the board throughout BoJ Governor Ueda press conference. He sounded like someone who's not in a rush to hike rates at all. The two key lines were "monetary tightening effectively works on demand-driven inflation, but current inflation is largely supply-driven" and "current FX rate not diverging far from our assumptions".
He's basically saying that the current inflation is likely to be a one-off event and we all know how much weight they place on sustained inflation to durably hit their 2% target. And the comment about FX suggests that the depreciation in the JPY does not concern them at all, which gives the market the green light for further depreciation (all else being equal).
You may find more details in the chart!
Thank you and Good Luck!
PS: Please support with a like or comment if you find this analysis useful for your trading day
Disclosure: I am part of Trade Nation's Influencer program and receive a monthly fee for using their TradingView charts in my analysis.
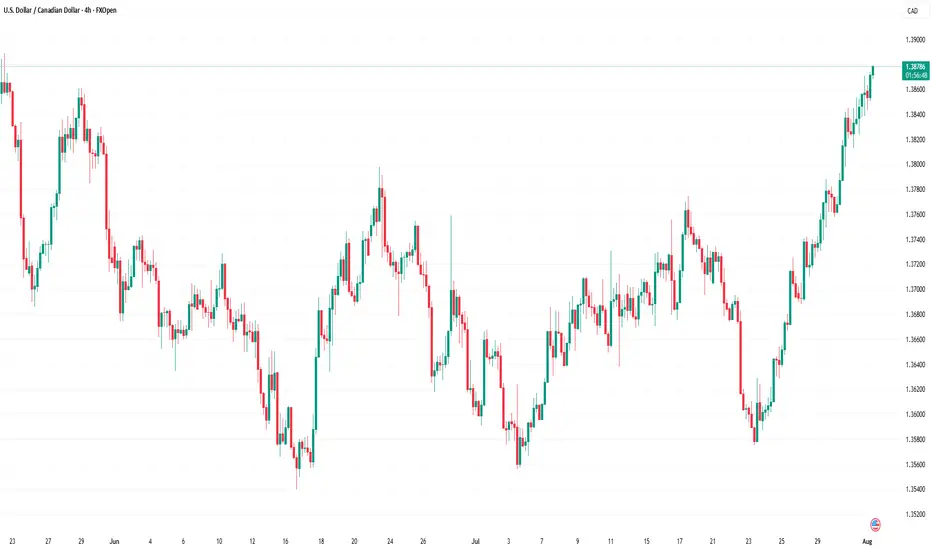
USD/CAD Rises to 2-Month HighUSD/CAD Rises to 2-Month High
Today, the USD/CAD exchange rate briefly exceeded the 1.3870 mark – the highest level seen this summer. In less than ten days, the US dollar has strengthened by over 2% against the Canadian dollar.
Why Is USD/CAD Rising?
Given that both the Federal Reserve and the Bank of Canada left interest rates unchanged on Wednesday (as expected), the primary driver behind the pair’s recent rally appears to be US President Donald Trump's decision to impose tariffs on several countries – including Canada:
→ Despite efforts by Prime Minister of Canada Mark Carney to reach an agreement with Trump, no deal was achieved;
→ Canadian goods exported to the US will now be subject to a 35% tariff;
→ The tariffs take effect from 1 August;
→ Goods compliant with the United States-Mexico-Canada Agreement (USMCA) are exempt.
Media analysts note that the tariffs are likely to increase pressure on the Canadian economy, as approximately 75% of the country's exports are destined for the United States.
USD/CAD Technical Analysis
At the end of July, the price formed a steep ascending channel (A-B), with bullish momentum confirmed by a decisive breakout above the 1.3790 resistance level, as illustrated by the arrow:
→ the pullback before the breakout was relatively shallow;
→ the bullish breakout was marked by a long bullish candlestick with a close near the session high;
→ following the breakout, the price confidently consolidated above 1.3790.
Provided that the fundamental backdrop does not undergo a major shift, bulls might attempt to maintain control in the market. However, the likelihood of a correction is also increasing, as the RSI indicator has entered extreme overbought territory.
Should USD/CAD show signs of a correction after its steep ascent, support might be found at:
→ line C, drawn parallel to the A-B channel at a distance of its width;
→ the previously mentioned 1.3790 level, which now acts as a support following the breakout.
This article represents the opinion of the Companies operating under the FXOpen brand only. It is not to be construed as an offer, solicitation, or recommendation with respect to products and services provided by the Companies operating under the FXOpen brand, nor is it to be considered financial advice.
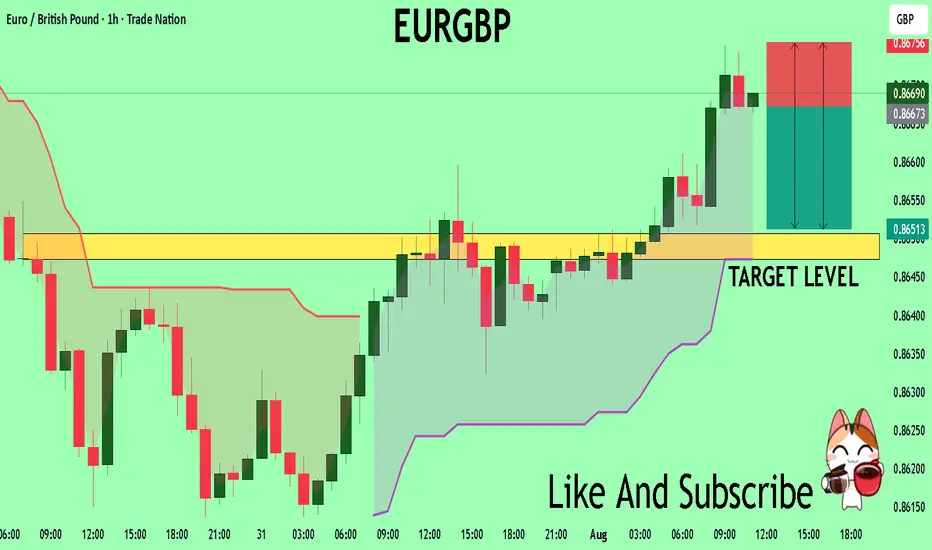
EURGBP Will Collapse! SELL!
My dear subscribers,
EURGBP looks like it will make a good move, and here are the details:
The market is trading on 0.8667 pivot level.
Bias - Bearish
My Stop Loss - 0.8675
Technical Indicators: Both Super Trend & Pivot HL indicate a highly probable Bearish continuation.
Target - 0.8650
About Used Indicators:
The average true range (ATR) plays an important role in 'Supertrend' as the indicator uses ATR to calculate its value. The ATR indicator signals the degree of price volatility.
Disclosure: I am part of Trade Nation's Influencer program and receive a monthly fee for using their TradingView charts in my analysis.
———————————
WISH YOU ALL LUCK
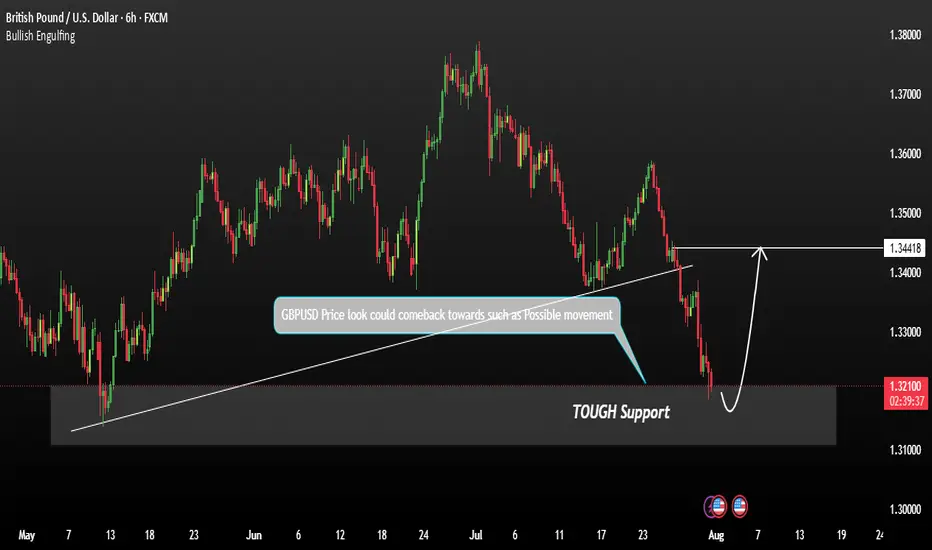
GBPUSD shows signs of a potential recoveryGBPUSD shows signs of a potential recovery towards the resistance zone. This price action indicates a possible short-term reversal or consolidation phase. We are currently observing for confirmation signals such as:
These could signal a build-up for a move back toward the key resistance at 1.34400. Traders should stay alert for price behaviour near this level as it may act as a turning point or breakout trigger.
You may find more details in the chart.
Trade wisely best of luck buddies.
Ps: Support with like and comments like for better analysis.
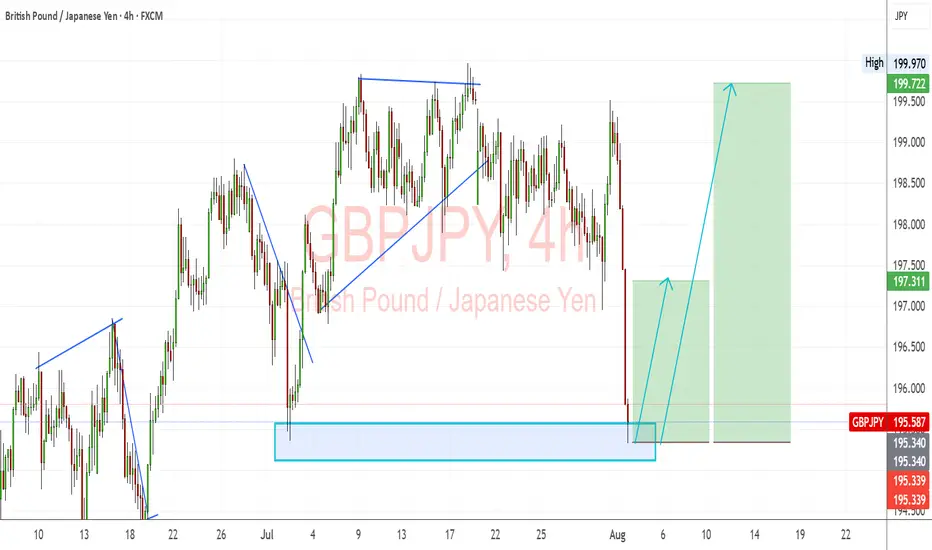
GBPJPY: Strong Bullish Reversal from Demand ZoneGBPJPY has bounced sharply from a key demand zone, indicating renewed bullish momentum. The pair continues to follow the broader bullish bias in GBP crosses, with JPY weakness driven by the Bank of Japan's dovish policy stance.
Technical Analysis (4H Chart)
Pattern: Bullish rejection from the 195.30–195.50 demand zone.
Current Level: 195.58, rebounding from strong support, setting up for a potential upward leg.
Key Support Levels:
195.34 – immediate demand zone and critical support.
194.90 – deeper backup support if a pullback occurs.
Resistance Levels:
197.31 – near-term resistance and first upside target.
199.72 – extended target if bullish continuation strengthens.
Projection: As long as 195.34 holds, GBP/JPY could push toward 197.31, with potential for 199.72 if GBP strength persists.
Fundamental Analysis
Bias: Bullish.
Key Fundamentals:
GBP: Supported by the BOE’s cautious but tight stance due to persistent inflation pressures.
JPY: Remains fundamentally weak, with the BoJ avoiding major policy tightening while intervention threats only provide short-term support.
Risk Sentiment: Mild risk-on conditions favor GBP over safe-haven JPY.
Risks:
BoJ FX intervention could temporarily strengthen JPY.
A dovish BOE shift could slow GBP momentum.
Key Events:
BOE policy updates and UK CPI.
BoJ commentary and risk sentiment indicators.
Leader/Lagger Dynamics
GBP/JPY is a leader among JPY pairs due to GBP’s volatility and strength. It often outpaces EUR/JPY and CHF/JPY, making it a key pair for JPY sentiment shifts.
Summary: Bias and Watchpoints
GBP/JPY is bullish, with price rebounding from the 195.34 demand zone. Upside targets are 197.31 and 199.72. Watch for BOE communication, BoJ intervention signals, and global risk sentiment for confirmation of the move.
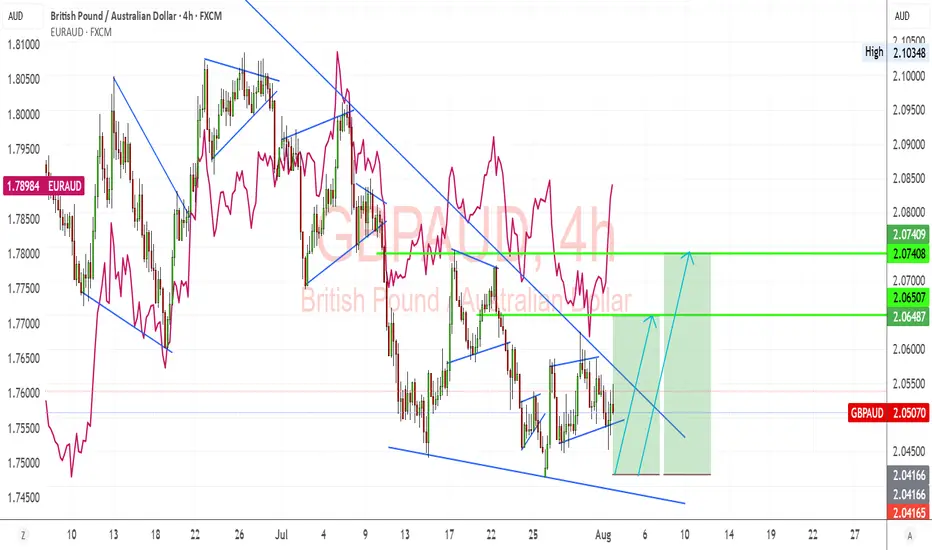
GBPAUD Potential Bullish Reversal Setup – Key Breakout Levels GBPAUD is showing signs of a potential bullish reversal after a prolonged downtrend, with price consolidating within a descending wedge pattern. The pair is testing a breakout point, and fundamentals favor a bullish recovery supported by GBP strength relative to AUD weakness.
Technical Analysis (4H Chart)
Pattern: Descending wedge formation, often a bullish reversal structure.
Current Level: 2.0507, holding within the wedge and preparing for a potential breakout.
Key Support Levels:
2.0416 – immediate support and invalidation zone if broken.
2.0350 – extended support if bearish pressure resumes.
Resistance Levels:
2.0650 – near-term breakout level.
2.0740 – secondary bullish target if breakout confirms.
Projection: If the wedge breaks upward, price could rally toward 2.0650 initially, then 2.0740 for further confirmation of bullish momentum.
Fundamental Analysis
Bias: Bullish if breakout confirms.
Key Fundamentals:
GBP: BOE remains cautious but leans toward maintaining tight policy amid sticky inflation.
AUD: RBA is constrained by weaker growth and trade risks linked to global tariffs, limiting AUD upside.
Global Sentiment: Risk-off sentiment weighs on AUD, favoring GBP relative strength.
Risks:
Hawkish RBA surprise or strong China data could strengthen AUD.
BOE dovish signals may cap GBP upside.
Key Events:
BOE policy updates and UK inflation data.
RBA meeting and Chinese economic releases.
Leader/Lagger Dynamics
GBP/AUD is a lagger, often following EUR/AUD and GBP/USD movements, but it could gain momentum if GBP strength broadens against risk-sensitive currencies.
Summary: Bias and Watchpoints
GBP/AUD is setting up for a bullish reversal, with key breakout confirmation above 2.0650. A move toward 2.0740 would reinforce this scenario. The main watchpoints are BOE policy tone, RBA updates, and China’s economic signals.
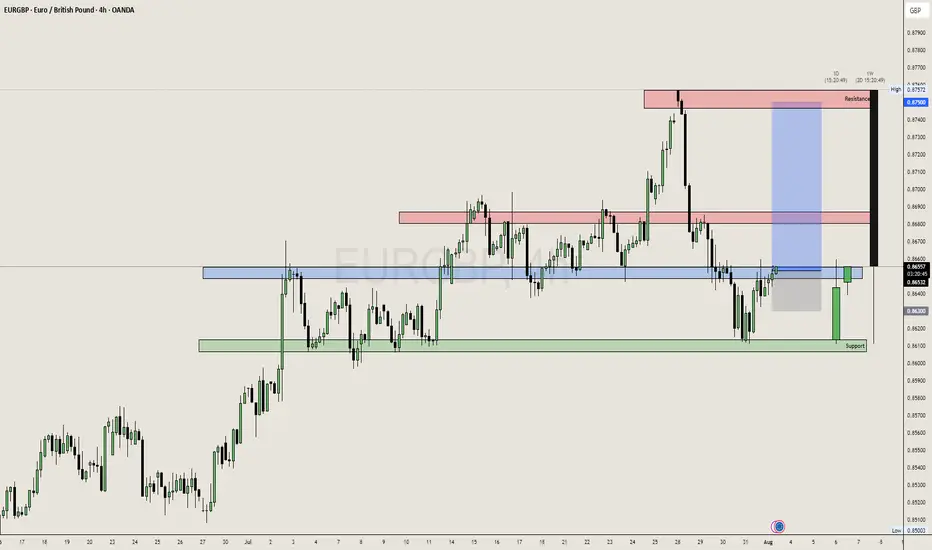
EURGBP, Bullish Breakout!!!EURGBP after getting rejected from the support we can expect again a upside movement.
I am expecting a movement from 0.86500 to 0.8700 at least, we can plan sl below 0.86300.
Safe Player wait for proper breakout and wait for retest of 0.8650 area.
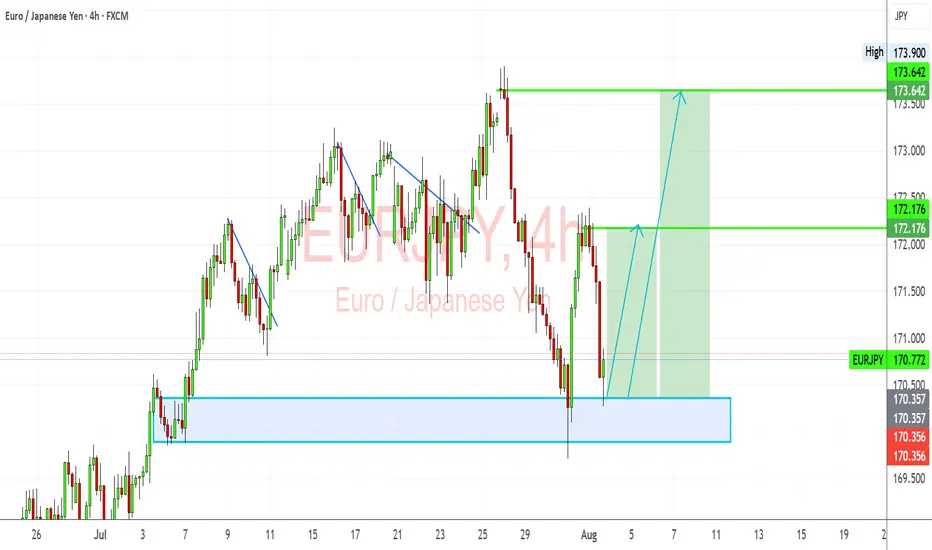
EURJPY: Bullish Rebound from Key Demand ZoneEURJPY has bounced off a critical demand zone and is showing signs of a bullish recovery. Despite the recent pullback, the pair’s structure remains fundamentally and technically bullish, driven by JPY weakness and EUR resilience.
Technical Analysis (4H Chart)
Pattern: Price tested a strong demand zone near 170.35–170.50 and rejected it aggressively.
Current Level: 170.77, starting a potential bullish leg toward higher resistance levels.
Key Support Levels:
170.35 – key demand zone and invalidation level for bulls.
169.90 – deeper support if demand zone breaks.
Resistance Levels:
172.17 – first bullish target and interim resistance.
173.64 – major target if bullish continuation sustains.
Projection: A successful rebound from 170.35 could drive price toward 172.17 initially, then 173.64 if momentum holds.
Fundamental Analysis
Bias: Bullish.
Key Fundamentals:
EUR: ECB’s slower path toward easing supports EUR stability relative to JPY.
JPY: Weakness persists as BoJ maintains dovish bias, though FX intervention risk limits JPY downside speed.
Global Sentiment: Mild risk-on mood supports EUR strength against JPY.
Risks:
BoJ verbal intervention or actual FX intervention could trigger temporary JPY strength.
Sharp reversal in global risk sentiment could weaken EUR/JPY.
Key Events:
ECB speeches and data (CPI, growth updates).
BoJ FX comments and broader market risk appetite.
Leader/Lagger Dynamics
EUR/JPY is a leader among JPY pairs, often moving in sync with GBP/JPY and CHF/JPY. Its movement also tends to precede confirmation in risk-sensitive JPY crosses.
Summary: Bias and Watchpoints
EUR/JPY is bullish from the 170.35 demand zone, with a potential move toward 172.17 and 173.64. Key watchpoints include ECB communication, BoJ stance, and market risk sentiment. As long as 170.35 holds, bulls remain in control.
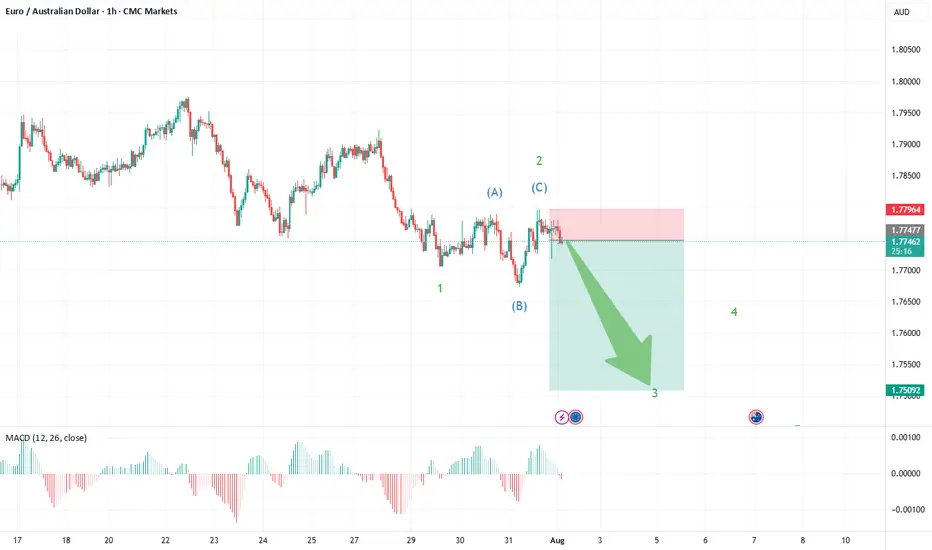
EUR/AUD: Short Setup Forming—Is the Downside Just Beginning?EUR/AUD is flashing the early signs of a new short trading opportunity, with the latest chart pointing toward a fresh move lower as the corrective phase may be wrapping up.
What the Current Structure Shows (Primary Scenario)
Corrective Pattern Complete: The strong advance off the May 14th, 2025 lows at 1.7247 unfolded as a classic double zigzag (WXY), culminating at recent highs. Price action has since reversed and formed an initial impulse down—clear evidence that the correction may be over.
Wave 1 Down, Expanded Flat for Wave 2: The chart now displays a completed wave 1 on the downside, followed by an expanded flat for wave 2—where price retraced upward but failed to break the previous peak, a sign of fading bullish momentum.
The recent structure shows a sharp, impulsive move down (wave 1), fitting Elliott Wave expectations for a new trend immediately after a complex correction.
The expanded flat for wave 2—where the B wave exceeded the start of A and C pushed higher—typically heralds a strong, extended wave 3. This supports a bearish outlook from current levels.
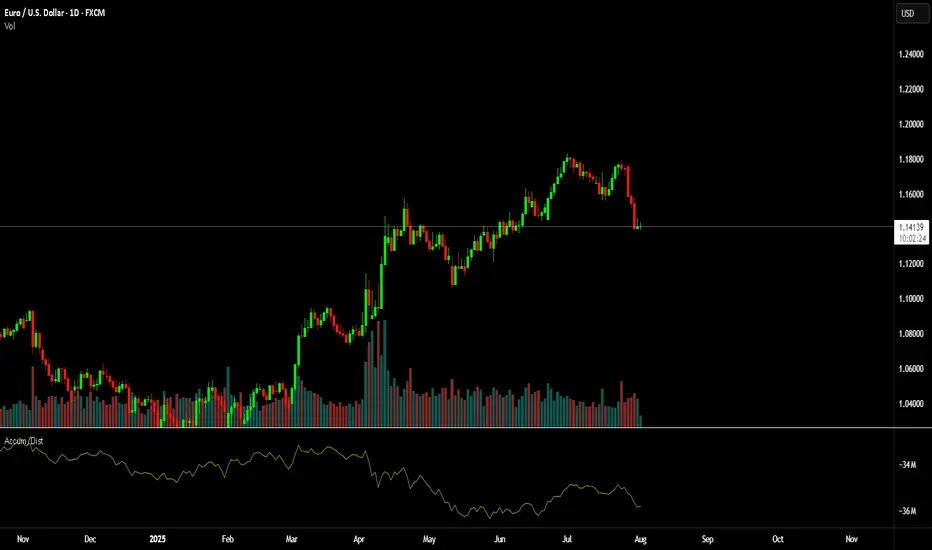
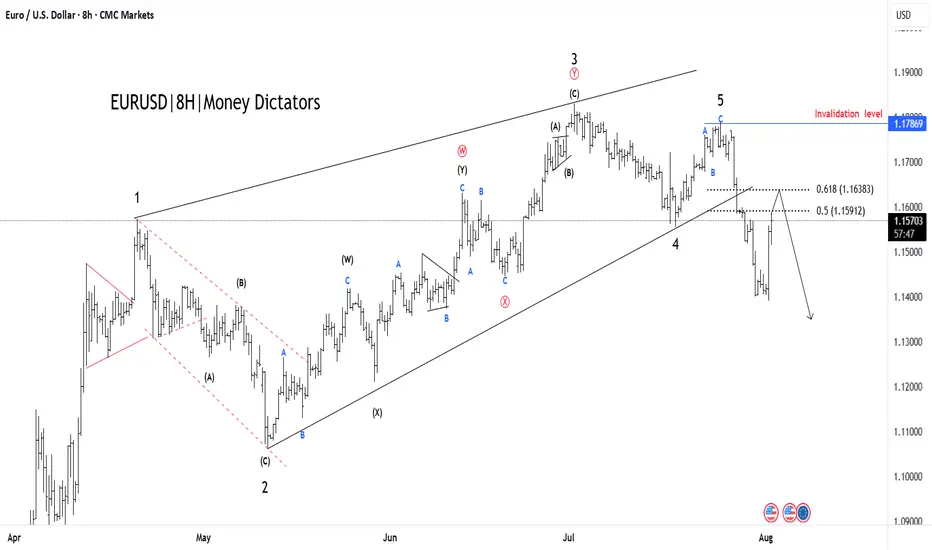
EUR/USD Elliott Wave Count Signals Downside TargetsThe EUR/USD chart is displaying a completed 5-wave Elliott impulse structure, suggesting the potential start of a larger corrective move to the downside. Wave 5 appears to have finished after a classic ending diagonal pattern, with price now breaking below the wave 4 support trendline — a strong confirmation of trend exhaustion.
Currently, price is retracing upward towards the 0.5–0.618 Fibonacci retracement zone of the last impulsive leg, around 1.15912–1.16383, which may serve as the final rejection zone for bears to re-enter. This area aligns perfectly with prior support-turned-resistance and is considered the potential reversal pocket.
If price holds below the 1.17869 invalidation level, the structure supports the beginning of an ABC correction or a larger bearish impulse.
Target 1 (T1): 1.14800
Target 2 (T2): 1.13915
Stop Loss (SL): 1.17869
This scenario remains valid as long as the price does not break above 1.17869. A clean break and close above this level would invalidate the bearish setup and suggest a possible wave extension.
USDJPY 30Min Engaged (Buy & Sell Reversal Entry's Detected )Time Frame: 30-Minute Warfare
Entry Protocol: Only after volume-verified breakout
🩸Bullish Reversal - 148.750
🩸Bearish Reversal - 150.100
➗ Hanzo Protocol: Volume-Tiered Entry Authority
➕ Zone Activated: Dynamic market pressure detected.
The level isn’t just price — it’s a memory of where they moved size.
Volume is rising beneath the surface — not noise, but preparation.
🔥 Tactical Note:
We wait for the energy signature — when volume betrays intention.
The trap gets set. The weak follow. We execute.

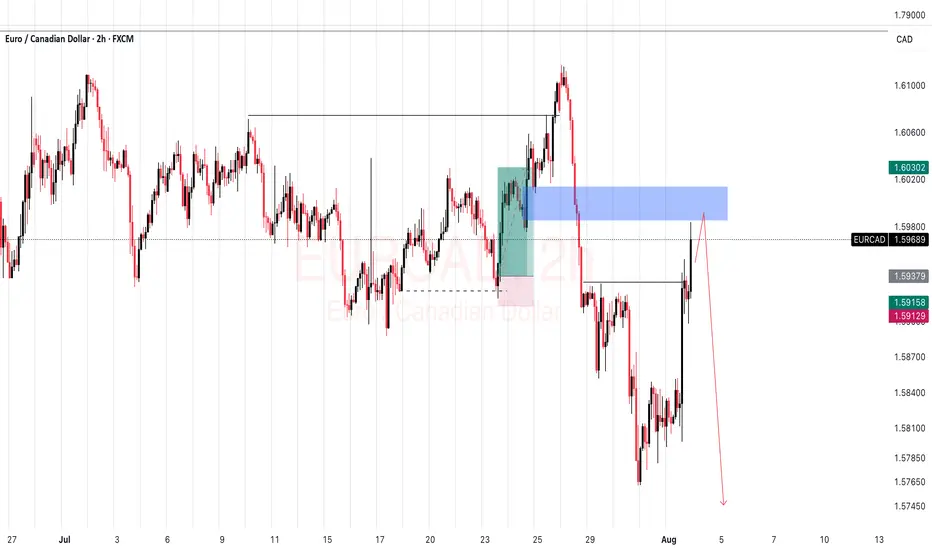
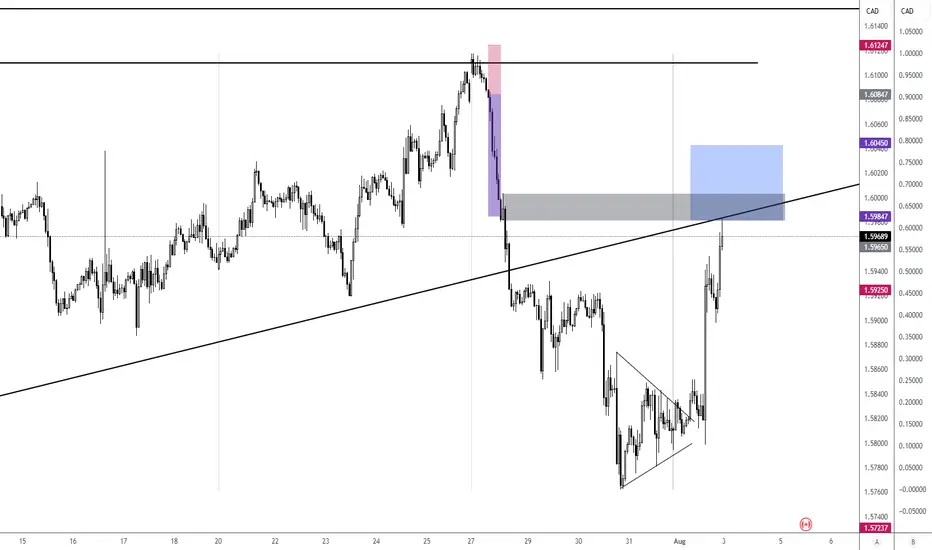
EURCAD SELL SETUPWe should see continuations on this EURCAD to the down side from this breaker blck by next week
GBP/NZD POTENTIONAL SHORT OPPORTUNITYThis is an idea for GBPNZD's potential short opportunity based on what the technicals indicate.
The trend has been emphasising its bullish approach for almost three years.
Price respected almost 11 times due to the strong resistance within 150 days between 2.265 & 2.275 and bounced off bullish OB on the daily chart and FVG on the weekly chart.
An institutional sharp decline on the weekly chart, followed by a clear wedge, can support a further drop once swept by bearish daily OB. A breakout to the micro wedge (orange) within a macro wedge can also help further down move.
Given that a bearish pin bar followed by a bearish doji is a strong warning signal of potential reversal or bearish continuation that appears inside the micro wedge.
TP1 is considered the first support at the bottom, where the daily OB and the weekly FVG meet at around 2.22000 or the area close to the trendline. If the price breaks through the trendline, TP2 and TP3 will be expected to be achieved.
TP2 may be located at the micro accumulation around 2.20000, and TP3 at the following major support around 2.15000-2.17000 that previously acted as both support and resistance.
Good luck and have a great weekend.

EURCAD ShortConfluence
1. Break and retest of the trendline
2. Order block in 1H
3. 61.8% Fib zone
It's a good spot to catch a clean 1:2. Wait for confirmation on either 1H or 2H timeframe to enter.
Good luck...
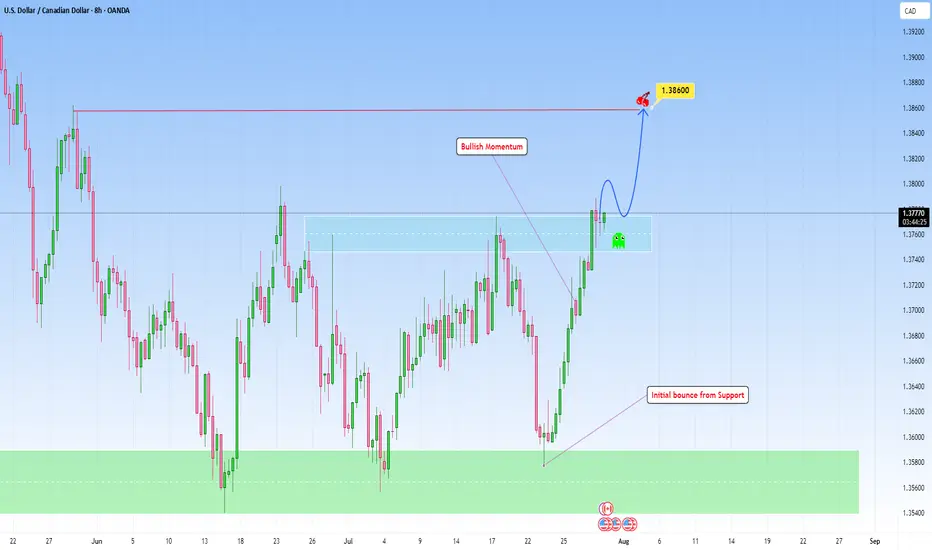
USDCAD bounced from Support and can continue higherLooking at the chart and the overall structure, I think we can favor the continuation setup with a emphasis on price action at key zones, particularly when price breaks out then can revisit this structure for a retest.
This bounce off support has been accomplished in my previous analysis:
Here, if price breaks with strength and dips back into the area and holds with bullish confirmation (likely a wick rejection or bullish engulfing on lower timeframes), that would be the cue to get in.
I am projecting the next target to 1.38600 that makes sense as a logical level for trend continuation and that I find achievable.
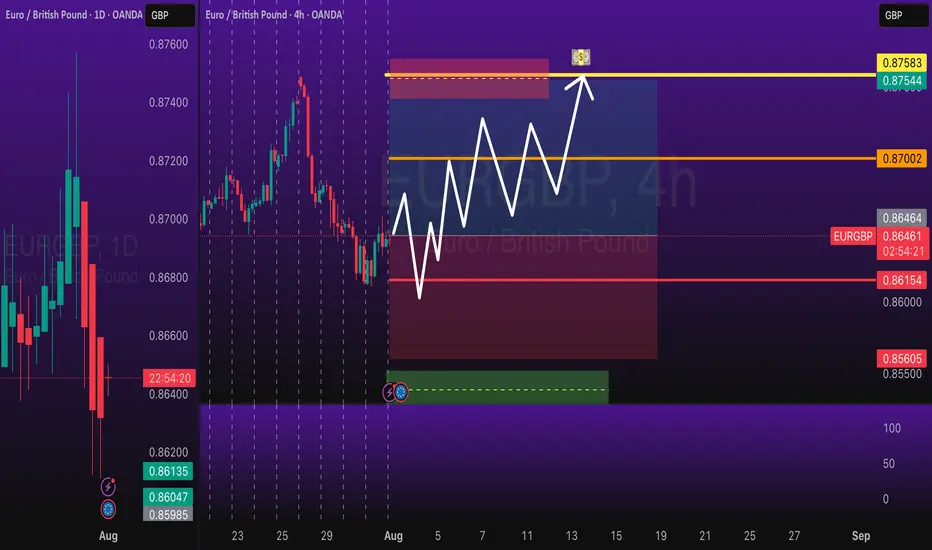
EURGBP Long Swing Trade OANDA:EURGBP Long trade, with my back testing of this strategy, it hits multiple possible take profits, manage your position accordingly.
This is good trade, don't overload your risk like greedy, be disciplined trader, this is good trade.
Use proper risk management
Looks like good trade.
Lets monitor.
Use proper risk management.
Disclaimer: only idea, not advice