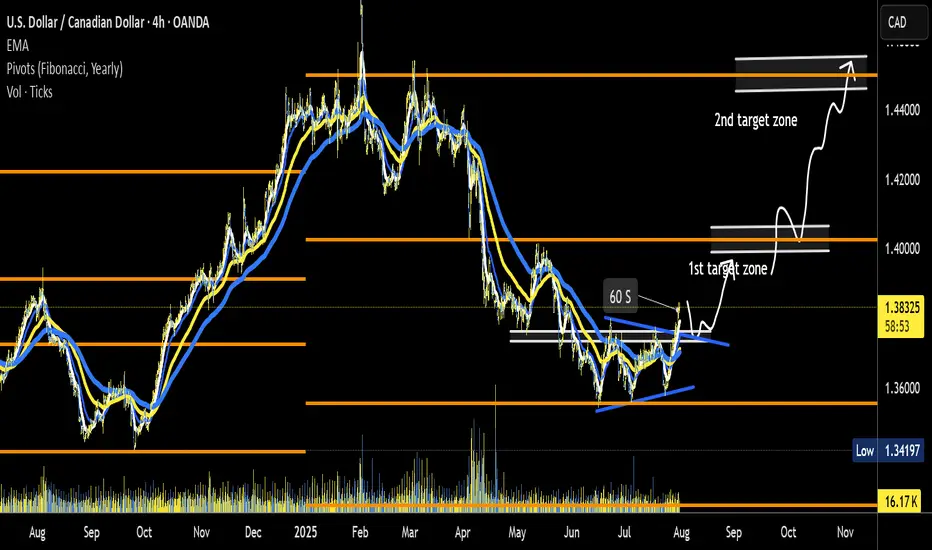
USD/CAD potential leg up setuppotential setup. Trade Plan following Road Map:
-wait for pull back zone to enter.
-pull trigger on reversal signal. monitor declining volume as confirmation- "a spike in volume for pull back ending
-target 1 zone - 1.40 area. SL lock in +/- 50% of gains at key areas of structure on 15 minute chart.
-target 2 zone - on route to T2Z use 14 ema and 34 ema as trend continuation on 5 minute and 15 minute chart - key structure: SL zone
Forex market
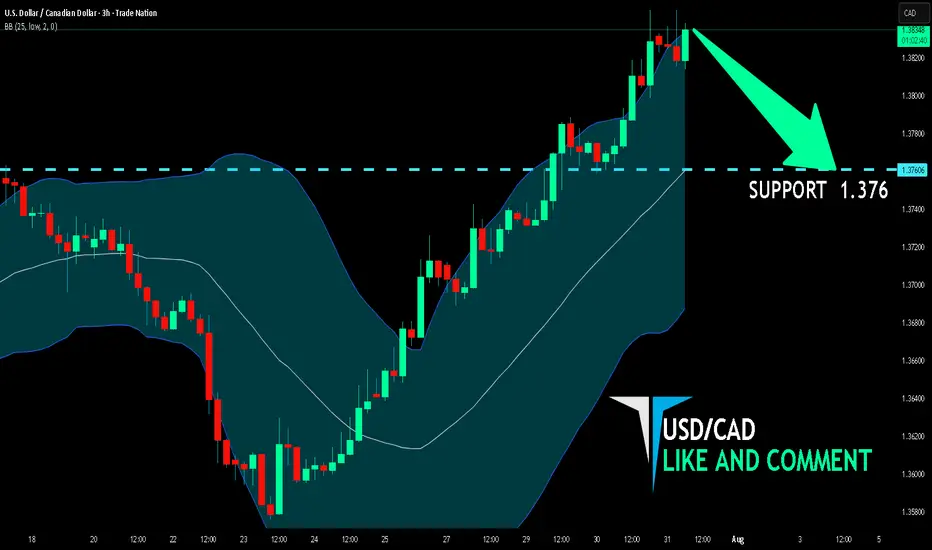
USD/CAD SHORT FROM RESISTANCE
Hello, Friends!
It makes sense for us to go short on USD/CAD right now from the resistance line above with the target of 1.376 because of the confluence of the two strong factors which are the general downtrend on the previous 1W candle and the overbought situation on the lower TF determined by it’s proximity to the upper BB band.
Disclosure: I am part of Trade Nation's Influencer program and receive a monthly fee for using their TradingView charts in my analysis.
✅LIKE AND COMMENT MY IDEAS✅
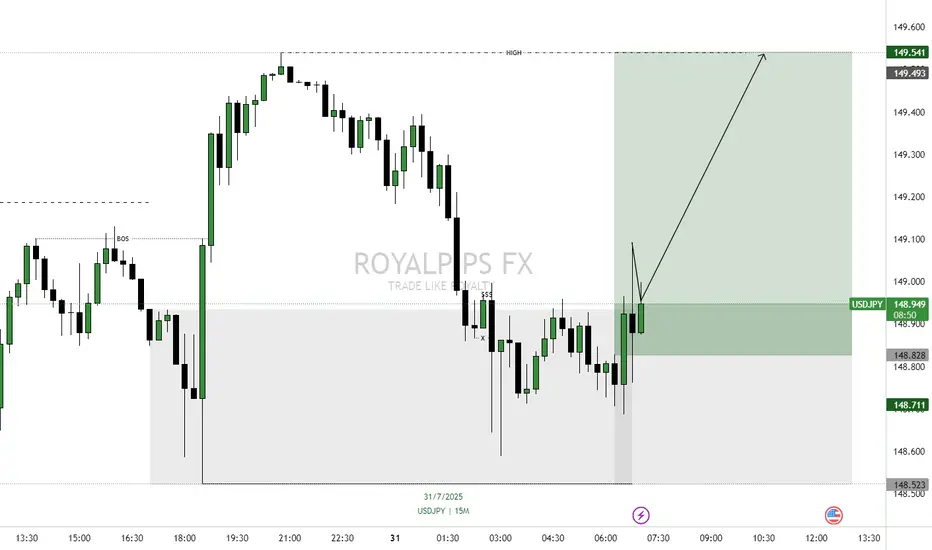
USDJPY POTENTIAL CONTINUATION AFTER A PULLBACKPrice has returned to the recent demand zone after a BOS and is now showing signs of rejection following a pullback (retracement). The mitigation of the DEMAND zone suggests that institutions may have filled their buy orders and are now ready to push price higher.
📉 Execution Plan:
• Entry: On the demand zone
• SL: Just below the demand zone (allow breathing room).
• TP: Next supply zone or based on structure (e.g., swing high, imbalance fill).
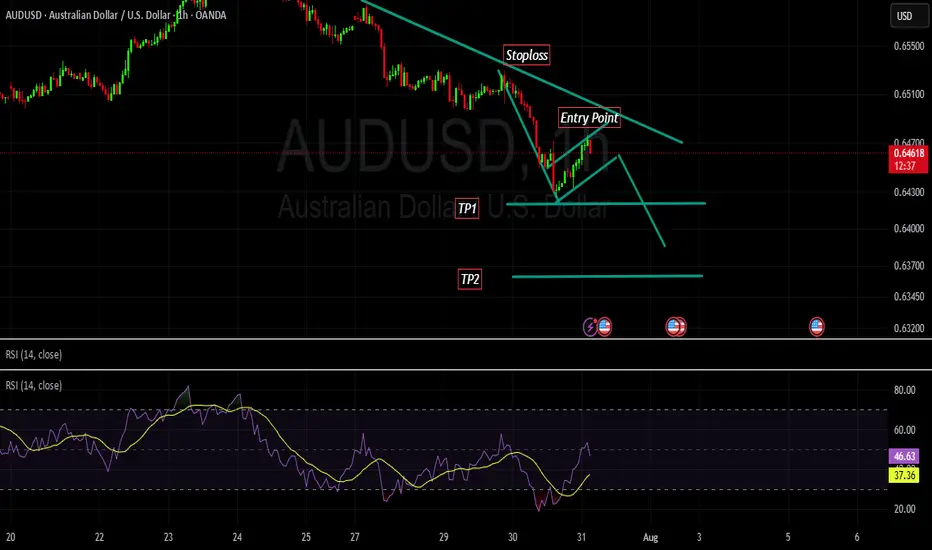
AUDUSD - Sell Setup market is in bear trend with a series of LH and LL. currently market has retraced to a fib level of 0.5% which and continuing bear trend. there is no divergence and market is making a bearish channel with a bearish flag pattern intact.
we instantly enter into the market with our SL level above last LH and TPs as projected.
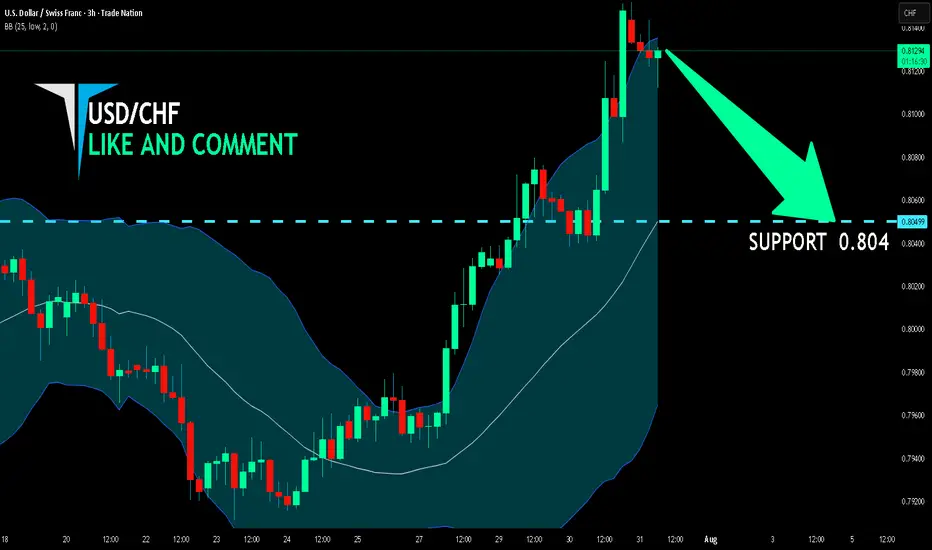
USD/CHF BEARS WILL DOMINATE THE MARKET|SHORT
Hello, Friends!
Bearish trend on USD/CHF, defined by the red colour of the last week candle combined with the fact the pair is overbought based on the BB upper band proximity, makes me expect a bearish rebound from the resistance line above and a retest of the local target below at 0.804.
Disclosure: I am part of Trade Nation's Influencer program and receive a monthly fee for using their TradingView charts in my analysis.
✅LIKE AND COMMENT MY IDEAS✅
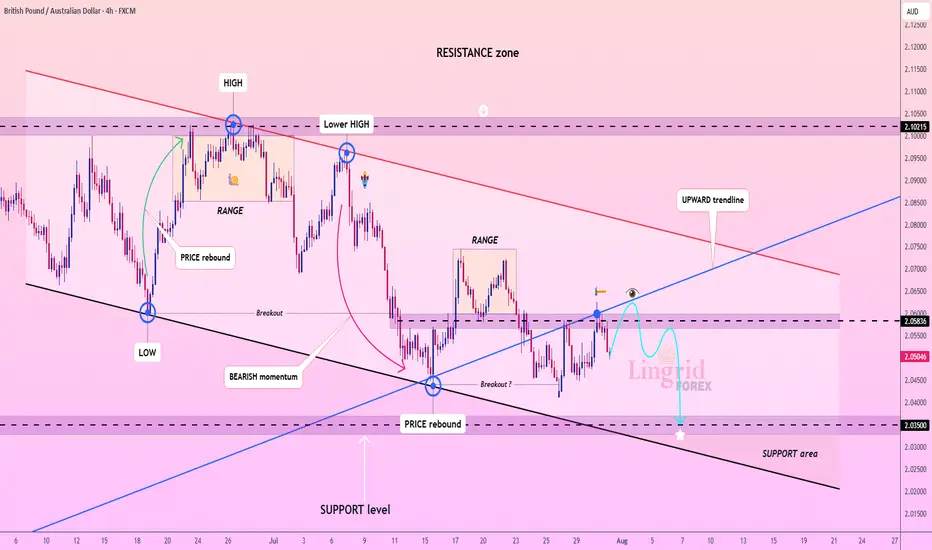
Lingrid | GBPAUD Bearish Pressure. Potential ShortThe price perfectly fulfilled my previous idea . FX:GBPAUD rebounded from support and has climbed into a tight resistance zone near 2.05836, but momentum remains weak near the downward trendline. The price structure shows a sequence of lower highs and a tight range below resistance, suggesting sellers are still in control. A rejection at this level would confirm another failed breakout attempt. If confirmed, the pair could revisit the 2.03500 support area with bearish continuation pressure.
📌 Key Levels
Sell trigger: Rejection at 2.05836 and break of 2.05000
Sell zone: 2.05800–2.06000
Target: 2.03500
Invalidation: Strong break and close above 2.06000
💡 Risks
Bullish breakout above trendline resistance
Fundamental surprise (UK/AU economic data)
Shift in broader risk sentiment or AUD weakness
If this idea resonates with you or you have your own opinion, traders, hit the comments. I’m excited to read your thoughts!
Trailing Stops:Let trades developTrailing stops are one of the most underused tools in a trader’s playbook. Most traders spend hours obsessing over entries, but then wing the exit or bail too early the moment a red candle appears. That’s where trailing stops come in. They give your trades room to breathe, while gradually reducing risk as price moves in your favour.
If you’ve ever caught a good move and felt unsure about how long to hold it, this one’s for you.
Here are three practical ways to trail your stop, stay in the trade, and help manage profitable trades objectively.
1. Trail Behind Structure
This is the simplest and most intuitive method. As the trade moves in your favour, you move your stop just behind the most recent swing high or low. In a long trade, that means raising your stop to sit just below the latest higher low. In a short, you drop it just above the most recent lower high.
This approach works best in clean, trending conditions. It gives the trade room to develop naturally without forcing you to guess the top. You won’t capture the absolute high, but you’ll often stay in the move longer than most.
It also keeps you in rhythm with the market. If the structure is broken, it’s a pretty good sign that the trend is changing or stalling and that’s a logical place to step aside.
Example:
Here’s a clean example of using structure to trail stops on a momentum trade. The entry came on a break and retest of resistance, with the initial stop placed just below the retest level. As the trade moved higher, a series of higher swing lows developed, providing clear reference points to adjust the stop.
It’s not designed to catch the exact top and that’s fine. The goal is to follow price action with minimal lag, using objective structure rather than guesswork.
EUR/USD Hourly Candle Chart
Past performance is not a reliable indicator of future results
2. Use Moving Averages
Trailing stops don’t have to follow every single swing. Sometimes, a smoother option is better, especially if you want to stay in a move that’s trending hard. That’s where moving averages come in.
A short-term exponential moving average like the 9 or 21 EMA can act as a dynamic trailing stop. As long as price remains above the average, the trend is intact and you stay in. If price closes below the EMA in a long trade, or you get a crossover in the opposite direction, that can signal an exit or at least a scale-down.
This method works best in fast, directional markets. It won’t suit every condition, but when the move is strong, letting a trade run along the moving average keeps things simple and stress-free.
Example:
In this short-term 5-minute chart example, the 21 EMA acts as a dynamic trailing stop. There are two common approaches. You can wait for a candle to close below the 21 EMA, or use a crossover trigger where the 9 EMA crosses under the 21 EMA. The choice depends on how tightly you want to manage the trade and how much room you are willing to give it.
S&P 500 5min Candle Chart
Past performance is not a reliable indicator of future results
3. Volatility-Based Stops (ATR)
When the market gets fast and messy, a fixed stop can either get hit too easily or feel too far away. That’s where volatility-based stops come in. The most common tool for this is the Average True Range (ATR).
Instead of using swing points, you trail your stop a set number of ATRs behind the current price. If ATR is rising, your stop gives the trade more room. If volatility shrinks, the stop tightens naturally. It’s an adaptive approach that works well in conditions where price is expanding or moving fast.
A popular setting is to use two times the current ATR value, but you can adjust it to suit your timeframe or risk tolerance.
Example:
This is a classic wedge breakout setup in gold. A trailing stop set at two times the ATR helps manage risk while giving the trade enough room to breathe. As price moves in your favour, the stop tightens automatically based on volatility. It’s worth remembering that trailing stops are only adjusted in one direction. Once set, they follow the move but are never loosened, which means the stop will eventually take you out as momentum fades or the market turns.
Gold Daily Candle Chart
Past performance is not a reliable indicator of future results
Decide on Your Technique BEFORE You Place the Trade
There’s no perfect way to trail a stop. Each method has its strengths. Structure-based stops keep you aligned with price action. EMAs are smooth and simple. ATR lets volatility do the work for you.
The most important thing is to make a decision before you place the trade. Know whether you’re using a manual swing method or a dynamic indicator. Know what would trigger a move in your stop, and what would keep it steady. Avoid changing the plan just because the trade gets emotional.
Trailing stops give you freedom. They let you step back, protect your capital and give your best trades a real chance to develop. Used properly, they enhance trade management consistency.
Disclaimer: This is for information and learning purposes only. The information provided does not constitute investment advice nor take into account the individual financial circumstances or objectives of any investor. Any information that may be provided relating to past performance is not a reliable indicator of future results or performance. Social media channels are not relevant for UK residents.
Spread bets and CFDs are complex instruments and come with a high risk of losing money rapidly due to leverage. 85.24% of retail investor accounts lose money when trading spread bets and CFDs with this provider. You should consider whether you understand how spread bets and CFDs work and whether you can afford to take the high risk of losing your money.
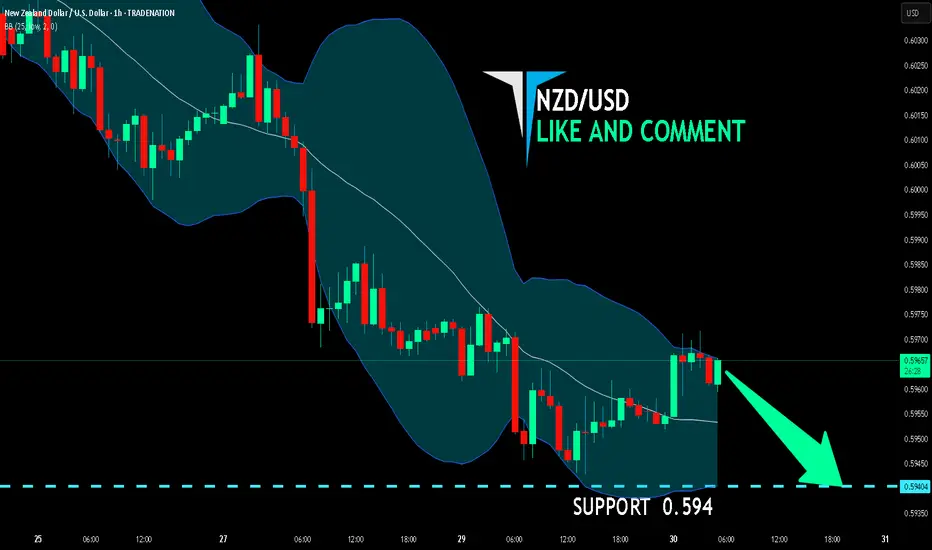
NZD/USD SELLERS WILL DOMINATE THE MARKET|SHORT
Hello, Friends!
NZD-USD uptrend evident from the last 1W green candle makes short trades more risky, but the current set-up targeting 0.594 area still presents a good opportunity for us to sell the pair because the resistance line is nearby and the BB upper band is close which indicates the overbought state of the NZD/USD pair.
Disclosure: I am part of Trade Nation's Influencer program and receive a monthly fee for using their TradingView charts in my analysis.
✅LIKE AND COMMENT MY IDEAS✅
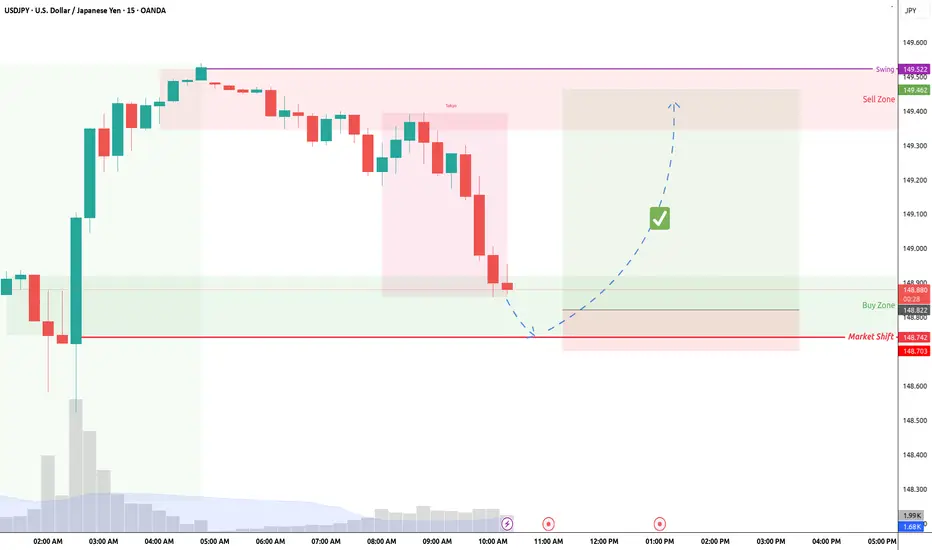
USDJPY 60/15 Pullback LongOverall up trend. Yesterday session a 'b' market profile. Aways from POC. looking for up continuous. Now is in pullback, montior for long oppoturnity.
If break and stay below market shift, then no go.
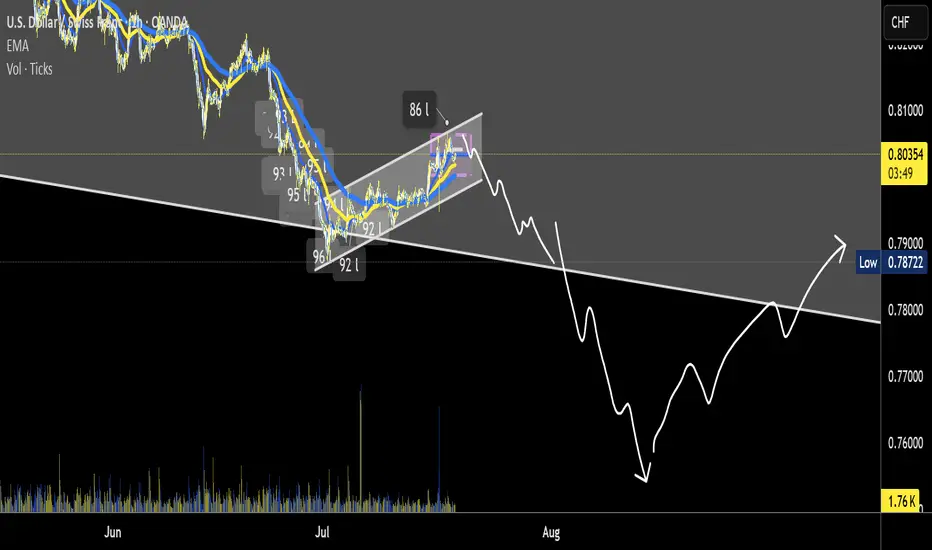
USD/CHF hoping lower. before major up turnA note to myself:
- remember no matter what happens. its a 50/50 chance you are right. even with a winning
strategy.
- whats going on inside of yourself. why? whats it trying to tell you?
- what have you learned about yoursefl?
- be patient, take a breathe and be aware of FOMO
- Its not about quantity. its about quality.(choose MAX. 3 trades a week)
- stick to your plan. load up on quality trades.
- RISK MANAGEMENT is the key to being a successful trader AND Risk Reward Ratio minimum 1:3 w
EURUSD REACHED THE TARGET.EURUSD REACHED THE TARGET.
EURUSD has reached the 1.14500 level and even broke it down. Currently the price consolidates slightly below this level. If the price forms a false breakout of 1.14500 level, this will mean the end of short-term decline in the pair. Stay cautious.
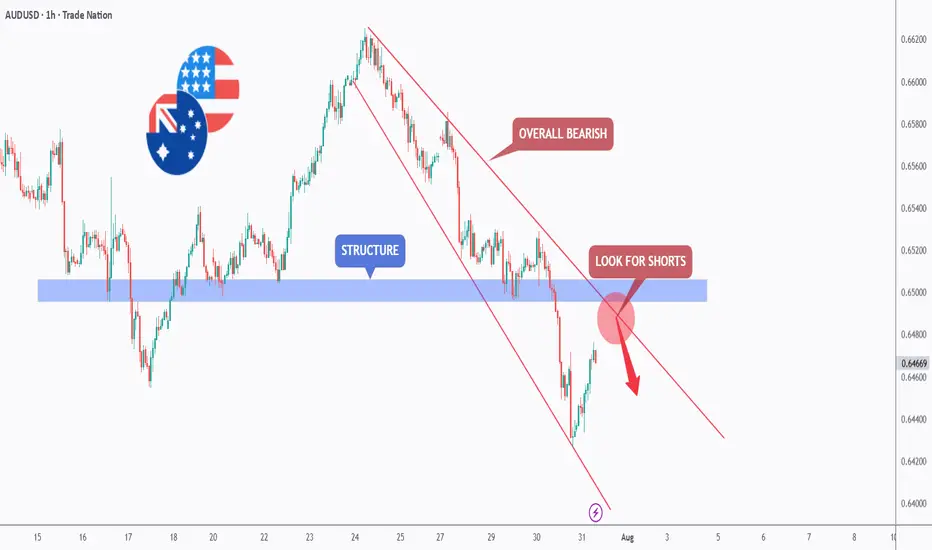
Sell the Rip? AUDUSD Retest Zone AlertHello TradingView Family / Fellow Traders. This is Richard, also known as theSignalyst.
📈AUDUSD has been overall bearish , trading within the falling red channel and it is currently retesting the upper bound of the channel.
Moreover, it is rejecting a structure marked in blue.
📚 As per my trading style:
As #AUDUSD approaches the red circle zone, I will be looking for trend-following sell setups on lower timeframes. (like a double top pattern, trendline break , and so on...)
📚 Always follow your trading plan regarding entry, risk management, and trade management.
Good luck!
All Strategies Are Good; If Managed Properly!
~Rich
Disclosure: I am part of Trade Nation's Influencer program and receive a monthly fee for using their TradingView charts in my analysis.
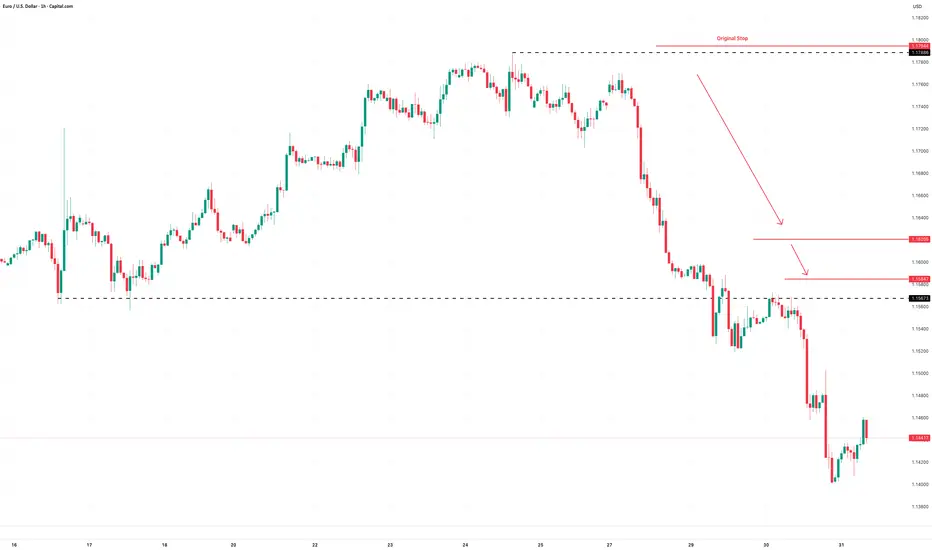
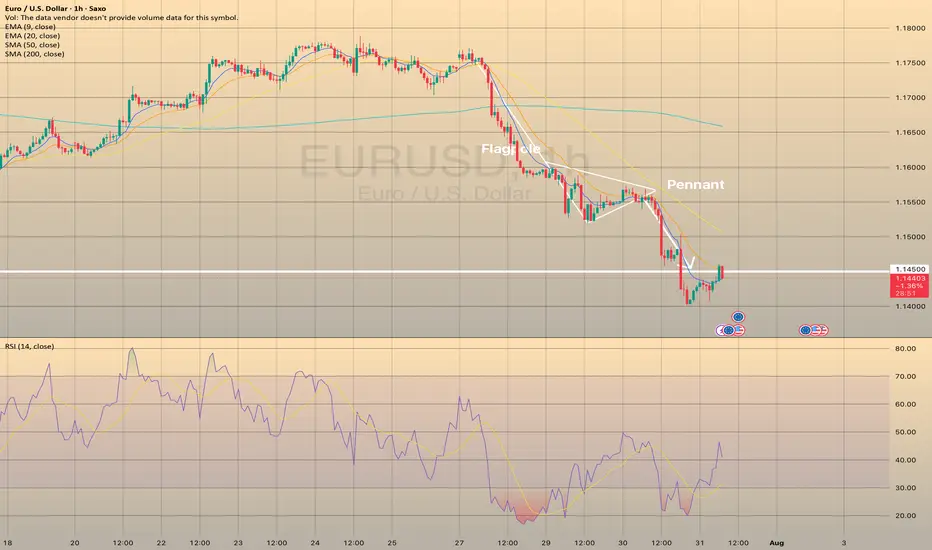
EURUSD breakdown alert – Will the drop accelerate?Hello traders, let’s take a look at how EURUSD is performing today!
Yesterday, EURUSD extended its downward slide after failing to sustain bullish momentum from the 1.1600 zone. The pair is now hovering around 1.1426.
The recent decline is largely attributed to the strength of the US dollar, which continues to benefit from a series of upbeat economic data – including robust job reports, strong consumer spending, and improving sentiment. All of these came in above expectations, pushing the dollar higher. In contrast, the European Central Bank (ECB) maintains a cautious stance, with no clear signals of policy changes – leaving the euro under persistent pressure.
From a technical standpoint, the short-term outlook suggests the beginning of a new bearish wave. Notably, price action is reacting to resistance from the nearby EMA 34 and EMA 89 levels. The break below the recent support zone has added fuel to the ongoing bearish momentum.
If the current support fails to hold, EURUSD could slip further toward the 1.272 Fibonacci extension at 1.1305, and potentially as low as 1.1178 – the 1.618 extension level.
Looking ahead, traders should focus on potential pullback opportunities, targeting SELL entries around 1.1540–1.1580 – a confluence zone of technical interest. However, if price breaks above the 1.1600 threshold and holds, this bearish scenario may be invalidated.
What’s your outlook for EURUSD in the coming days? Share your thoughts in the comments below!

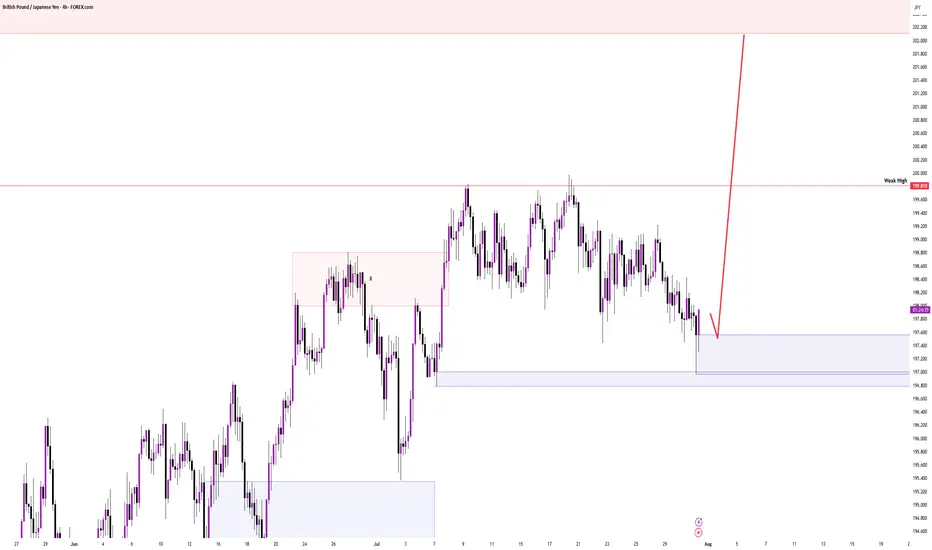
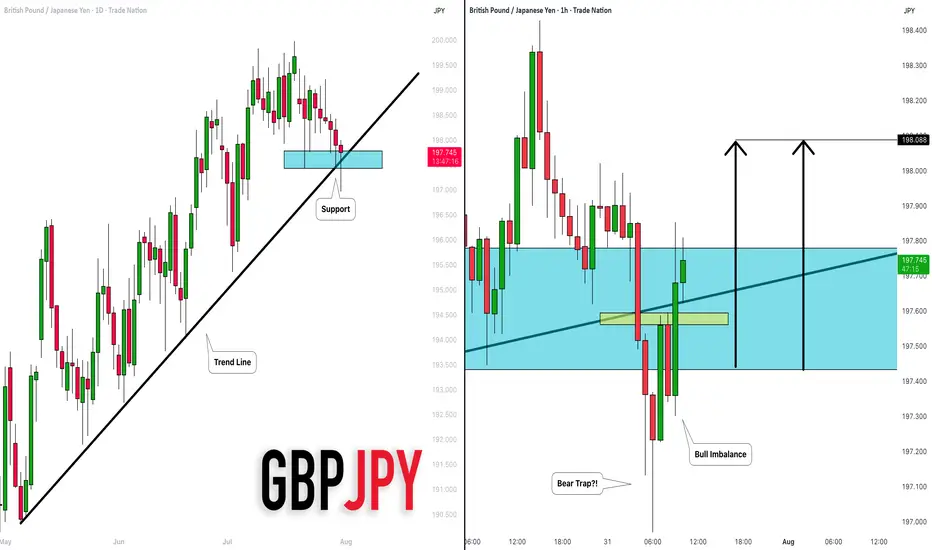
GBPJPY: Important Demand Zone 🇬🇧🇯🇵
GBPJPY is trading within an important demand zone that
is based on a rising trend line and a horizontal support.
We see a false violation of that and a bear trap, followed
by a bullish imbalance candle.
I think that the pair may go up and reach at least 198.08 level.
❤️Please, support my work with like, thank you!❤️
I am part of Trade Nation's Influencer program and receive a monthly fee for using their TradingView charts in my analysis.
EUR/USD Potential Bearish MoveHi Traders.
1. HTF Expanding Structure
2. HnS Pattern
3. LTF Bearish Impulse
4. Breakout from Structure
Wait for LTF Correction and Breakout to confirm this setup

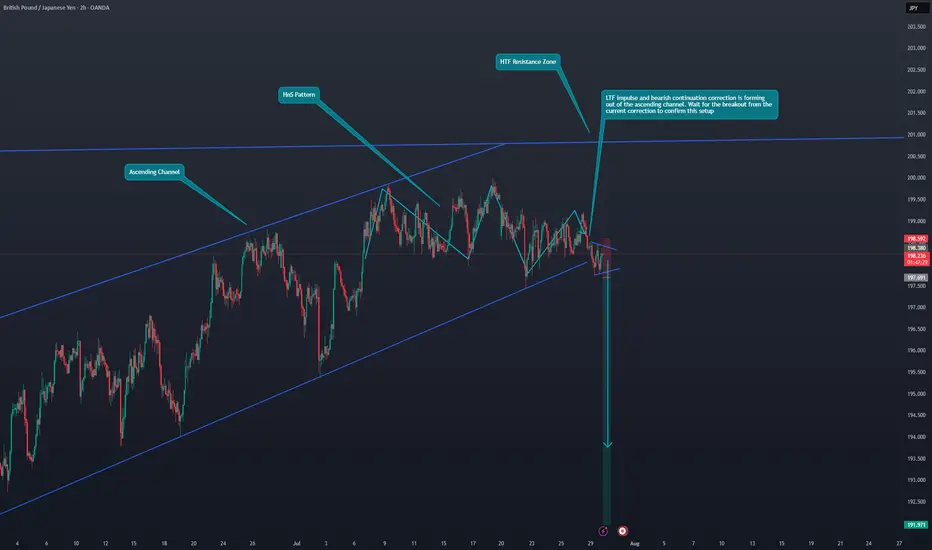
GBP/JPY Bearish OutlookHi Traders.
LTF impulse and bearish continuation correction is forming
out of the ascending channel. Wait for the breakout from the
current correction to confirm this setup
Fundamental Market Analysis for July 31, 2025 GBPUSDGBPUSD:
The pound remains under pressure as consumer spending and the labor market in the UK are weakening, reducing the likelihood of an aggressive response from the Bank of England. Core inflation has dropped to 3.3% y/y – the lowest in two years – allowing the regulator to keep rates steady for longer.
External factors are also unfavorable: demand for the defensive dollar is strengthening ahead of the FOMC meeting, and the yield spread between 10-year gilts and USTs has narrowed to 115 basis points – the lowest since March, stimulating flows into the dollar.
Additional negative dynamics come from the rise in the UK current account deficit to 3.9% of GDP, amid higher prices for imported energy and declining exports of services. Expectations of tighter fiscal consolidation are increasing fiscal risks and encouraging investors to reduce long GBP positions.
Risks to the bearish outlook are limited: these would be a surprise in the form of hawkish Bank of England comments or a sharp deterioration in US macro data that could weaken the dollar.
Trade recommendation: SELL 1.32700, SL 1.32900, TP 1.31700
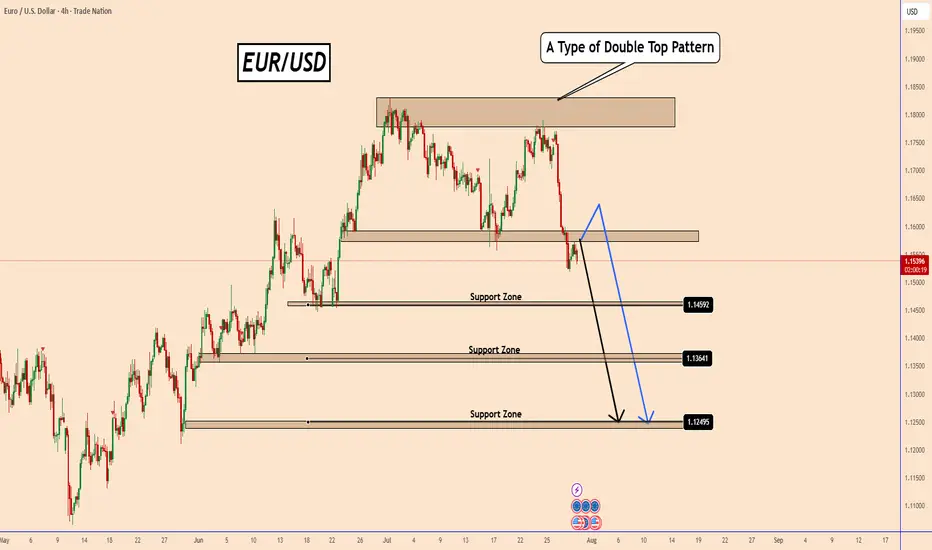
EURUSD: Double Top Pattern Ahead of FOMC MeetingEURUSD: Double Top Pattern Ahead of FOMC Meeting
EURUSD has formed a possible double top, and price action is now trading below the neckline - an indication of increasing bearish probability.
All eyes are on today's FOMC and the interest rate decision. If the Fed signals a rate cut or hints at future easing, this could trigger a sell-off, further validating the bearish scenario.
Although the USD has been weak for an extended period, the market may be changing its positioning this time. Even if EURUSD moves higher during the event, the broader setup favors a decline.
⚠️ Trading around major news events is very risky. It's better to wait for clarity after the FOMC before taking any action.
You may find more details in the chart!
Thank you and Good Luck!
PS: Please support with a like or comment if you find this analysis useful for your trading day
Disclosure: I am part of Trade Nation's Influencer program and receive a monthly fee for using their TradingView charts in my analysis.
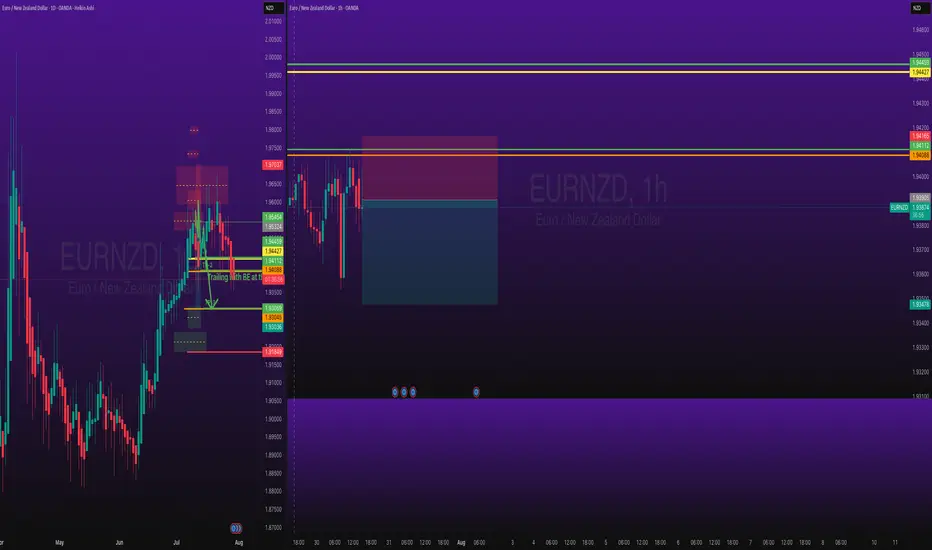
EURNZD Short Day Trade OANDA:EURNZD Short Day Trade - Low Risk, with my back testing of this strategy, it hits multiple possible take profits, manage your position accordingly.
Note: Manage your risk yourself, its risky trade, see how much your can risk yourself on this trade.
Use proper risk management
Looks like good trade.
Lets monitor.
Use proper risk management.
Disclaimer: only idea, not advice
NZDCHF Long Trade OANDA:NZDCHF Long Day Trade - Low Risk, with my back testing of this strategy, it hits multiple possible take profits, manage your position accordingly.
Note: Manage your risk yourself, its risky trade, see how much your can risk yourself on this trade.
Use proper risk management
Looks like good trade.
Lets monitor.
Use proper risk management.
Disclaimer: only idea, not advice

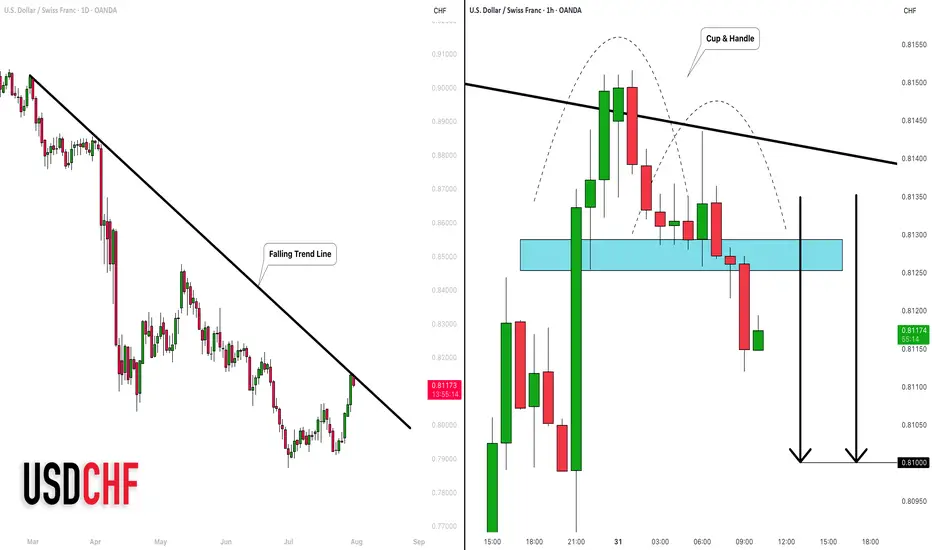
USDCHF: Correction Ahead! 🇺🇸🇨🇭
I think that USDCHF is going to retrace after a test
of a major falling trend line on a daily.
As a confirmation, I found an inverted cup & handle pattern
on an hourly time frame.
Closest support - 0.81
❤️Please, support my work with like, thank you!❤️
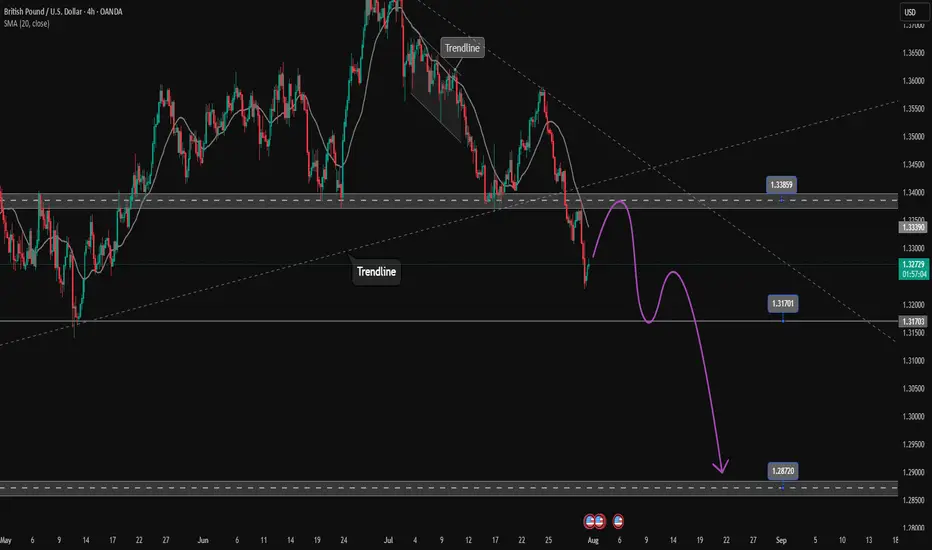
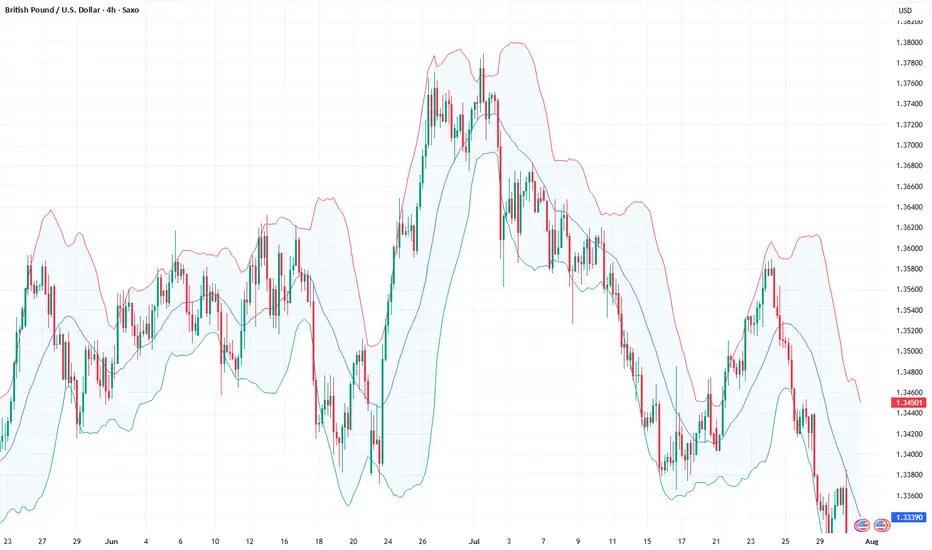
GBPUSD extends to the downside. Wait for retest to sell✏️ OANDA:GBPUSD confirms the downtrend by breaking the trendline. The downtrend is still extending to lower areas because the GBPUSD bearish wave structure is very beautiful. Some selling momentum appears around the breakout zone of 1.339, which will form a bearish structure towards the support of 1.287 in the near future. Putting faith in the trendline at the moment is reliable.
📉 Key Levels
SELL zone 1.339-1.341
SELL DCA trigger: Break and trading bellow 1.317
Target 1.287
Leave your comments on the idea. I am happy to read your views.