Forex market

GBP/USD Long SetupGBP/USD Long Setup
Hello traders,
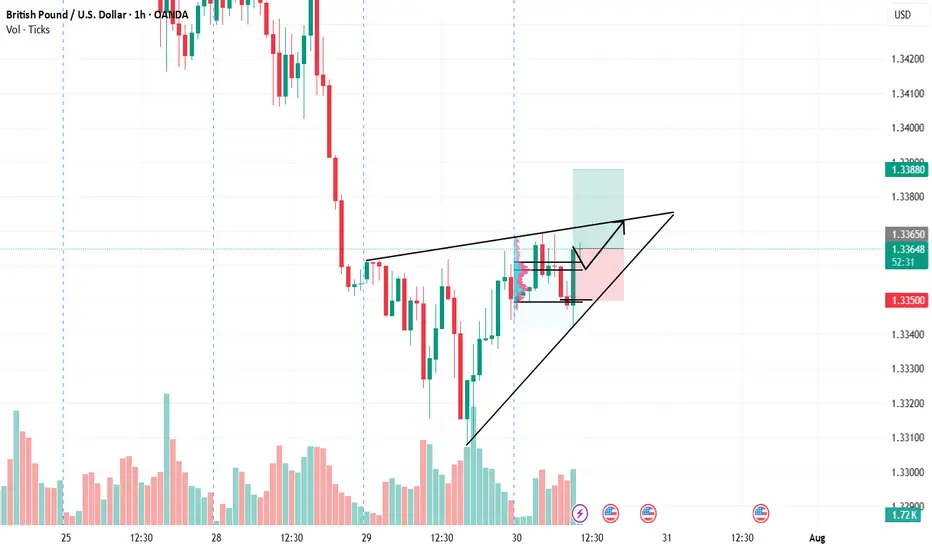
On the 1-hour chart, we’ve observed a strong bullish candle formation, indicating potential for further upside movement. Based on this setup:
Entry: 1.33650
Stop-Loss: 1.33500
Take-Profit: 1.33880
Exit Plan: We plan to close the trade by the end of the European session.
Trade safely and manage your risk accordingly!
Disclaimer: This is not financial advice. Please conduct your own analysis before entering any trades. Trading involves risk, and you should never risk more than you can afford to lose.
USDJPY long at current market priceDaily candle USDJPY closed at strong bullish.
we observed healthy retracement during Asian session.
I'm expecting the price will bounce from here.
Calculate your own risk & reward.
Good Luck

eurusd buy short termafter yesterday's drop of the euro, today and tomorrow should make a small correction of 100 pips, extending to 150 pips, until the value of 1.1550

EURUSD Bullish ReversalI am currently in a bullish trade on EURUSD. We are on a weekly support after we have made a far heavy drop, I am expecting this pattern formation to be what triggers a bounce on this support level. I am targeting the most recent level.
GBPUSD Big Bullish Move incoming.GGBPUSD as trending to the upside quite a few months, breaking above 1.3450 leaving behind a Trapped zone for the sellers which is weekly Flip level which happened right before the breaking up and also the market created a liquidity Zone which is intended to further Trap the the seller, and it is acting as a Double Bottom area, i hope sellers will be trapped the next week and righ after that we look for our bullish positions.

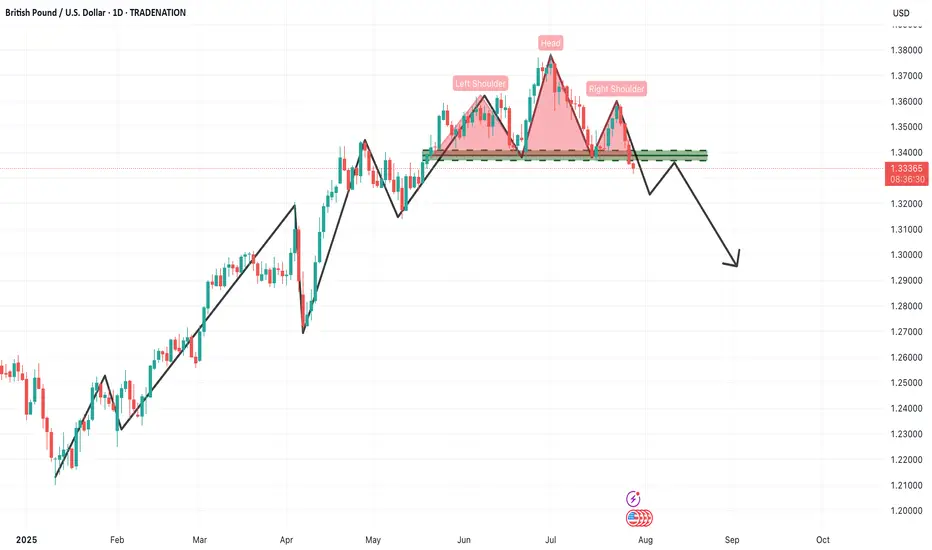
GBPUSD – Daily Timeframe Analysis: Head & Shoulders PatternThe GBPUSD daily chart is currently presenting a textbook Head & Shoulders reversal pattern, a powerful bearish signal that often marks the end of an uptrend and the beginning of a new downward cycle. This setup demands attention from swing and positional traders alike, especially considering the size and clarity of the structure.
🔍 Pattern Breakdown
Left Shoulder: Formed in late May, establishing a significant high before a corrective move.
Head: A higher peak was made in early June, which now stands as the pattern's highest point.
Right Shoulder: A lower high formed in mid-July, indicating weakening bullish momentum.
Neckline: The crucial horizontal support zone around 1.3330–1.3340 was tested multiple times and has now been decisively broken, triggering a confirmed bearish setup.
📊 Technical Significance
This Head & Shoulders pattern becomes especially meaningful due to:
Multiple rejections at the neckline, confirming its strength as support-turned-resistance.
Bearish volume expansion on the breakdown, adding weight to the selling pressure.
Formation on a daily timeframe, suggesting a long-term trend reversal rather than a short-term pullback.
📌 Trading Strategy for Traders
✅ Sell Setup (Short Position)
Entry: Around the neckline zone on retest (1.3320–1.3340)
Stop Loss: Above the right shoulder (~1.3550)
Targets:
🎯 Target 1: 1.3100 (psychological and horizontal support)
🎯 Target 2: 1.2900 (measured move from head to neckline)
🎯 Target 3: 1.2650–1.2600 (extended downside zone based on structure)
⚠️ Risk Management Tips:
Don’t chase the breakdown — wait for a pullback/retest of the neckline to get a better risk/reward entry.
Ensure position sizing is appropriate based on the stop loss distance.
If price reclaims the neckline with strong bullish momentum and closes above 1.3350, exit short and reevaluate.
🧠 What Traders Should Keep in Mind
Macro Fundamentals: Watch upcoming economic events like BoE rate decisions, US NFP, and inflation data, which can cause volatility and impact the technical scenario.
Dollar Index (DXY) trend should also be monitored closely. If DXY rallies, GBPUSD breakdown can accelerate.
Trendline Confirmation: Align this with any break of rising trendlines drawn from previous lows.
📌 Final Thought
This pattern marks a crucial turning point in GBPUSD. The momentum has clearly shifted from buyers to sellers, and the breakdown opens up significant downside room. As a swing or position trader, this is a high-probability setup with a clear invalidation point (above the right shoulder) and a favorable risk-reward ratio.
📉 Patience and precision are key here. Let price come to you at the neckline, confirm rejection, and then take the trade with confidence.
=================================================================
Disclosure: I am part of Trade Nation's Influencer program and receive a monthly fee for using their TradingView charts in my analysis.
=================================================================
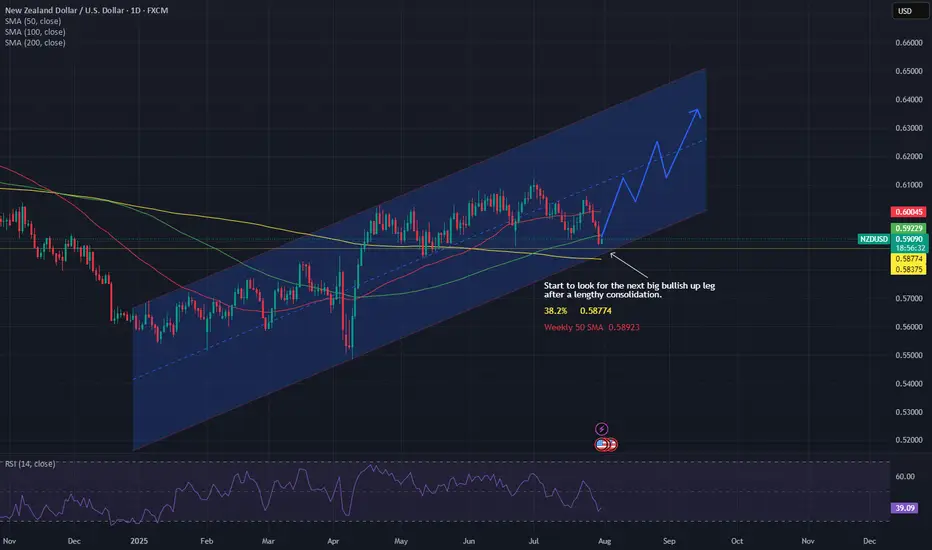
The next NZD Bullish up leg looks ready.NZD has been in a side ways consolidation period for weeks now but as channel support, Weekly 50 MA, Daily 200 MA, 38.2% fib of first up leg all line up, could this be the start of the next big move.
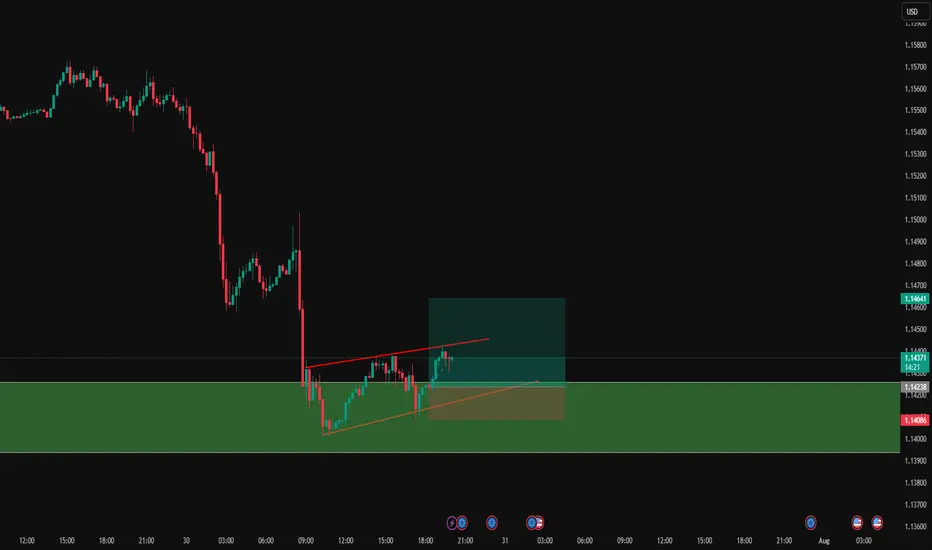
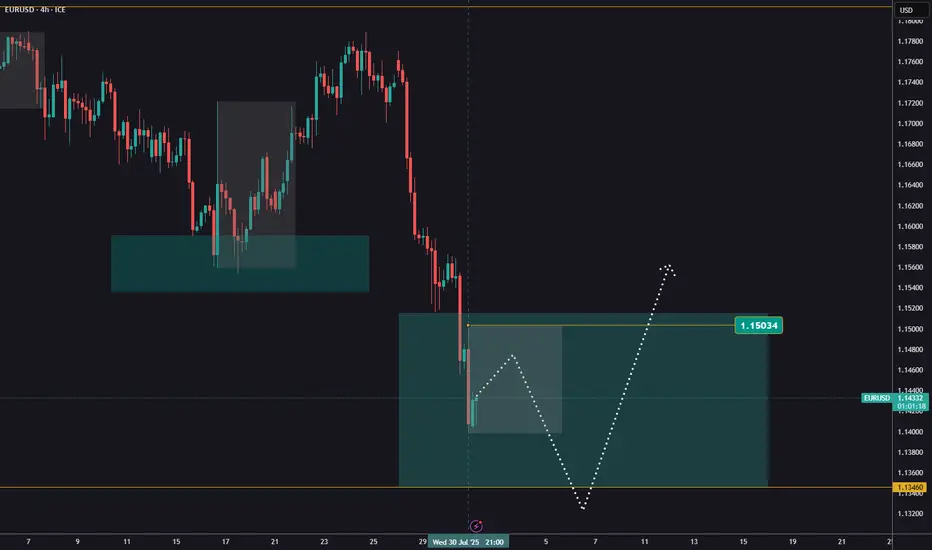
EURUSD after the FedEURUSD continues to trade within the reversal zone highlighted in our previous analyses.
Following yesterday’s Fed decision, we’re seeing additional downside movement, though price hasn’t yet reached the support level at 1,1346.
Our outlook remains unchanged – we’re watching for the end of the pullback and will look for buying opportunities afterwards.
The H1 candle formed during the news release can serve as a reference. A break and close above it would signal a potential reversal to the upside.
Conversely, if price breaks and closes below that candle, it would suggest the correction is likely to continue toward lower levels.
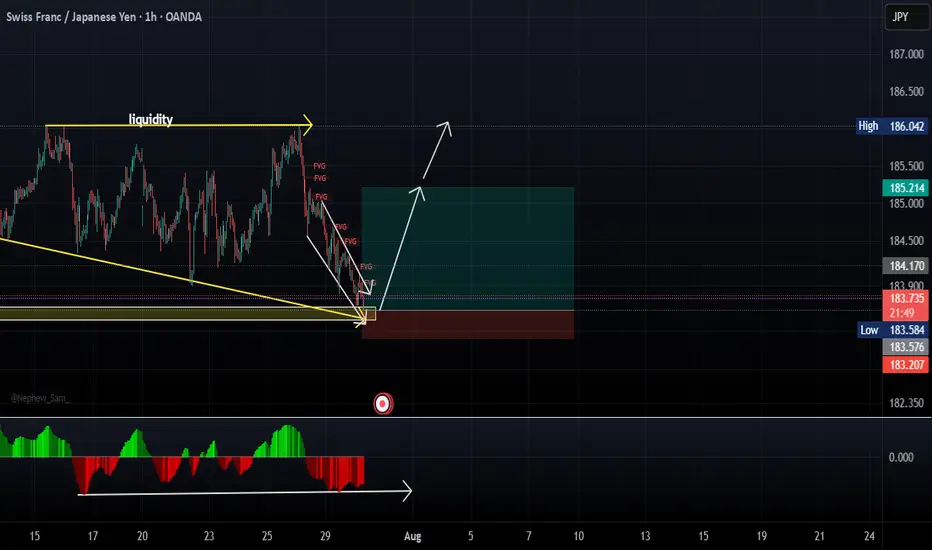
CHFJPY LONGReason for entry
1. Regular flat structure
2. Ending structure in play
3. Gap 183.065 taken
4. Liquidity at the top (equal highs)
5. MACD divergence
Strategy: Engulfing candle should take out 184.058 to enter
Take Profit : 186.023
Stop loss: 183.211
Entry: 184.058/183.587 (GAP)
Once 185.208 is taken out, place trade at BE or Take profit
USDJPY AnalysisThis analysis is based on the 4-hour timeframe, reversal trading, and trend formation. I' looking for buys in this market and I explained why in the video. I will post updates on this analysis soon!

USDJPY Buy analysis/ideaThis trade is based on the daily and 3-hour timeframes and executed using reversal trading and trend formation. This is an update for the previous analysis that I posted earlier on this pair . complete explanation in the video!

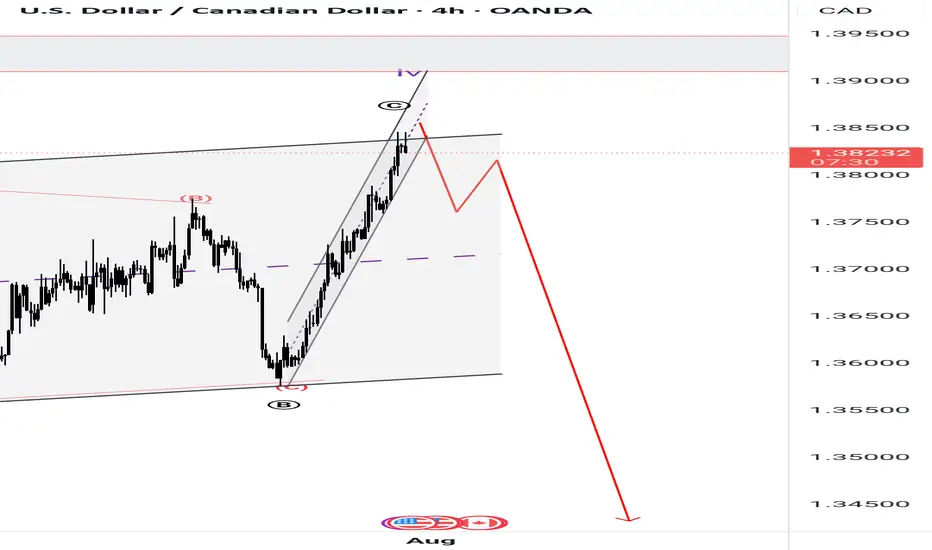
Potential BEARSAfter a prolonged and a complex correction, it looks out to be a FLAT CORRECTION with wave B producing a flat correction as well in a lower degree hence making it all complex. But at the moment we have a perfect channel AB=CD correction which prompts a continuation to the south. Fingers crossed 🤞 as the market rejects a resistance of the channel.
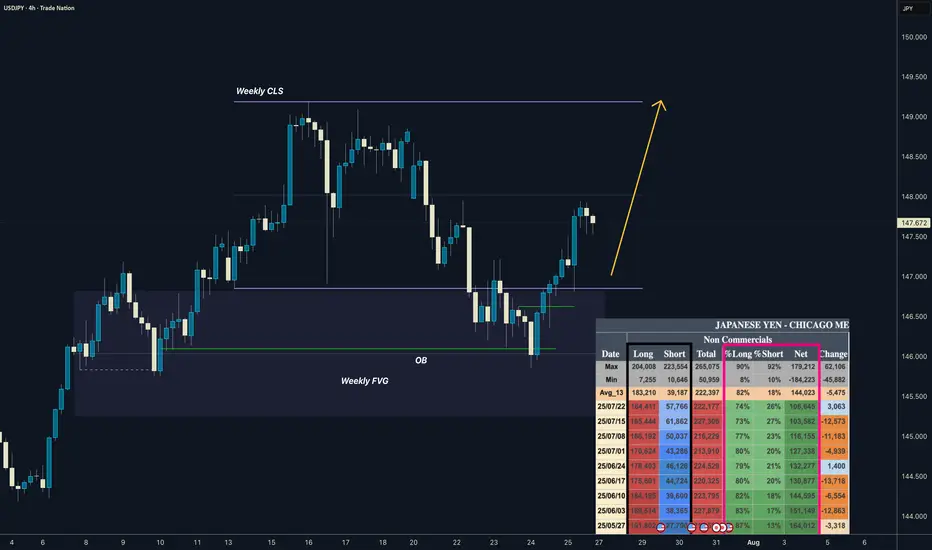
USDJPY I Weekly CLS I Model 1 / 2 I COT Bullish ASFYo Market Warriors ⚔️
Fresh Crypto Analysis— if you’ve been riding with me, you already know:
🎯My system is 100% mechanical. No emotions. No trend lines. No subjective guessing. Working all timeframes. Just precision, structure, and sniper entries.
🧠 What’s CLS?
It’s the real smart money. The invisible hand behind $7T/day — banks, algos, central players.
📍Model 1:
HTF bias based on the daily and weekly candles closes,
Wait for CLS candle to be created and manipulated. Switch to correct LTF and spot CIOD. Enter and target 50% of the CLS candle.
For high probability include Dealing Ranges, Weekly Profiles and CLS Timing.
Analysis done on the Tradenation Charts
Disclosure: I am part of Trade Nation's Influencer program and receive a monthly fee for using their TradingView charts in my analysis.
Trading is like a sport. If you consistently practice you can learn it.
COT Data
we can see reduced longs exposure and increasing shorts on JPY contract which is clear signs of bullishness confirmed by decreasing Net positions.
“Adapt what is useful. Reject whats useless and add whats is specifically yours.”
David Perk aka Dave FX Hunter
💬 Comment any Coin I ll give you my quick view
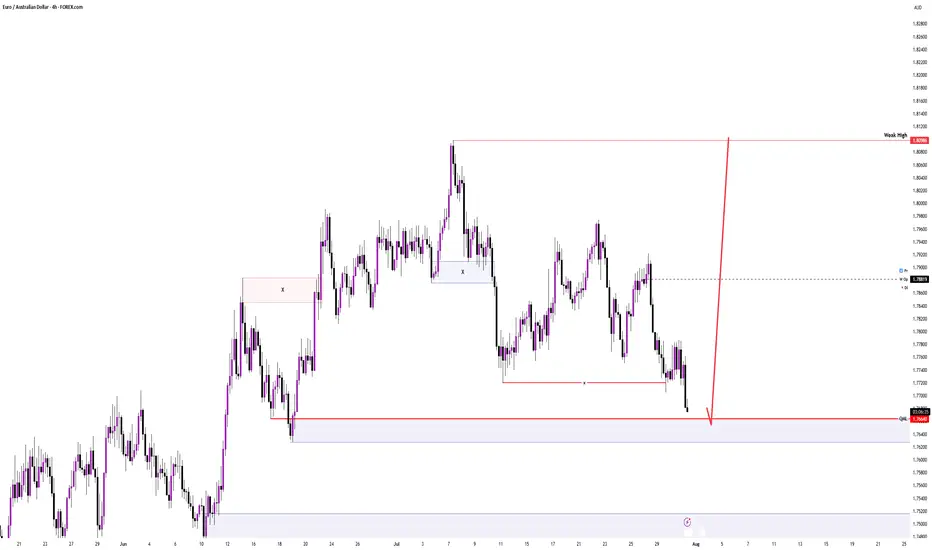
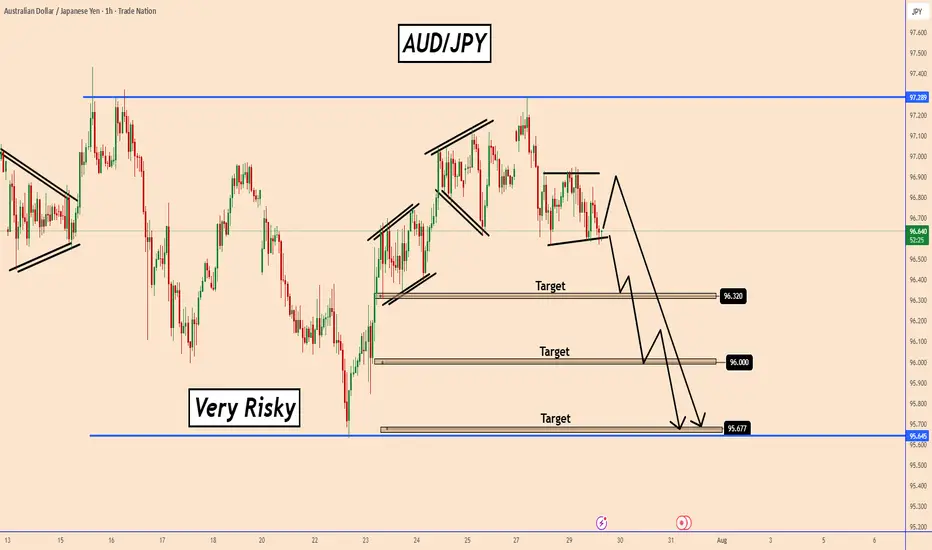
AUDJPY Poised to Start a Distribution Phase to 98.70AUDJPY Poised to Start a Distribution Phase to 98.70
On the 60-minute chart, AUDJPY has completed the accumulation phase, and it appears that AUDJPY is preparing for a breakout phase.
This is happening on the 60-minute chart.
The price that has already formed a pattern has a lower form and chances are that it may fall further from this area.
If this happens, AUDJPY may start another impulsive downward move.
In the overall picture, AUDJPY faced a strong resistance near 97.30 and is indicating a downward move to 95.70.
You may find more details in the chart!
Thank you and Good Luck!
PS: Please support with a like or comment if you find this analysis useful for your trading day
Disclosure: I am part of Trade Nation's Influencer program and receive a monthly fee for using their TradingView charts in my analysis.
EURUSD I Its re-accumulation. COT Overview Hey what up traders welcome to the COT data and Liquidity report. It's always good to go with those who move the market here is what I see in their cards. I share my COT - order flow views every weekend.
🎯 Non Commercials added significant longs and closed shorts at the same time. So for that reason I see the highs as a liquidity for their longs profits taking.
📍Please be aware that institutions report data to the SEC on Tuesdays and data are reported on Fridays - so again we as retail traders have disadvantage, but there is possibility to read between the lines. Remember in the report is what they want you to see, that's why mostly price reverse on Wednesday after the report so their cards are hidden as long as possible. However if the trend is running you can read it and use for your advantage.
💊 Tip
if the level has confluence with the high volume on COT it can be strong support / Resistance.
👍 Hit like if you find this analysis helpful, and don't hesitate to comment with your opinions, charts or any questions.
Analysis done on the Tradenation Charts
Disclosure: I am part of Trade Nation's Influencer program and receive a monthly fee for using their TradingView charts in my analysis.
"Adapt what is useful, reject what is useless, and add what is specifically your own."
— David Perk aka Dave FX Hunter ⚔️

GBPUSD I Its ready for the deeper pullback - COT OverviewHey what up traders welcome to the COT data and Liquidity report. It's always good to go with those who move the market here is what I see in their cards. I share my COT - order flow views every weekend.
🎯 Non Commercials added significant longs and closed shorts at the same time. So for that reason I see the highs as a liquidity for their longs profits taking.
📍Please be aware that institutions report data to the SEC on Tuesdays and data are reported on Fridays - so again we as retail traders have disadvantage, but there is possibility to read between the lines. Remember in the report is what they want you to see, that's why mostly price reverse on Wednesday after the report so their cards are hidden as long as possible. However if the trend is running you can read it and use for your advantage.
💊 Tip
if the level has confluence with the high volume on COT it can be strong support / Resistance.
👍 Hit like if you find this analysis helpful, and don't hesitate to comment with your opinions, charts or any questions.
Analysis done on the Tradenation Charts
Disclosure: I am part of Trade Nation's Influencer program and receive a monthly fee for using their TradingView charts in my analysis.
"Adapt what is useful, reject what is useless, and add what is specifically your own."
— David Perk aka Dave FX Hunter ⚔️

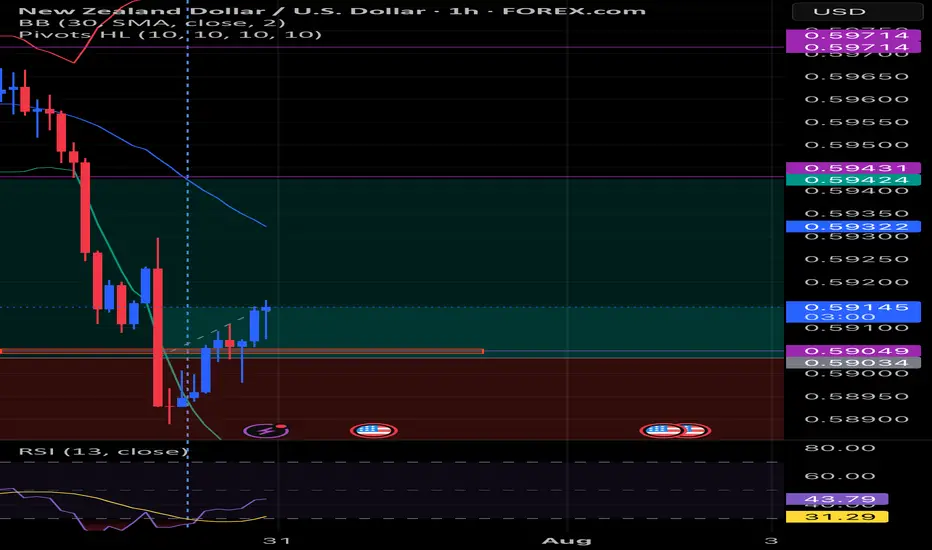
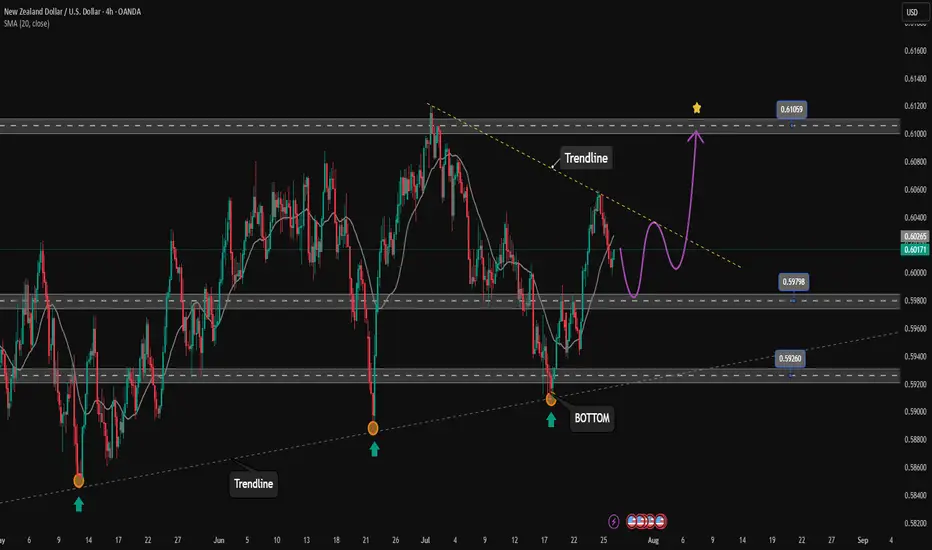
Price is heading towards the upper boundary of the price channel✏️ OANDA:NZDUSD is trading in a bullish wave on H4 chart towards the upper boundary of the ascending price channel. The trendline reaction to the support zone of 0.598 will form a nice corrective wave for the uptrend. If the nearest trendline is broken, the price will soon reach our take profit zone.
📉 Key Levels
Buy trigger: Reject and Trading above 0.598
BUY zone 0.592 ( vùng hỗ trợ biên dưới)
Target: 0.610
Leave your comments on the idea. I am happy to read your views.
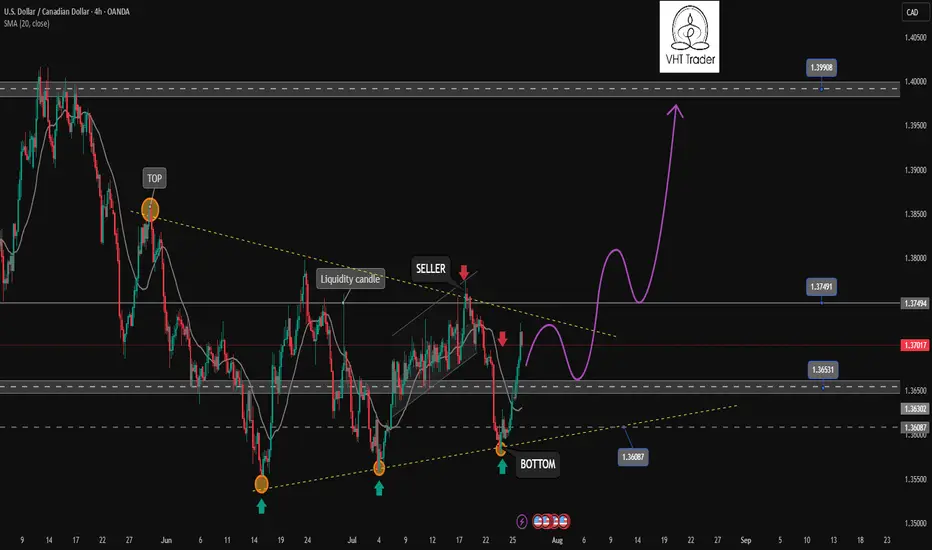
Uptrend is coming. Opportunity for buyers✏️ OANDA:USDCAD is trading close to the upper boundary of the triangle pattern. There is a high possibility that the current bullish momentum will break the upper boundary and form an uptrend for the USDCAD pair. The important price zone for the sellers at the moment is 1.075. If the buyers are strong enough to push the price above 1.075, the sellers will only be really interested in the price zone of 1.340, the high of the pair in May.
📉 Key Levels
Buy trigger: Reject and Trading above 1.365
BUY DCA Break 1.375
Target: 1.400
Leave your comments on the idea. I am happy to read your views.
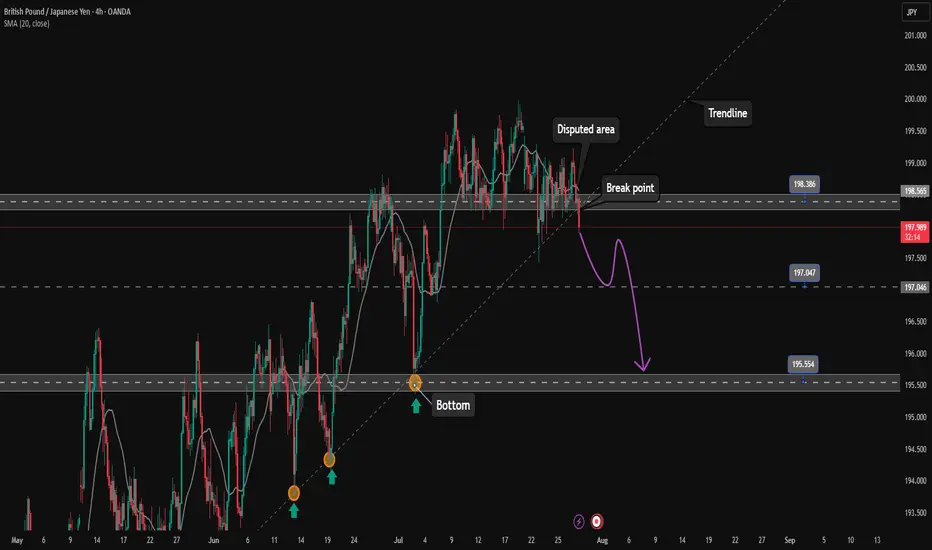
GBPJPY starts corrective downtrend. Ready to SELL✏️ OANDA:GBPJPY has broken the trendline structure and broken the disputed zone. Price is heading towards the support zone ahead around 197.000. This is considered a breakout zone for DCA rather than BUYing at this zone. The downtrend of GBPJPY may extend to the bottom of last week.
📉 Key Levels
SELL now GBPJPY 198.000
SELL trigger: Break support zone 197.000
Target 195.500
Leave your comments on the idea. I am happy to read your views.
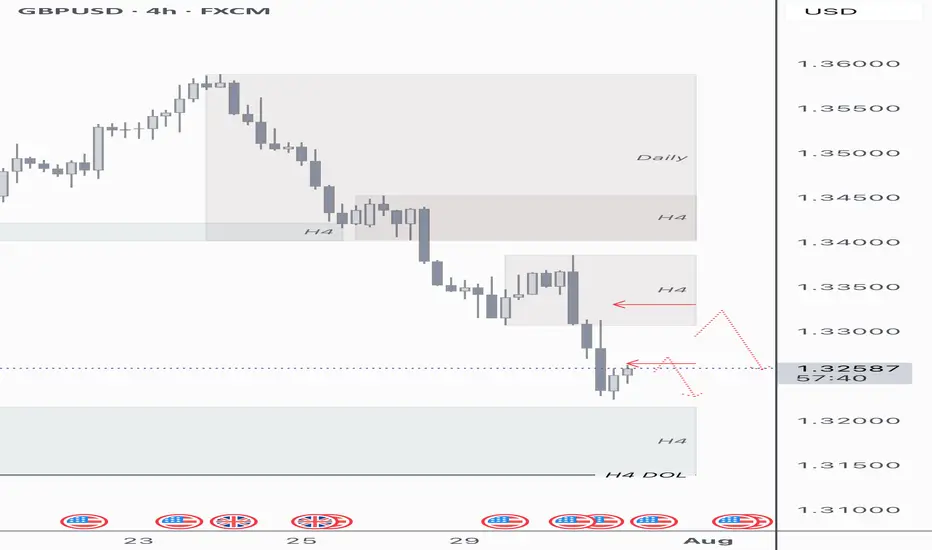
GU 01/08Looking at this current H4 leg trending down, we have levels of H4 supply to come test with some gaps that need filled. We have high impact news incoming, my trading ideas are to follow what I see, we have a H4 demand level from the left which has deeper levels of daily demand with draws of liquidity in the form of lows and equal lows.
My idea is that we clear our H4 imbalance gaps resting within H4 supply and below, hopefully mitigating supply in order to look for continuation shorts into lower demand levels.