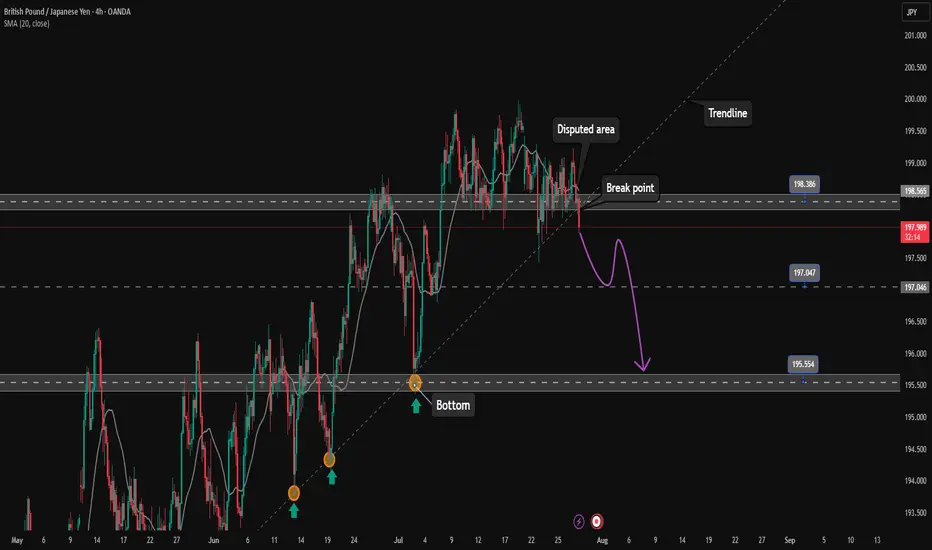
GBPJPY starts corrective downtrend. Ready to SELL✏️ OANDA:GBPJPY has broken the trendline structure and broken the disputed zone. Price is heading towards the support zone ahead around 197.000. This is considered a breakout zone for DCA rather than BUYing at this zone. The downtrend of GBPJPY may extend to the bottom of last week.
📉 Key Levels
SELL now GBPJPY 198.000
SELL trigger: Break support zone 197.000
Target 195.500
Leave your comments on the idea. I am happy to read your views.
Forex market
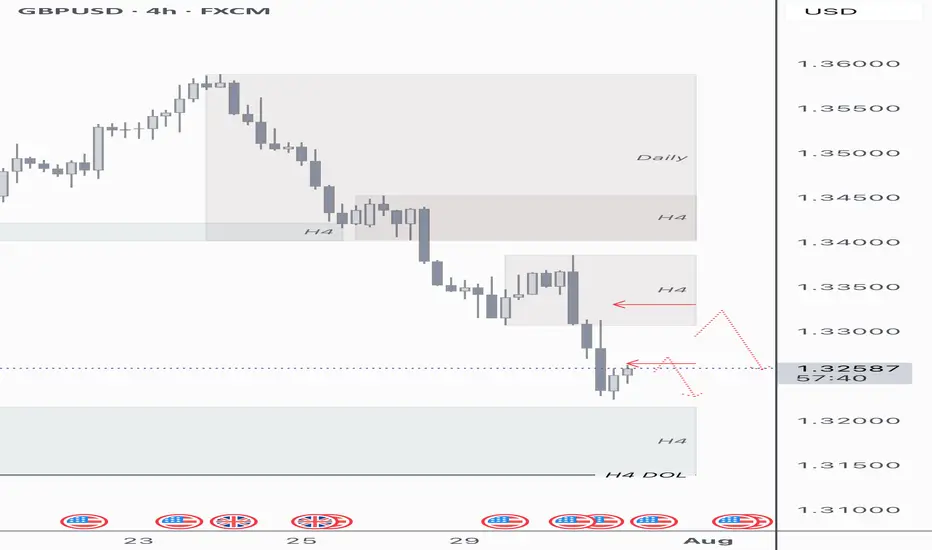
GU 01/08Looking at this current H4 leg trending down, we have levels of H4 supply to come test with some gaps that need filled. We have high impact news incoming, my trading ideas are to follow what I see, we have a H4 demand level from the left which has deeper levels of daily demand with draws of liquidity in the form of lows and equal lows.
My idea is that we clear our H4 imbalance gaps resting within H4 supply and below, hopefully mitigating supply in order to look for continuation shorts into lower demand levels.
USDCAD Triple Bottom? Ready for long run?USDCAD formed a triple bottom on high time frame and is likely to Reach target of 1.4. the third bottom is also formed and is about finish soon the pattern. Enter the trade when the neck is broken or if the price come to 0.5 fib level from this bottom level.

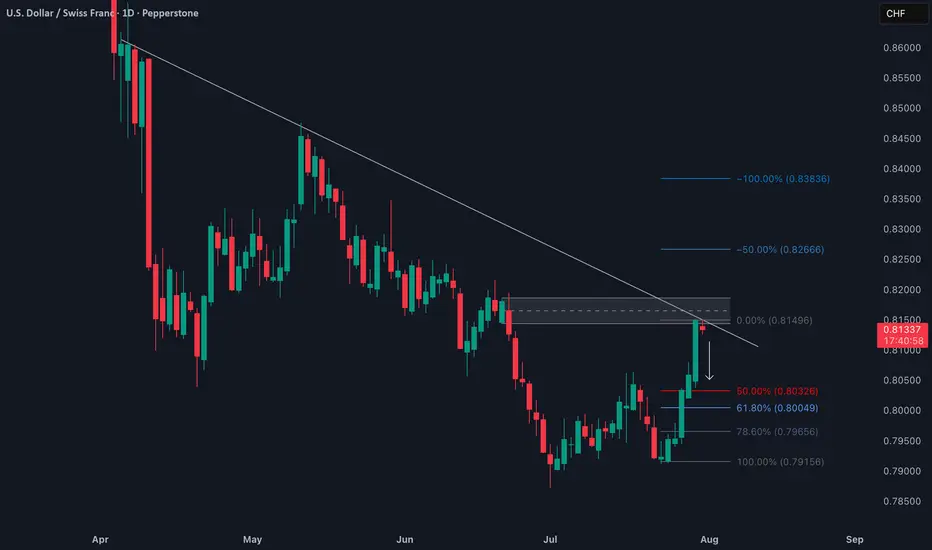
Liquidity Grab Complete? Why USDCHF Could Be Heading South📉 USDCHF remains firmly in a downtrend on both the weekly (1W) and daily (1D) timeframes. The recent bullish retracement is now confronting a critical resistance zone 🔒 — defined by a descending trendline and a daily order block between 0.8150–0.8200.
🧱 Price action at this level shows clear signs of rejection, aligning with a bear flag formation, which could pave the way for continued downside toward the 0.7800–0.7600 region.
📊 Fundamentally, the Swiss Franc (CHF) continues to gain strength, supported by Switzerland’s stable economic outlook and ongoing safe-haven demand. Meanwhile, the US Dollar faces headwinds from dovish Fed expectations and rising political uncertainty in the US 🇺🇸.
🔮 From a Wyckoff/ICT perspective, this upward move appears to be a liquidity grab into a premium zone, with smart money likely distributing positions before initiating a new markdown phase. A sell bias is favored below 0.8200, with downside targets set at 0.8000 and beyond.
📅 Keep a close eye on this week’s US NFP and Swiss CPI releases — both could inject fresh volatility into the pair.
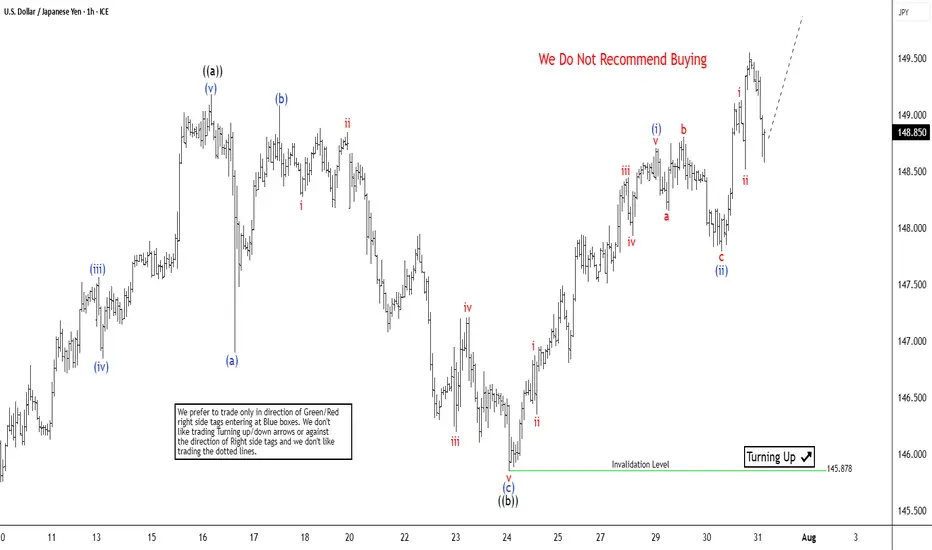
USDJPY Targets Completion of 7 Swing RallyThe USDJPY pair exhibits an incomplete bullish sequence originating from the April 22, 2025 low, signaling potential for further upside. We can project the extreme target area for this rally can be projected using using the 100% to 161.8% Fibonacci extension from the April 22 low. This places the target range between 150.88 and 156.33. The ongoing rally from the May 27, 2025 low is unfolding as a double three Elliott Wave structure. This structure has two zigzag corrective structure driving the upward momentum.
From the May 27 low, wave W concluded at 148.03. A corrective pullback in wave X then followed, which bottomed at 142.67. Currently, wave Y is in progress, with internal subdivision as a zigzag pattern. From the wave X low, wave ((a)) peaked at 149.18, followed by a corrective wave ((b)) that unfolded as a zigzag. Within this structure, wave (a) ended at 147.81 and wave (b) reached 149.08. Wave (c) completed at 145.87, finalizing wave ((b)) in the higher degree. The pair has since resumed its ascent in wave ((c)), developing as a five-wave impulse.
From wave ((b)), wave (i) concluded at 148.71, with a minor pullback in wave (ii) at 147.79. In the near term, as long as the pivot low at 145.87 holds, dips are expected to attract buyers in a 3, 7, or 11-swing corrective pattern, supporting further upside toward the Fibonacci extension targets.
EURJPY 300+ PIP DROPFrom the beginning of the week i have called out shorts on EJ into 170.000 in the video we can see price hit that support and hitting target for a few positions and entry i called out during the week and also some key points for your personal trading

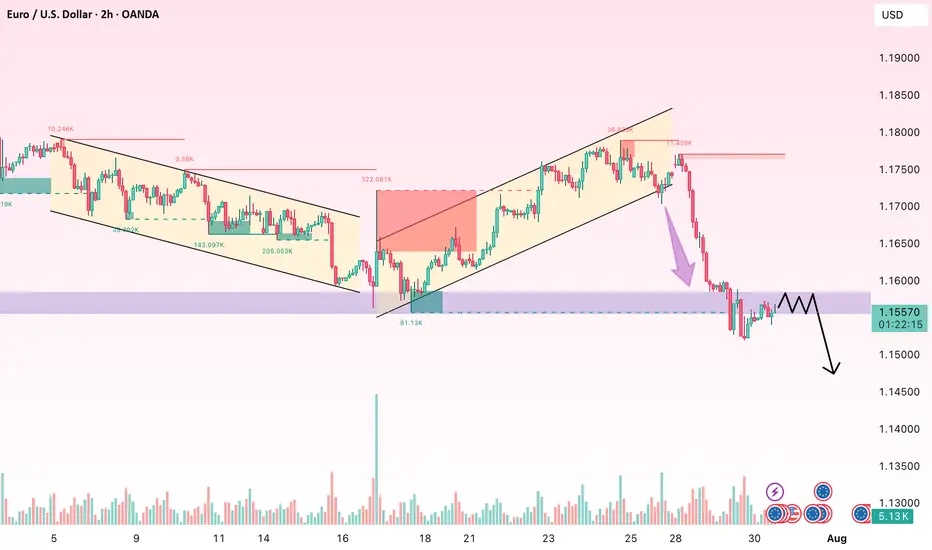
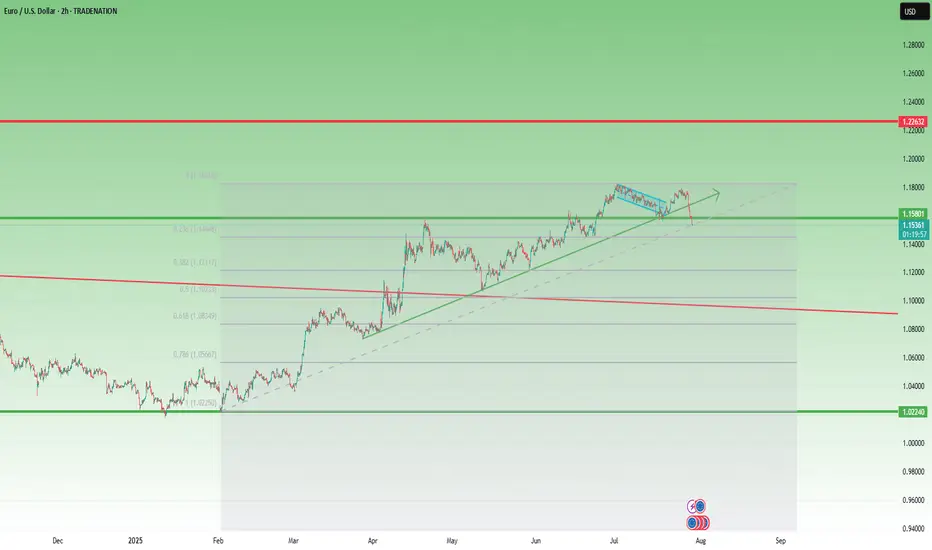
Closed Longs, Now Selling Rallies on EURUSD ReversalAs mentioned in my previous posts, I’m been bullish on EURUSD in the medium term, targeting 1.20 and even beyond.
But no pair—especially not EURUSD, which tends to move more steadily and rationally—goes up in a straight line.
________________________________________
🔹 Last week, the pair stalled just below 1.18, and I decided to close my long trade with a +150 pip gain. That proved to be a wise call, as price dropped hard shortly after.
________________________________________
📉 What’s happening now?
• EURUSD has broken below the rising trendline
• More importantly, it’s broken below the neckline of a double top pattern
• Now trading around 1.1535
This opens the door for a deeper correction, and I expect we could see a test of the 1.1150–1.1100 zone by the end of summer.
________________________________________
📌 Trading Plan:
• I’m now in sell-the-rally mode
• Ideal short entry: around 1.1650, where we also get a favorable 1:3+ risk-reward
• Watch also for interim support around 1.1400
________________________________________
Conclusion:
The bigger picture remains bullish— but this correction looks healthy and isn’t done yet.
Selling rallies makes more sense now, until the structure tells us otherwise.
Disclosure: I am part of TradeNation's Influencer program and receive a monthly fee for using their TradingView charts in my analyses and educational articles.
GBP/USD 4H Chart Analysis (Bearish Flag) Read the caption📉 GBP/USD 4H Chart Analysis
Pattern Identified: Bearish Flag Pattern
Timeframe: 4-Hour (4H)
Currency Pair: GBP/USD
🔍 Chart Explanation:
This chart illustrates a classic Bearish Flag Pattern, which is a continuation pattern signaling a potential further decline in price after a temporary consolidation.
Downtrend Leg (Flagpole):
The strong and sharp bearish move on the left side of the chart forms the flagpole, indicating aggressive selling pressure.
Consolidation (Flag Formation):
Price enters a rising channel (the flag) which reflects a short-term corrective phase or pullback. This consolidation occurs within the Resistance Zone, suggesting weakening bullish momentum.
Resistance Zone:
Marked in blue, this zone is where the price struggled to break above, and it acts as a ceiling. Rejection from this zone confirms bearish pressure and increases the likelihood of a breakdown.
Breakdown & Target Levels:
The chart shows that price has broken out downward from the flag pattern, triggering a continuation of the prior downtrend.
Two important support levels are highlighted:
🔸 1st Support: 1.33449 – This is the immediate target where price may pause or react.
🔸 2nd Support: 1.32408 – This is the extended target if selling pressure continues.
Ichimoku Cloud (Background):
The cloud behind the price action represents market sentiment. The red cloud suggests a bearish bias aligning with the flag pattern breakdown.
🧠 Technical Summary:
This setup favors a sell-side outlook. The rejection from resistance within a bearish flag and subsequent breakdown confirm bearish momentum. Traders may look for selling opportunities below the flag breakdown with targets at the mentioned support zones.

AUDCAD POTENTIAL BUY OPPORTUNITY Price currently trades at 0.89166 in today’s trading session I’m looking forward to buying AUDCAD From the current market price with my stop loss situated at 0.88806 and take profit at 0.90227

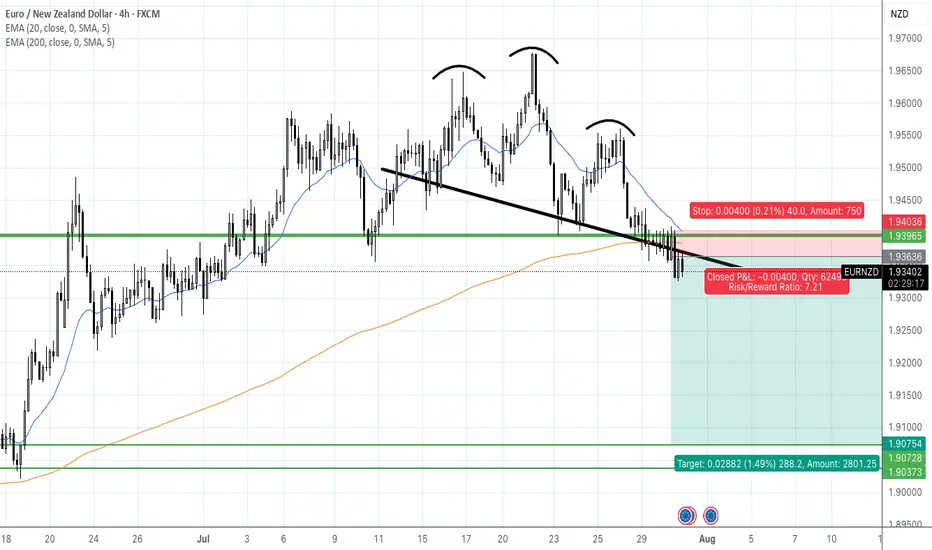
EURNZD SHORTSEURNZD has made a H&S Pattern on the Daily TF which is an indication of reversal. With EUR strength declining as of recent this could increase the likelihood of a selloff.
AU ASIA SESSIONI'm currently watching the sell-side liquidity to see if price makes a move in that direction. Given the current structure and momentum, this setup looks like a relatively low-risk opportunity heading into the Asia session. It’s not a guaranteed play, but the risk-to-reward looks favorable if we get confirmation. Let me know what you think about this one — always keen to hear a second perspective.
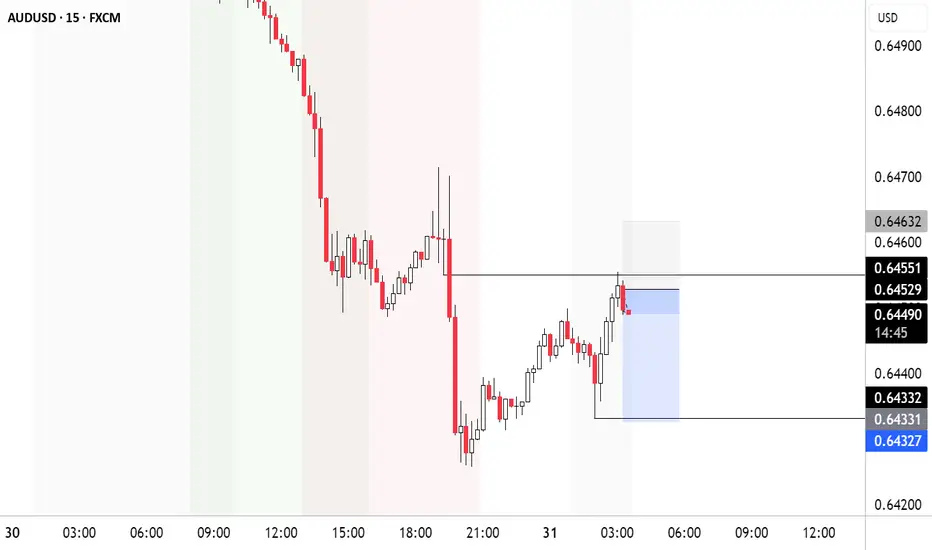

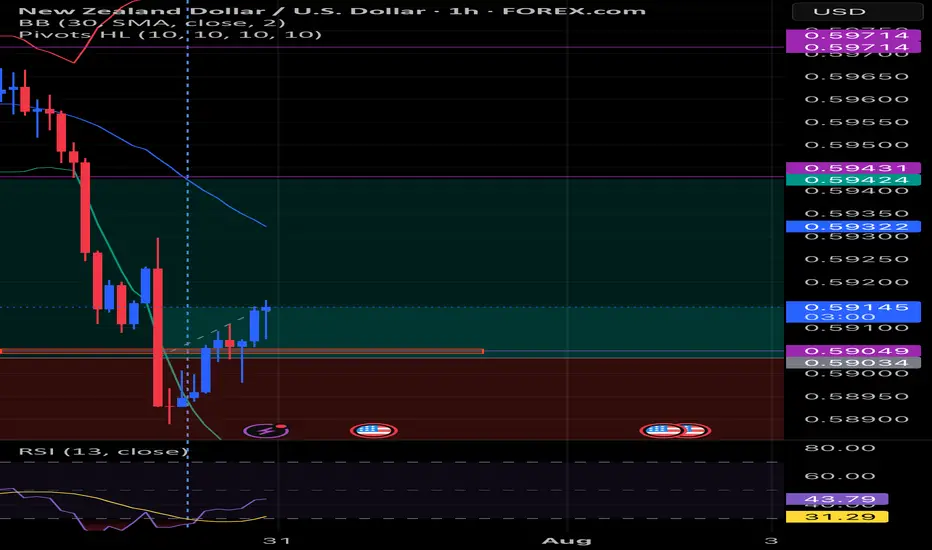
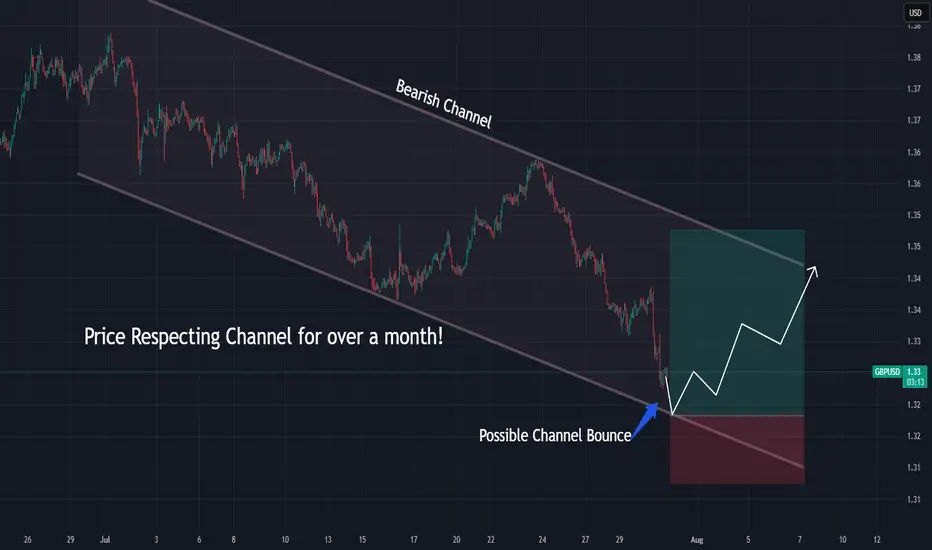
GBPUSD Approaching Channel Support — Rebound Ahead?GBPUSD is nearing the bottom of a well-defined bearish channel while Stoch RSI begins to curl upward.
📌 Bearish channel structure intact
📌 Possible bounce off ~$1.322 zone
⏱️ Timeframe: 1H
#gbpusd #forex #tradingstrategy #channeltrading #technicalanalysis #quanttradingpro #tradingview
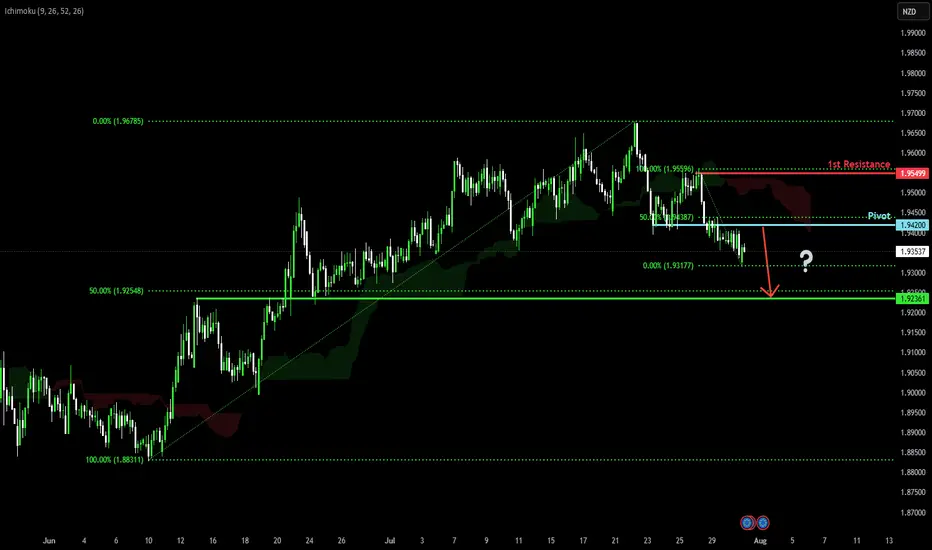
Potential bearish drop?EUR/NZD has rejected off the pivot and could drop to the overlap support.
Pivot: 1.94200
1st Support: 1.92361
1st Resistance: 1.95499
Risk Warning:
Trading Forex and CFDs carries a high level of risk to your capital and you should only trade with money you can afford to lose. Trading Forex and CFDs may not be suitable for all investors, so please ensure that you fully understand the risks involved and seek independent advice if necessary.
Disclaimer:
The above opinions given constitute general market commentary, and do not constitute the opinion or advice of IC Markets or any form of personal or investment advice.
Any opinions, news, research, analyses, prices, other information, or links to third-party sites contained on this website are provided on an "as-is" basis, are intended only to be informative, is not an advice nor a recommendation, nor research, or a record of our trading prices, or an offer of, or solicitation for a transaction in any financial instrument and thus should not be treated as such. The information provided does not involve any specific investment objectives, financial situation and needs of any specific person who may receive it. Please be aware, that past performance is not a reliable indicator of future performance and/or results. Past Performance or Forward-looking scenarios based upon the reasonable beliefs of the third-party provider are not a guarantee of future performance. Actual results may differ materially from those anticipated in forward-looking or past performance statements. IC Markets makes no representation or warranty and assumes no liability as to the accuracy or completeness of the information provided, nor any loss arising from any investment based on a recommendation, forecast or any information supplied by any third-party.
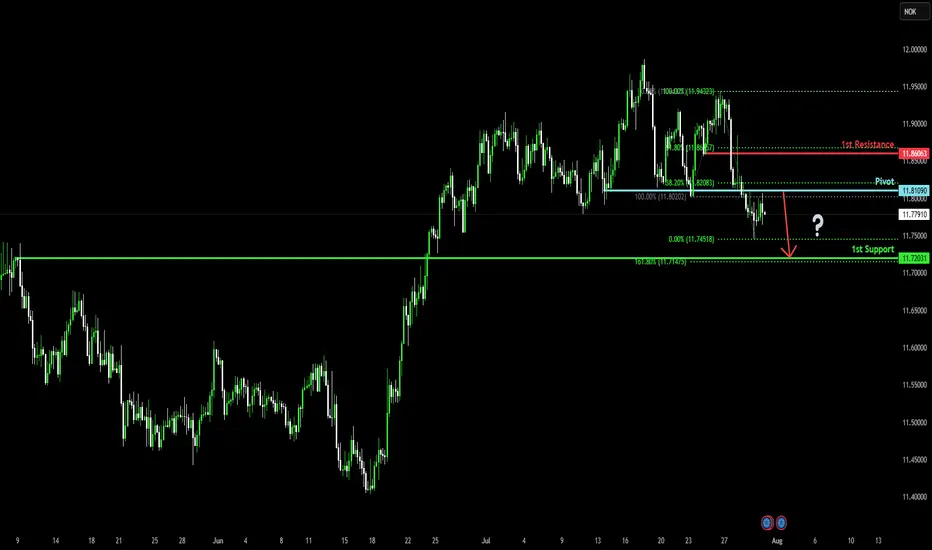
Bearish drop?EUR/NOK has rejected off the pivot, which acts as a pullback resistance, and could drop to the 1st support, which is a pullback support that lines up with the 161.8% Fibonacci extension.
Pivot: 11.81090
1st Support: 11.72031
1st Resistance: 11.86063
Risk Warning:
Trading Forex and CFDs carries a high level of risk to your capital and you should only trade with money you can afford to lose. Trading Forex and CFDs may not be suitable for all investors, so please ensure that you fully understand the risks involved and seek independent advice if necessary.
Disclaimer:
The above opinions given constitute general market commentary, and do not constitute the opinion or advice of IC Markets or any form of personal or investment advice.
Any opinions, news, research, analyses, prices, other information, or links to third-party sites contained on this website are provided on an "as-is" basis, are intended only to be informative, is not an advice nor a recommendation, nor research, or a record of our trading prices, or an offer of, or solicitation for a transaction in any financial instrument and thus should not be treated as such. The information provided does not involve any specific investment objectives, financial situation and needs of any specific person who may receive it. Please be aware, that past performance is not a reliable indicator of future performance and/or results. Past Performance or Forward-looking scenarios based upon the reasonable beliefs of the third-party provider are not a guarantee of future performance. Actual results may differ materially from those anticipated in forward-looking or past performance statements. IC Markets makes no representation or warranty and assumes no liability as to the accuracy or completeness of the information provided, nor any loss arising from any investment based on a recommendation, forecast or any information supplied by any third-party.
EURUSD H4 | Bearish reversal off overlap resistanceThe Fiber (EUR/USD) is rising towards the sell entry, which is an overlap resistance and could drop lower.
Sell entry is at 1.1452, which is an overlap resistance.
Stop loss is at 1.1536, which is a pullback resistance that lines up with the 38.2% Fibonacci retracement.
Take profit is at 1.1323, which is a pullback support that is slightly below the 78.6% Fibonacci retracement.
High Risk Investment Warning
Trading Forex/CFDs on margin carries a high level of risk and may not be suitable for all investors. Leverage can work against you.
Stratos Markets Limited (tradu.com ):
CFDs are complex instruments and come with a high risk of losing money rapidly due to leverage. 65% of retail investor accounts lose money when trading CFDs with this provider. You should consider whether you understand how CFDs work and whether you can afford to take the high risk of losing your money.
Stratos Europe Ltd (tradu.com ):
CFDs are complex instruments and come with a high risk of losing money rapidly due to leverage. 66% of retail investor accounts lose money when trading CFDs with this provider. You should consider whether you understand how CFDs work and whether you can afford to take the high risk of losing your money.
Stratos Global LLC (tradu.com ):
Losses can exceed deposits.
Please be advised that the information presented on TradingView is provided to Tradu (‘Company’, ‘we’) by a third-party provider (‘TFA Global Pte Ltd’). Please be reminded that you are solely responsible for the trading decisions on your account. There is a very high degree of risk involved in trading. Any information and/or content is intended entirely for research, educational and informational purposes only and does not constitute investment or consultation advice or investment strategy. The information is not tailored to the investment needs of any specific person and therefore does not involve a consideration of any of the investment objectives, financial situation or needs of any viewer that may receive it. Kindly also note that past performance is not a reliable indicator of future results. Actual results may differ materially from those anticipated in forward-looking or past performance statements. We assume no liability as to the accuracy or completeness of any of the information and/or content provided herein and the Company cannot be held responsible for any omission, mistake nor for any loss or damage including without limitation to any loss of profit which may arise from reliance on any information supplied by TFA Global Pte Ltd.
The speaker(s) is neither an employee, agent nor representative of Tradu and is therefore acting independently. The opinions given are their own, constitute general market commentary, and do not constitute the opinion or advice of Tradu or any form of personal or investment advice. Tradu neither endorses nor guarantees offerings of third-party speakers, nor is Tradu responsible for the content, veracity or opinions of third-party speakers, presenters or participants.

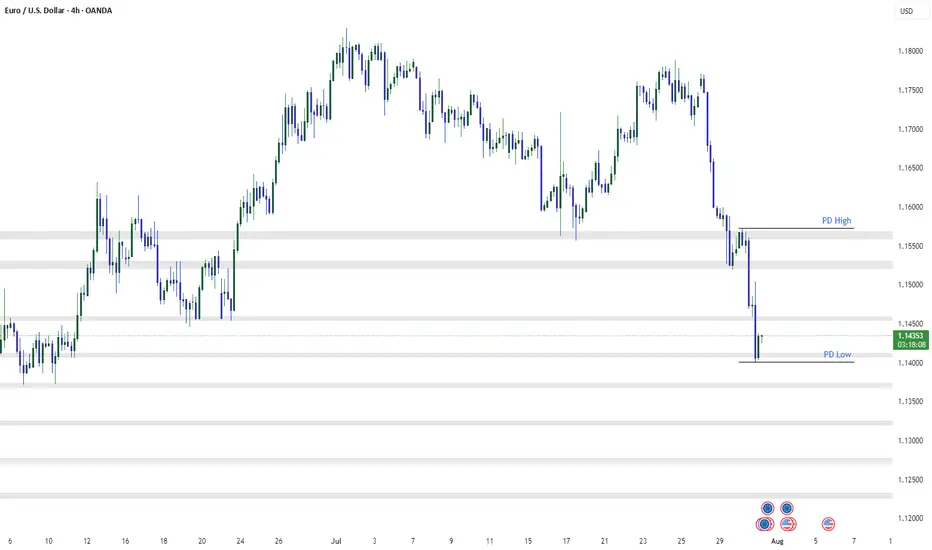
EURUSD 4H AnalysisAfter a strong bearish move, EURUSD has now tapped into the PD Low and shown a reaction. Structure remains bearish, but current price action near 1.1400 could lead to short-term retracement.
🔍 Key Levels:
PD High – 1.1560: Strong supply zone, key bearish continuation level
1.1500–1.1450: Broken support, may now act as resistance
PD Low – 1.1400: Demand zone, current price reacting from here
📌 Potential Scenarios:
Short-Term Bounce from PD Low:
Price reacting from 1.1400 demand.
Intraday retracement toward 1.1470–1.1500 possible.
Watch for bullish price action confirmation on lower timeframes.
Bearish Continuation if price retests 1.1500–1.1550:
Ideal area to look for fresh shorts.
Continuation move could target 1.1350 or lower.
🎯 Bias: Still bearish unless we break and hold above 1.1560 (PD High).
Patience is key. Let price test zone and wait for clear reaction before committing.
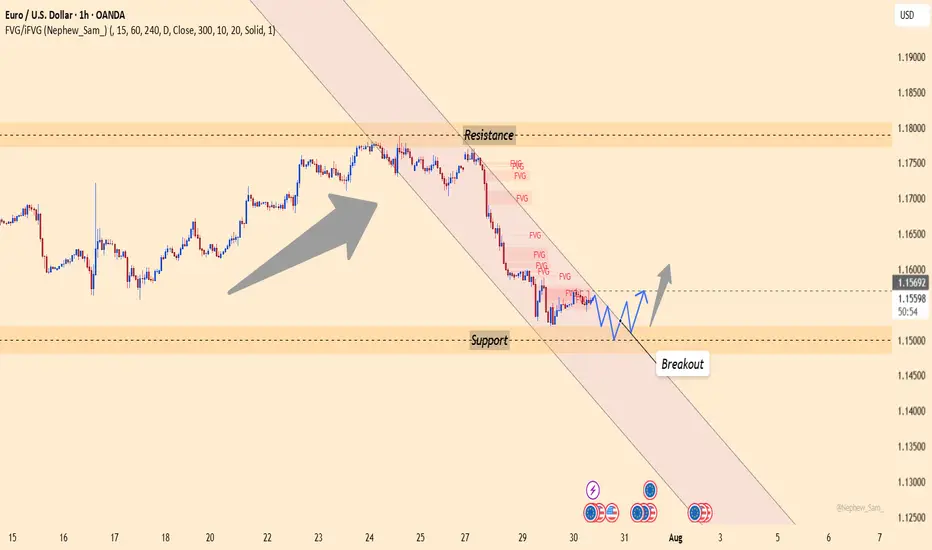
EURUSD – German GDP boosts EUR, but USD still holds the reins Germany’s recently released GDP data exceeded expectations, acting as a catalyst for EURUSD to rebound after a steep decline. However, this upward move remains fragile, as the USD continues to dominate the market—especially with several key U.S. economic reports set to be released later this week.
On the chart, EURUSD has just bounced from the 1.15000 support zone, which has historically served as a strong floor. If the price holds above this level and breaks the downtrend line, the short-term target could move toward the 1.15700 resistance zone.
Still, the path ahead won’t be easy. The market is closely watching upcoming U.S. data, such as the jobs report and the Core PCE index—the Fed’s preferred inflation gauge. If these figures come in strong, the USD could regain strength and put pressure back on EURUSD.
AUDUSD - Possible retracement/reversal to hourly 50 MA AUDUSD is making 5 week lows and is due for a retracement or possible reversal in a downtrend to a major Moving Average. Despite news of lowered interest rates reducing it's appeal, the market has likely already discounted it's lack of appeal into the recent decline.
Await confirmation of break of recent trendline as, given it's poor performance it could fall on lack of confidence to a major previous support level.

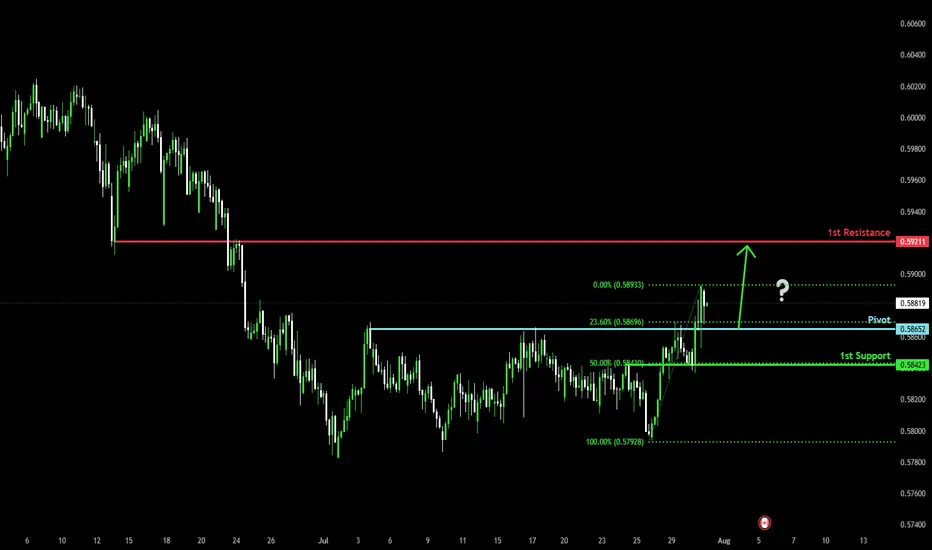
Bullish bounce off pullback support?CAD/CHF is falling towards the pivot, which acts as a pullback support and could bounce to the 1st resistance, which is also a pullback resistance.
Pivot: 0.58652
1st Support: 0.58423
1st Resistance: 0.59211
Risk Warning:
Trading Forex and CFDs carries a high level of risk to your capital and you should only trade with money you can afford to lose. Trading Forex and CFDs may not be suitable for all investors, so please ensure that you fully understand the risks involved and seek independent advice if necessary.
Disclaimer:
The above opinions given constitute general market commentary, and do not constitute the opinion or advice of IC Markets or any form of personal or investment advice.
Any opinions, news, research, analyses, prices, other information, or links to third-party sites contained on this website are provided on an "as-is" basis, are intended only to be informative, is not an advice nor a recommendation, nor research, or a record of our trading prices, or an offer of, or solicitation for a transaction in any financial instrument and thus should not be treated as such. The information provided does not involve any specific investment objectives, financial situation and needs of any specific person who may receive it. Please be aware, that past performance is not a reliable indicator of future performance and/or results. Past Performance or Forward-looking scenarios based upon the reasonable beliefs of the third-party provider are not a guarantee of future performance. Actual results may differ materially from those anticipated in forward-looking or past performance statements. IC Markets makes no representation or warranty and assumes no liability as to the accuracy or completeness of the information provided, nor any loss arising from any investment based on a recommendation, forecast or any information supplied by any third-party.
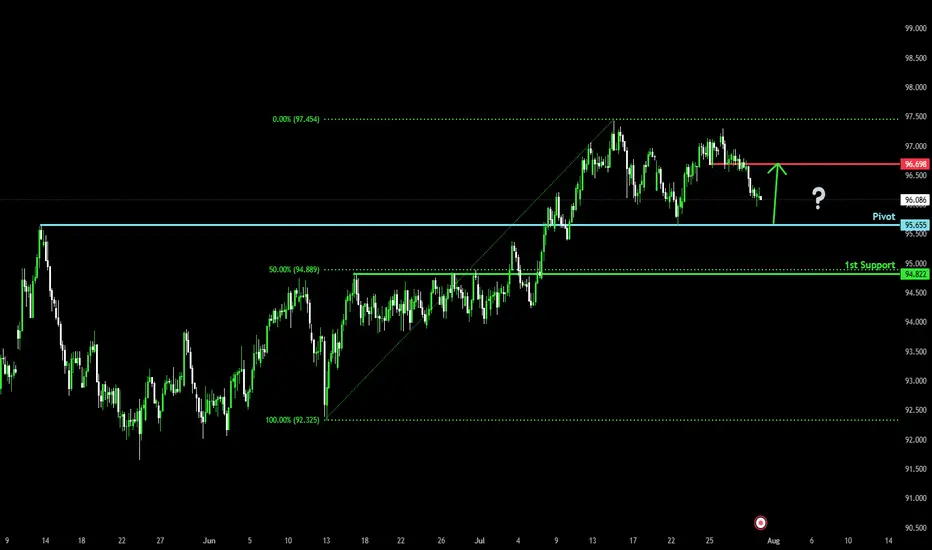
Falling towards overlap support?AUD/JPY is falling towards the pivot, which has been identified as an overlap support and could bounce to the 1st resistance.
Pivot: 95.65
1st Support: 94.82
1st Resistance: 96.69
Risk Warning:
Trading Forex and CFDs carries a high level of risk to your capital and you should only trade with money you can afford to lose. Trading Forex and CFDs may not be suitable for all investors, so please ensure that you fully understand the risks involved and seek independent advice if necessary.
Disclaimer:
The above opinions given constitute general market commentary, and do not constitute the opinion or advice of IC Markets or any form of personal or investment advice.
Any opinions, news, research, analyses, prices, other information, or links to third-party sites contained on this website are provided on an "as-is" basis, are intended only to be informative, is not an advice nor a recommendation, nor research, or a record of our trading prices, or an offer of, or solicitation for a transaction in any financial instrument and thus should not be treated as such. The information provided does not involve any specific investment objectives, financial situation and needs of any specific person who may receive it. Please be aware, that past performance is not a reliable indicator of future performance and/or results. Past Performance or Forward-looking scenarios based upon the reasonable beliefs of the third-party provider are not a guarantee of future performance. Actual results may differ materially from those anticipated in forward-looking or past performance statements. IC Markets makes no representation or warranty and assumes no liability as to the accuracy or completeness of the information provided, nor any loss arising from any investment based on a recommendation, forecast or any information supplied by any third-party.
EUR/USD: A Fragile Rebound Within a Broader Bearish TrapEUR/USD has managed to stage a slight recovery after plunging through the key 1.1680 support — a level that had held firm for two weeks. The pair is now hovering just above 1.1500, but the bounce appears shallow and unconvincing. Volume remains low, momentum indicators offer little confirmation, and the broader structure still points to a prevailing downtrend.
On the H2 chart, price has rebounded from the 1.1505 area — a minor support formed during July's short-term consolidation. Yet, the EMA slope remains strongly negative, and RSI is struggling below the neutral 50 mark after exiting oversold territory. The structure continues to display classic lower highs and lower lows, with the 1.1585–1.1600 zone emerging as a potential resistance area for bears to re-enter.
From a macro perspective, the U.S. dollar remains supported by expectations that the Fed will maintain a hawkish stance, fueled by solid GDP, durable goods, and PCE data. In contrast, the Eurozone struggles with signs of stagnation, with both services and manufacturing PMIs deteriorating — most notably in Germany. This policy divergence continues to favor the greenback.
Unless bulls manage to decisively reclaim the 1.1600 zone with strong follow-through buying, any rebound risks being nothing more than a dead cat bounce. The downside target remains near 1.1460 – 1.1440 in the near term.