Short idea!Hey all. as you see market returned from middle of no-where and the response will be right at the LOZ. it is sort of risky because the LOZ candle covered by the next candle. It makes the Zone less efficient but it is still powerful. be happy (wink)
Forex market

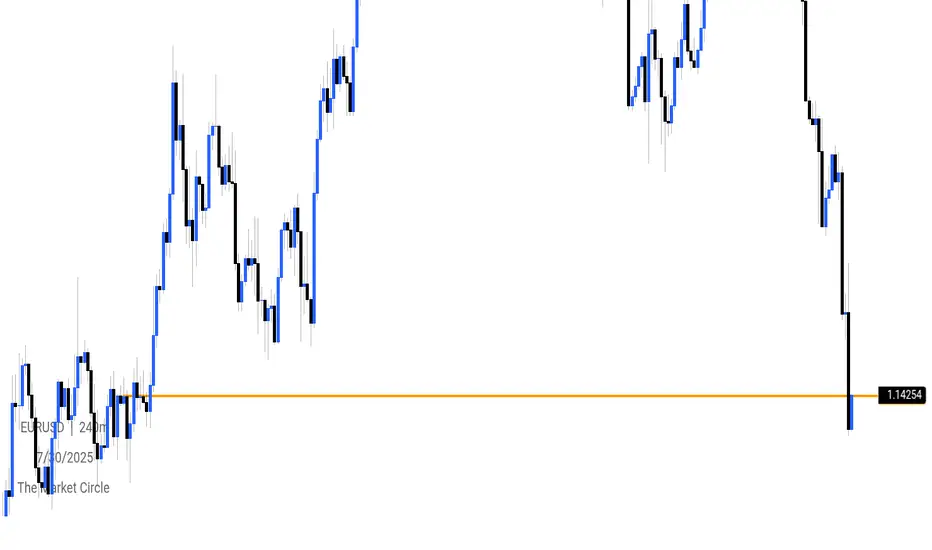
EURUSD BUY SET UPI'm looking to go long on EURUSD if price pulls back to the 1.14249 level — a key zone of interest backed by previous market structure.
🔹 Entry: Buy Limit @ 1.14249
🔹 Rationale:
Previous support/resistance flip
Confluence with market structure
Clean retracement zone with potential bullish reaction
📉 No impulse buying — I’m letting price come to me.
📊 Chart attached for visual clarity.
Trade safe. Plan your trade, and trade your plan.

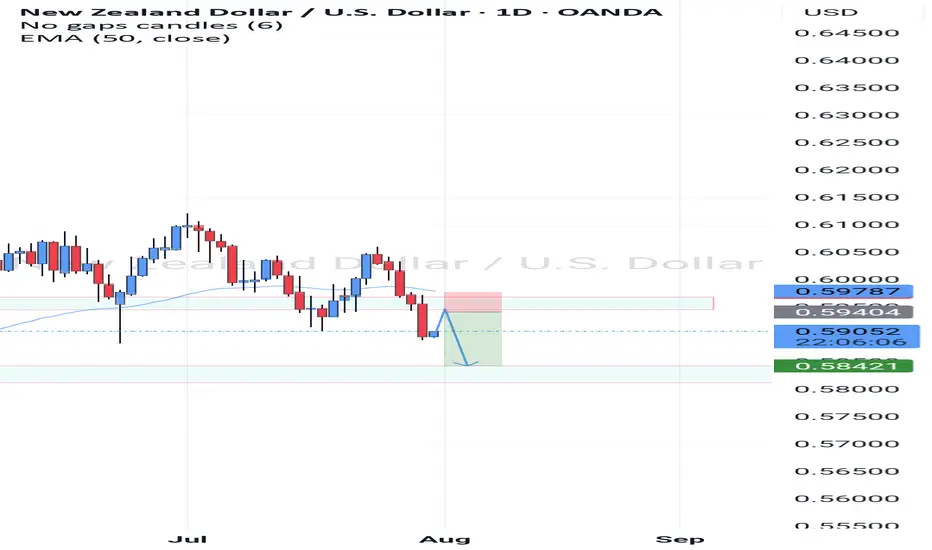
Nzdusd We are expecting price to go back to the resistance zone , we hv a head and shoulder pattern on the daily time frame so we are expecting a retracment to the neck line then we sell
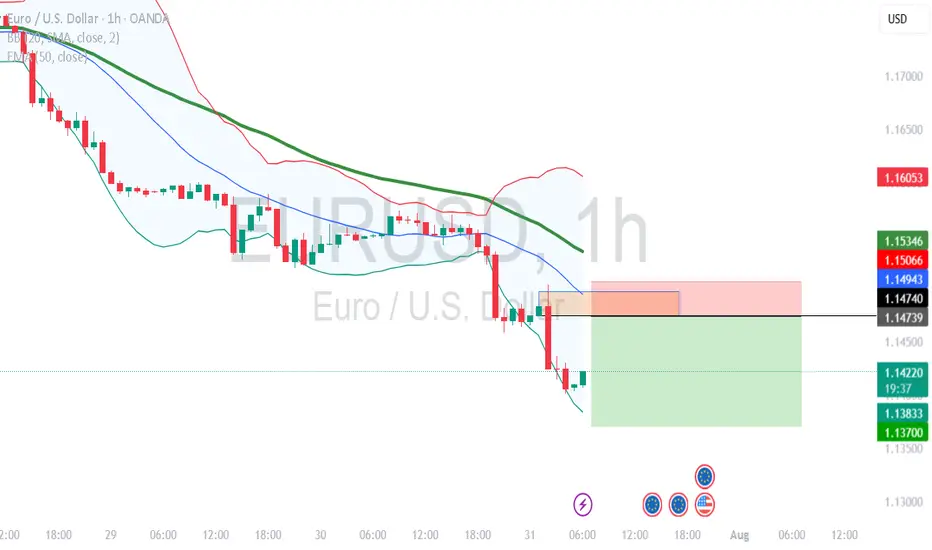
EURUSD Bear dominating the market30th June Daily candle closed with strong bearish.
we could observed a drop-base-drop candle pattern in a lower time frame.
for today plan:-
i will wait at the "base" area around 1.147*** area for the bearish signal.
calculate your own risk & reward.
Good luck
Eurusd
---
### 💥 The Hidden Secret of Pro Traders:
Most traders jump straight into low timeframes like M15 or H1, chasing signals...
But the market's real moves? They start on the **higher timeframes** like weekly or Daily. 🤯
👉 **Golden Formula:**
- 🧭 **Higher Timeframe = Direction**
(Is the market trending up, down, or just ranging?)
- ⏱️ **Lower Timeframe = Precise Entry**
(When to get in? Where to place stops?)
Trading without the higher timeframe is like driving without a map. Sure, you're moving—but do you know *where you're going*?
---
### 📌 Quick Breakdown:
- Start on **2D or Daily** charts to define:
- Strong support/resistance zones
- Overall market structure
- Clear chart patterns
Then drop into **lower timeframes** (like H1 or M15):
This is where sniper entries and clean risk/reward setups live.
Pro Tip:
> "Your trading plan starts at the top... and finds its perfect shot at the bottom."
Be the sniper, not the spray-and-pray trader.
---
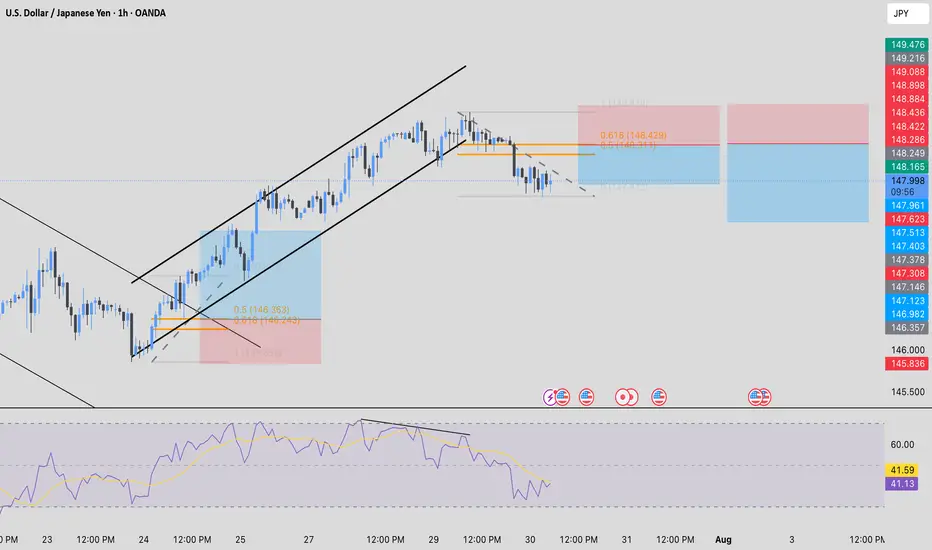
USD/JPY - Bearish Idea on H1USD / JPY sell idea on H1.
Price broke out of the ascending channel after a divergence was formed.
Price also starting making Lower Lows & Lower Highs.
We will wait for the price to retrace back to the 0.5 - 0.618 Fib retracement to take the entry.
Stop loss above the last high formed
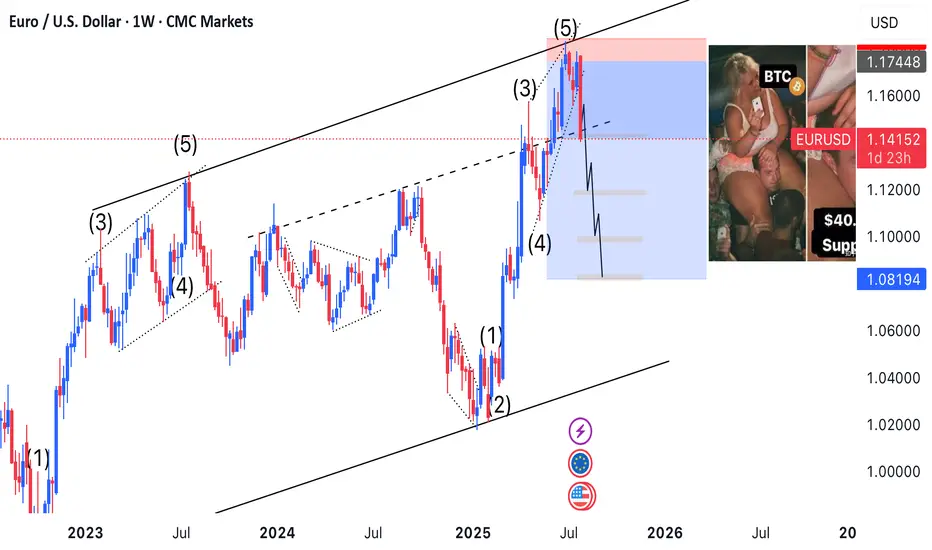
EURUSD Wave Analysis – 30 July 2025- EURUSD falling inside accelerated impulse wave c
- Likely fall to support level 1.1200
EURUSD currency pair recently broke the support trendline from February, coinciding with the 38.2% Fibonacci correction of the upward impulse 1 from May.
The breakout of these support levels accelerated the active impulse wave c, which then broke the support at 1.1460.
EURUSD currency pair can be expected to fall further to the next support level 1.1200 (former strong support from May).

EURJPY Wave Analysis – 30 July 2025
- EURJPY reversed from the resistance zone
- Likely fall to support level 169.60
EURJPY currency pair recently reversed down from the resistance zone between the resistance level 174.00, the upper daily Bollinger Band and the resistance trendline of the daily up channel from February.
The downward reversal from this resistance zone created the daily Japanese candlesticks reversal pattern, Bearish Engulfing.
EURJPY currency pair can be expected to fall further to the next round support level 169.60 (former resistance from the end of June).

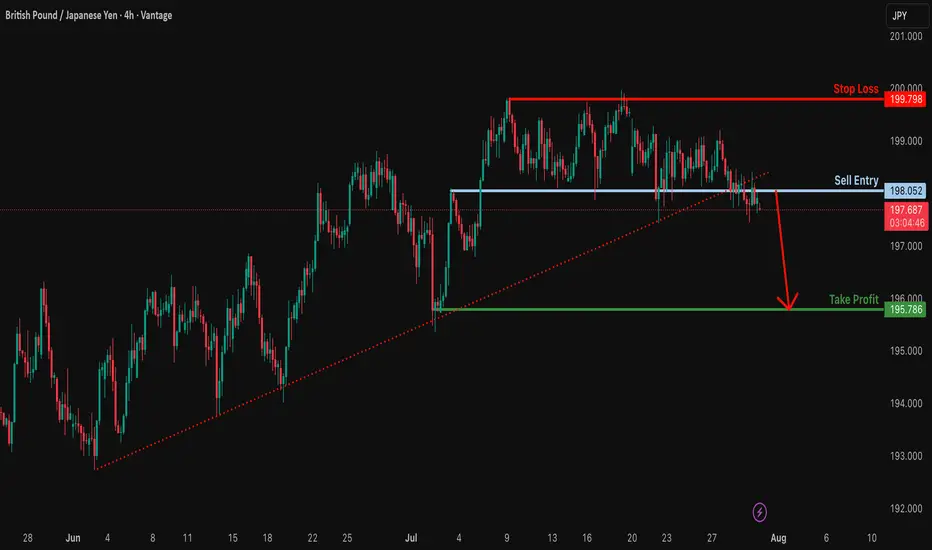
Potential bearish drop?GBP/JPY is reacting off the resitance level which is anoverlap resistance and could drop from this level to our takeprofit.
Entry: 198.05
Why we like it:
There is anoverlap support.
Stop loss: 199.79
Why we like it:
There is a multi swing high resistance.
Take profit: 195.78
Why we like it:
There is a swing low support.
Enjoying your TradingView experience? Review us!
Please be advised that the information presented on TradingView is provided to Vantage (‘Vantage Global Limited’, ‘we’) by a third-party provider (‘Everest Fortune Group’). Please be reminded that you are solely responsible for the trading decisions on your account. There is a very high degree of risk involved in trading. Any information and/or content is intended entirely for research, educational and informational purposes only and does not constitute investment or consultation advice or investment strategy. The information is not tailored to the investment needs of any specific person and therefore does not involve a consideration of any of the investment objectives, financial situation or needs of any viewer that may receive it. Kindly also note that past performance is not a reliable indicator of future results. Actual results may differ materially from those anticipated in forward-looking or past performance statements. We assume no liability as to the accuracy or completeness of any of the information and/or content provided herein and the Company cannot be held responsible for any omission, mistake nor for any loss or damage including without limitation to any loss of profit which may arise from reliance on any information supplied by Everest Fortune Group.
USDJPY (daily + Monthly analysis)hi everyone happy trading as always hope this video finds you some value.

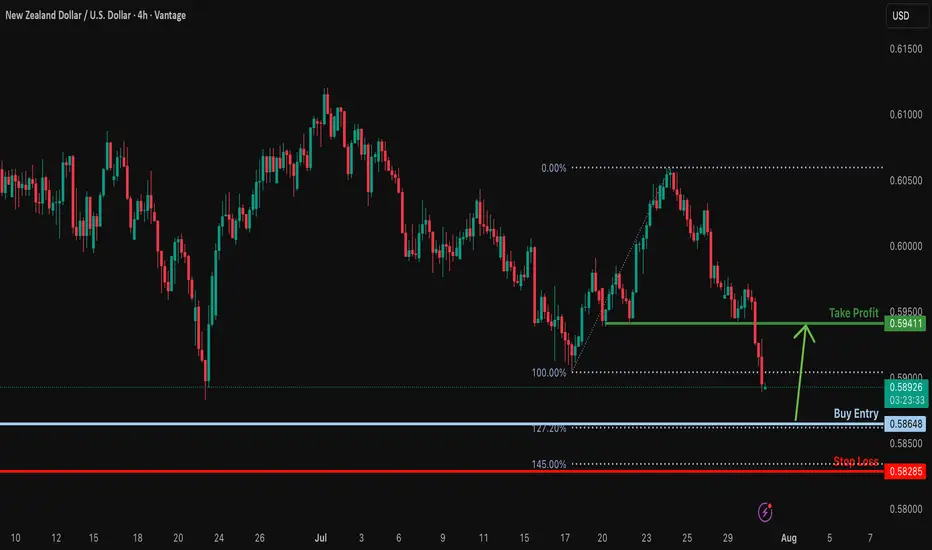
Bullish reversal?NZD/USD is falling towards the support level, which is a swing low support that lines up with the 127.2% Fibonacci extension. Could NZD/USD bounce from this level to our take profit?
Entry: 0.5864
Why we like it:
There is a swing low support that lines up with the 127.2% Fibonacci extension.
Stop loss: 0.5828
Why we like it:
There is a pullback support that lines up with the 145% Fibonacci extension.
Takeprofit: 0.5941
Why we like it:
There is a pullback resistance level.
Enjoying your TradingView experience? Review us!
Please be advised that the information presented on TradingView is provided to Vantage (‘Vantage Global Limited’, ‘we’) by a third-party provider (‘Everest Fortune Group’). Please be reminded that you are solely responsible for the trading decisions on your account. There is a very high degree of risk involved in trading. Any information and/or content is intended entirely for research, educational and informational purposes only and does not constitute investment or consultation advice or investment strategy. The information is not tailored to the investment needs of any specific person and therefore does not involve a consideration of any of the investment objectives, financial situation or needs of any viewer that may receive it. Kindly also note that past performance is not a reliable indicator of future results. Actual results may differ materially from those anticipated in forward-looking or past performance statements. We assume no liability as to the accuracy or completeness of any of the information and/or content provided herein and the Company cannot be held responsible for any omission, mistake nor for any loss or damage including without limitation to any loss of profit which may arise from reliance on any information supplied by Everest Fortune Group.
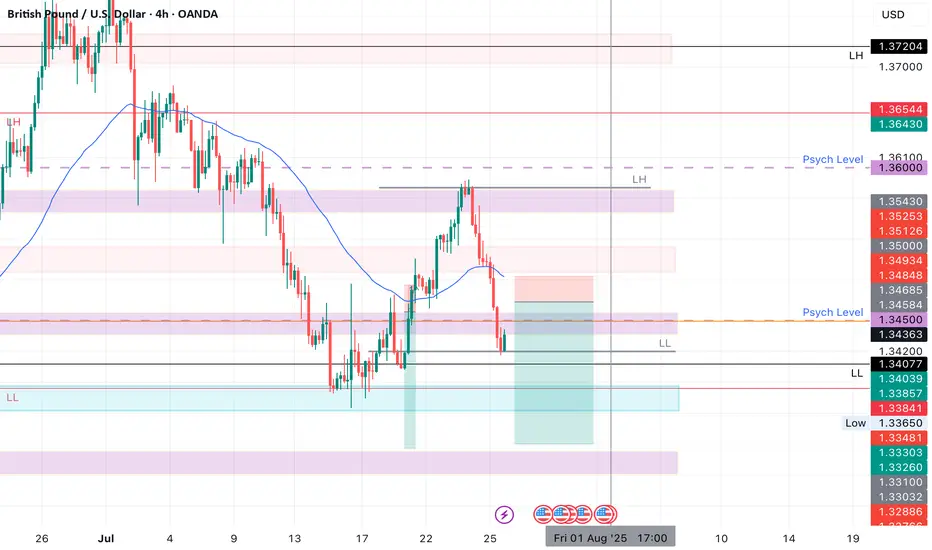
GBPUSD SHORTsMarket structure bearish on HTFs 3
Entry at both Weekly and Daily AOi
Weekly rejection at AOi
Previous Weekly Structure Point
Daily Rejection At AOi
Daily EMA retest
Around Psychological Level 1.34500
H4 EMA retest
H4 Candlestick rejection
Levels 5.55
Entry 105%
REMEMBER : Trading is a Game Of Probability
: Manage Your Risk
: Be Patient
: Every Moment Is Unique
: Rinse, Wash, Repeat!
: Christ is King.
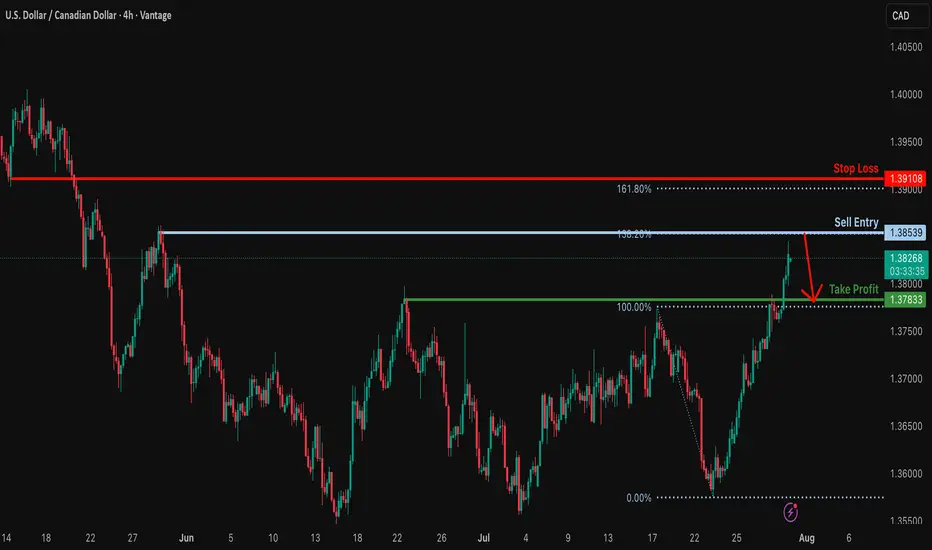
Could the Loonie reverse from here?The price is rising towards the resistance level, which is a swing high resistance that aligns with the 138.2% Fibonacci extension and could potentially reverse from this level to our take-profit.
Entry: 1.3853
Why we like it:
There is a swing high resistance that lines up with the 138.2% Fibonacci extension.
Stop loss: 1.3910
Why we like it:
There is a pullback resistance that is slightly above the 161.8% Fibonacci extension.
Take profit: 1.3783
Why we like it:
There is a pullback support.
Enjoying your TradingView experience? Review us!
Please be advised that the information presented on TradingView is provided to Vantage (‘Vantage Global Limited’, ‘we’) by a third-party provider (‘Everest Fortune Group’). Please be reminded that you are solely responsible for the trading decisions on your account. There is a very high degree of risk involved in trading. Any information and/or content is intended entirely for research, educational and informational purposes only and does not constitute investment or consultation advice or investment strategy. The information is not tailored to the investment needs of any specific person and therefore does not involve a consideration of any of the investment objectives, financial situation or needs of any viewer that may receive it. Kindly also note that past performance is not a reliable indicator of future results. Actual results may differ materially from those anticipated in forward-looking or past performance statements. We assume no liability as to the accuracy or completeness of any of the information and/or content provided herein and the Company cannot be held responsible for any omission, mistake nor for any loss or damage including without limitation to any loss of profit which may arise from reliance on any information supplied by Everest Fortune Group.
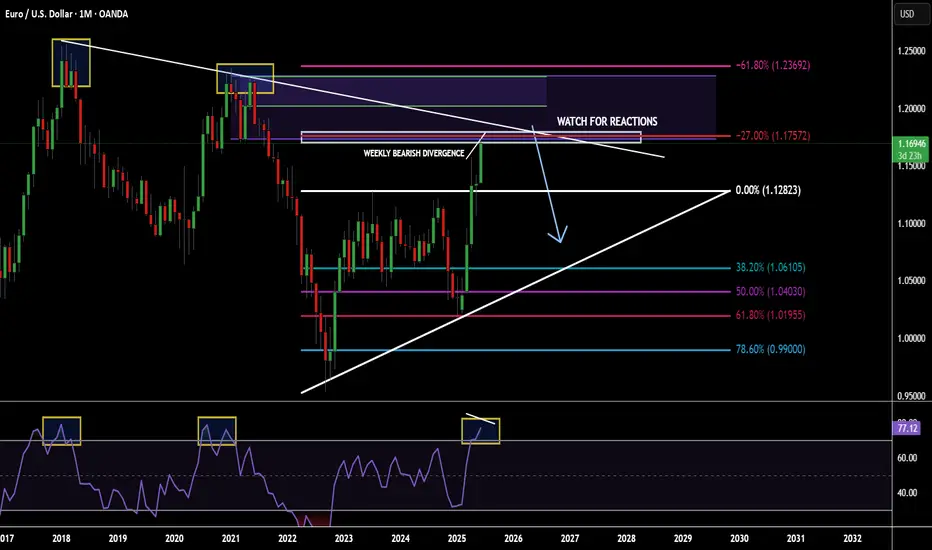
POTENTIAL EURUSD SHORT OPPORTUNITY...POSITION TRADEHello hello TradingView family! Hope you guys are doing amazingly well! Just wanted to come on here and make another post for a potential longer term opportunity I am seeing on the major currency pair EURUSD. So put your seat belts on and let's dive in!!
OK so I'm going to keep this very very simple. Not because I don't want to go in depth but because my trading is very simple and I'm just going to give it to you straight. So here are the points
1. Price is @ monthly supply
2. Price has made new highs & sitting at a monthly fib extension
3. Monthly RSI overbought conditions
4. Weekly has bearish divergence forming
5. Weekly/Daily buyer is slowing down
Make sense? If not..then I know you will figure it out. Watch for price to potentially poke a little higher but nice confluences for a fall in price. Appreciate you all!
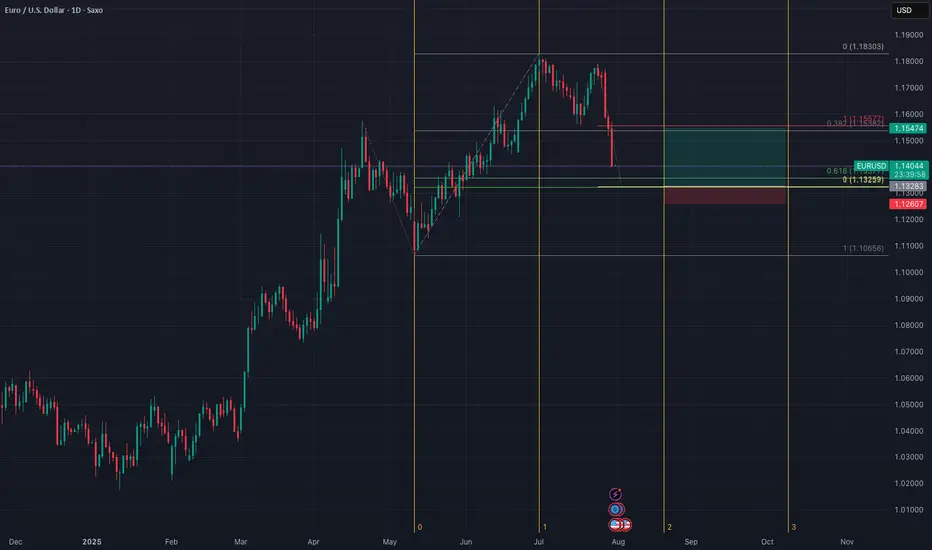
EURUSD - quickly getting to major supportIn my view EUR reversed and will continue downtrend for few weeks. However the price is quickly getting to significant support at 1.13500. The cluster is created by FR 0.618 and One to One with previous correction. I expect the price to make correction from the support and go up even to 1.15500
MARKET CONTEXT...#1 TOOL FOR PROFITABLE TRADING...EURUSD EXAMPLEHey hey TradingView family! Hope you are all doing amazing! I just wanted to come on and make a video speaking on market context, the #1 tool/idea that helped me go from struggling to profitable trader.
Understanding the bigger picture in trading, like TRULY understanding the higher timeframe perspective will work wonders in your analysis & trading whether you are a scalper or a position trader. It gives you the context for what market and the stage of market you are in whether in short term or longer term positions, which will IMMEDIATELY give you an edge.
Understanding=profitability in the markets. So does simplicity.
So watch this video as many times as you guys need, keep it simple, and watch this change your trading starting TODAY for the GOOD!
Cheers!

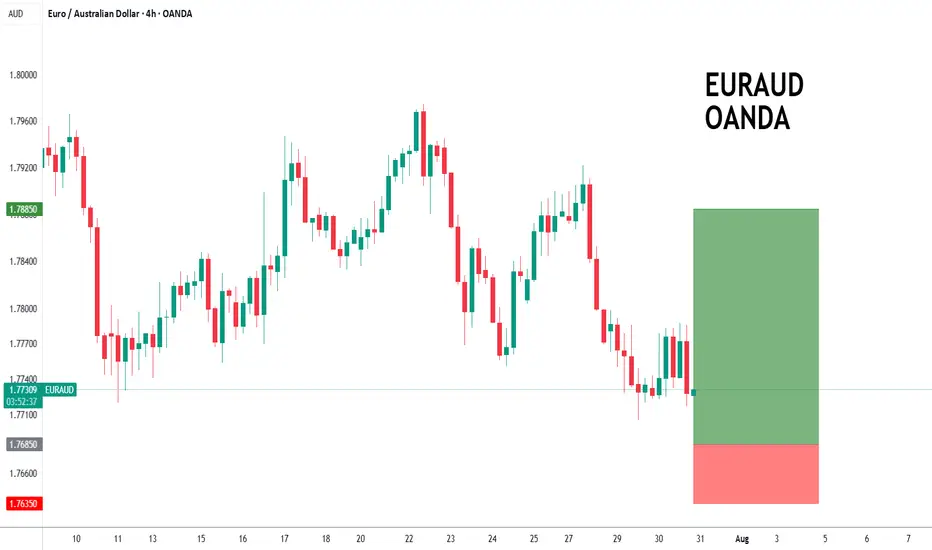
EURAUD to see a temporary move lower?EURAUD - 24h expiry
The primary trend remains bullish.
The selloff is close to an exhaustion count on the daily chart.
Preferred trade is to buy on dips.
Risk/Reward would be poor to call a buy from current levels.
Bespoke support is located at 1.7685.
We look to Buy at 1.7685 (stop at 1.7635)
Our profit targets will be 1.7885 and 1.7910
Resistance: 1.7850 / 1.7910 / 1.7950
Support: 1.7700 / 1.7680 / 1.7630
Risk Disclaimer
The trade ideas beyond this page are for informational purposes only and do not constitute investment advice or a solicitation to trade. This information is provided by Signal Centre, a third-party unaffiliated with OANDA, and is intended for general circulation only. OANDA does not guarantee the accuracy of this information and assumes no responsibilities for the information provided by the third party. The information does not take into account the specific investment objectives, financial situation, or particular needs of any particular person. You should take into account your specific investment objectives, financial situation, and particular needs before making a commitment to trade, including seeking, under a separate engagement, as you deem fit.
You accept that you assume all risks in independently viewing the contents and selecting a chosen strategy.
Where the research is distributed in Singapore to a person who is not an Accredited Investor, Expert Investor or an Institutional Investor, Oanda Asia Pacific Pte Ltd (“OAP“) accepts legal responsibility for the contents of the report to such persons only to the extent required by law. Singapore customers should contact OAP at 6579 8289 for matters arising from, or in connection with, the information/research distributed.
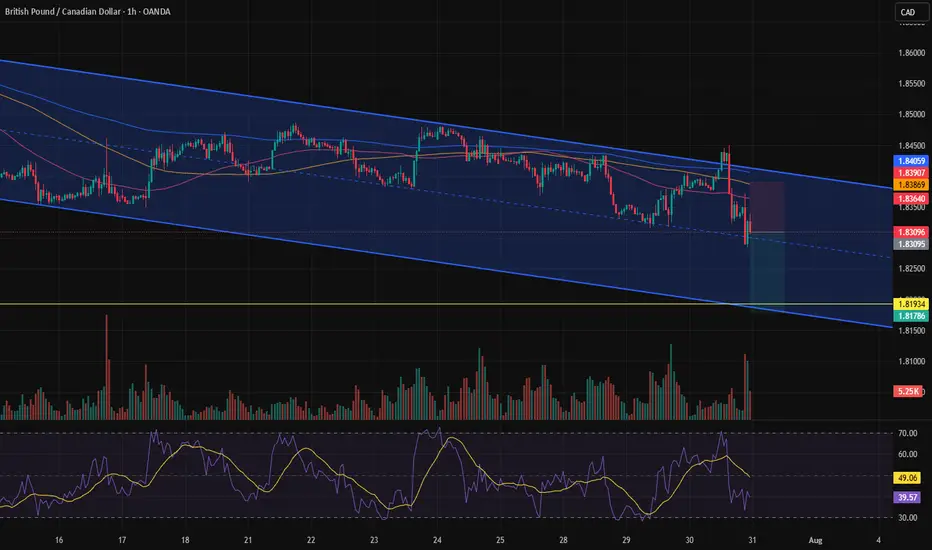
A move toward the bottom of the channel.After reaching the midline of the channel, a strong green shadow (wick) appeared and the price was rejected, but after that, there were no more green candles. It seems that the price is now inclined to move toward the bottom of the channel.
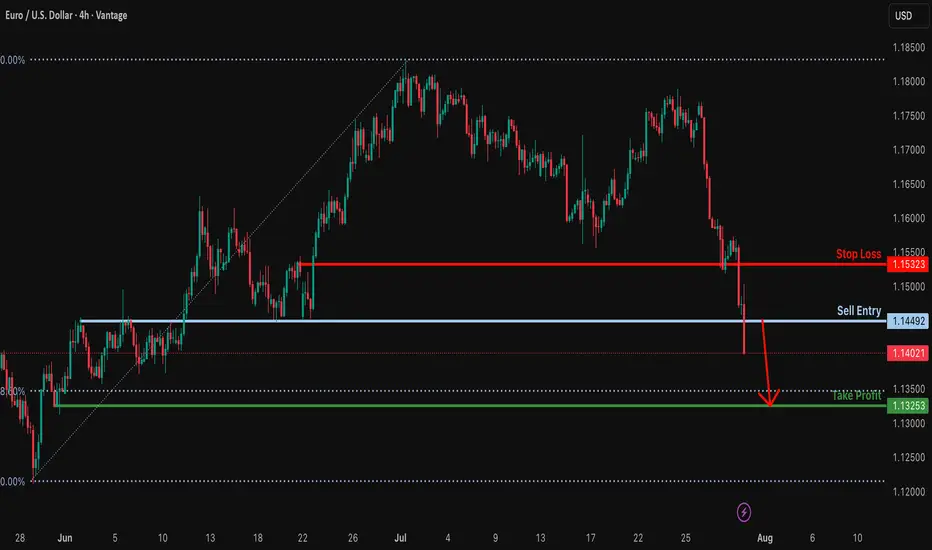
Bearish drop?EUR/USD has broken out of the support level, which is an overlap support. A potential pullback to the sell entry followed by a reversal could lead the price to drop from this level to our take-profit.
Entry: 1.1449
Why we like it:
There is an overlap resitance level.
Stop loss: 1.1532
Why we like it:
There is a pullback resitance level.
Take profit: 1.1325
Why we like it:
There is a swing low support that is slghtly below the 78.6% Fibonacci retracement.
Enjoying your TradingView experience? Review us!
Please be advised that the information presented on TradingView is provided to Vantage (‘Vantage Global Limited’, ‘we’) by a third-party provider (‘Everest Fortune Group’). Please be reminded that you are solely responsible for the trading decisions on your account. There is a very high degree of risk involved in trading. Any information and/or content is intended entirely for research, educational and informational purposes only and does not constitute investment or consultation advice or investment strategy. The information is not tailored to the investment needs of any specific person and therefore does not involve a consideration of any of the investment objectives, financial situation or needs of any viewer that may receive it. Kindly also note that past performance is not a reliable indicator of future results. Actual results may differ materially from those anticipated in forward-looking or past performance statements. We assume no liability as to the accuracy or completeness of any of the information and/or content provided herein and the Company cannot be held responsible for any omission, mistake nor for any loss or damage including without limitation to any loss of profit which may arise from reliance on any information supplied by Everest Fortune Group.
GBPUSD how low it will go?The first strong suport I can see at 1.31500 - 1.3100.
This cluster is created by three Fibo Retracement measurements.
I expect price to rebound form there and go up to 1.35400. I don's expect GBP to return to the uptrend - just make a correction and go down again.
Just my opinion.
