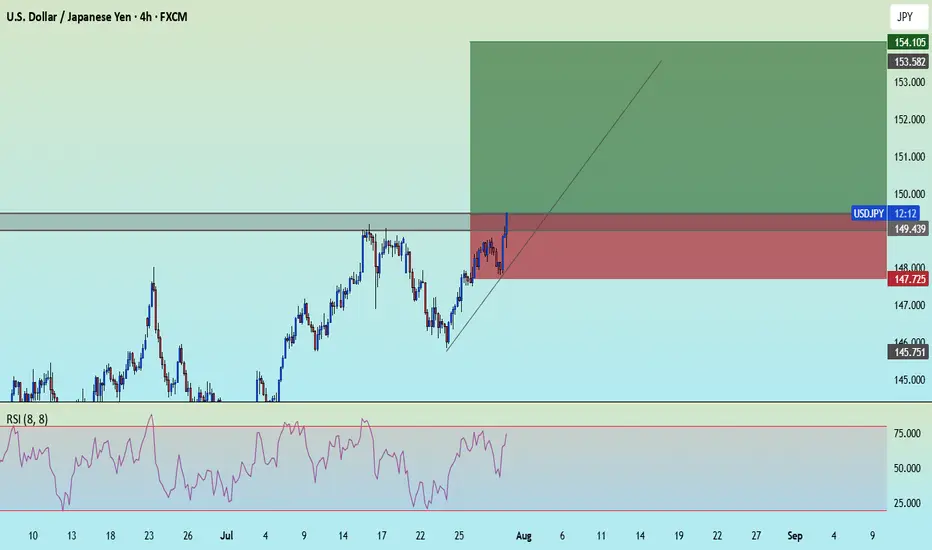
USDJPY-BUYPrice breaking the resistant area with a Momentum Candle. overall it's an uptrend. daily and weekly price is over EMA200.
Forex market
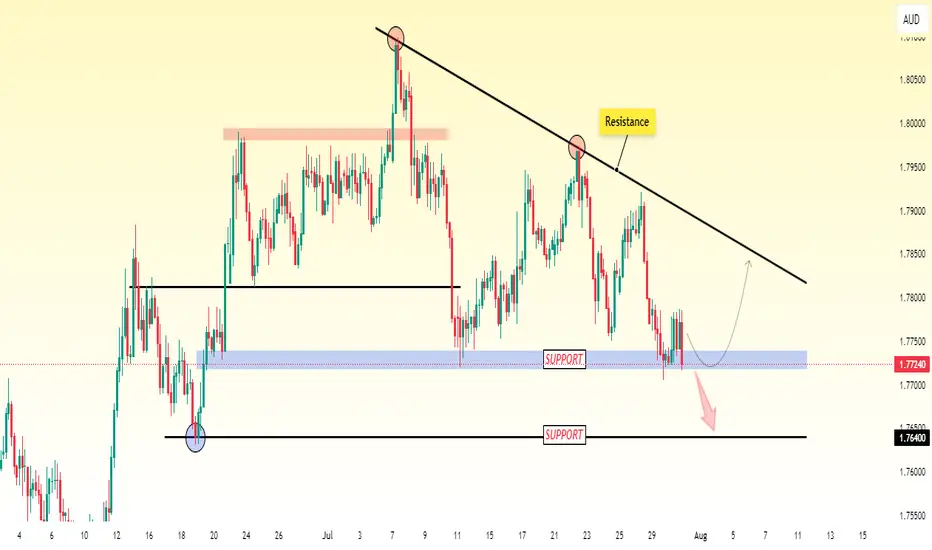
EUR/AUD Testing Support - Drop Incoming?EUR/AUD is sitting on an important support level. So far, the price has been holding, but it's starting to show signs of weakness.
If the price breaks below this support, it could drop further, with the next target around 1.7640.
This level could act as the next area where the price might slow down or bounce.
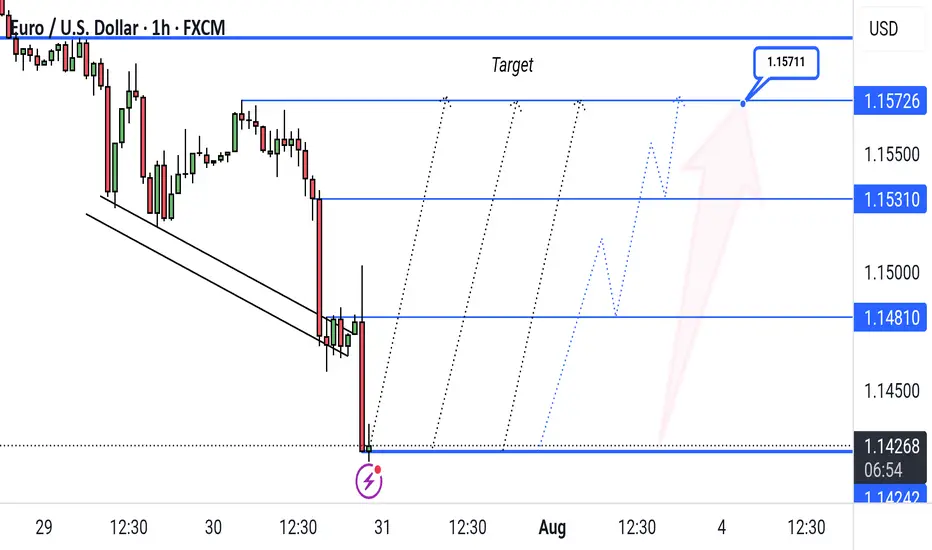
"EUR/USD Bullish Reversal Setup with Key Resistance Targets"This EUR/USD 1-hour chart shows a potential bullish reversal setup. Price recently bounced from the 1.14257 support level, and the chart outlines a projected upward move with key resistance targets at 1.14810, 1.15310, and 1.15726. The final target is marked at 1.15711.
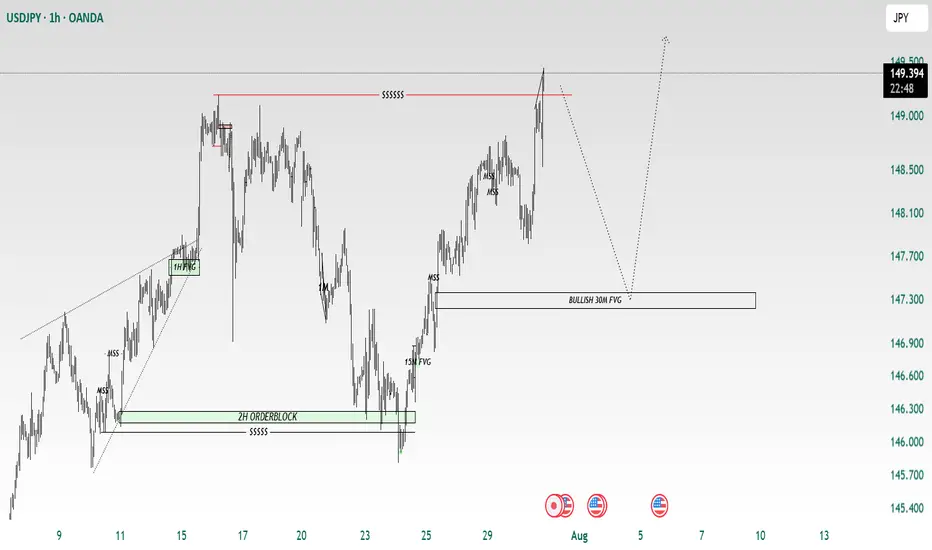
USD/JPYUSDJPY Has taken liquidity. with the fed holding rates and the BOJ interest rate coming out this morning i can see a pull back into the hourly fvg before climbing higher
EURUSD | Faces Continued Downside, Reversal Above 1.1745EURUSD | Faces Continued Downside Risk; Reversal Only Confirmed Above 1.1747
The price initiated a bearish trend from the resistance level at 1.1747 and continues to decline. As long as it remains below the pivot level at 1.1685, further downside pressure is expected, with potential targets at 1.1632 and 1.1559. A confirmed break below this zone would reinforce the more bearish momentum.
However, if the price reverses and moves back above the pivot line, it may first reach 1.1747 before resuming the downward trend again.
The bullish trend confirmation will start above 1.1747.
Key Levels:
• Pivot line: 1.1685
• Resistance: 1.1747, 1.1894.
• Support: 1.1632, 1.15993, 1.1559.

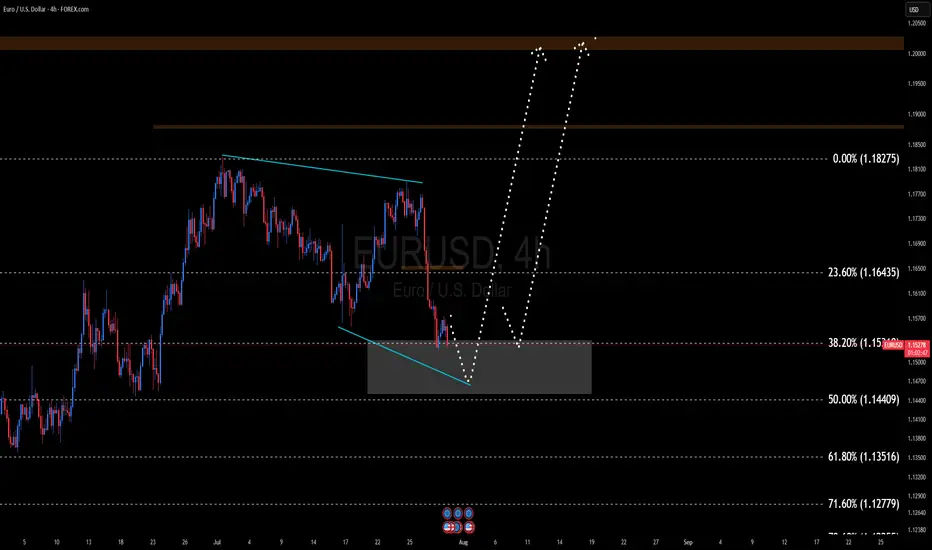
EURUSD BULLISH TREND EUR/USD is currently in a transitional phase and appears to have completed its retracement . It is expected to enter a bullish trend, with a possible breakout from the 1.14500 – 1.15200 range. These levels may serve as key turning points for the upcoming movement.
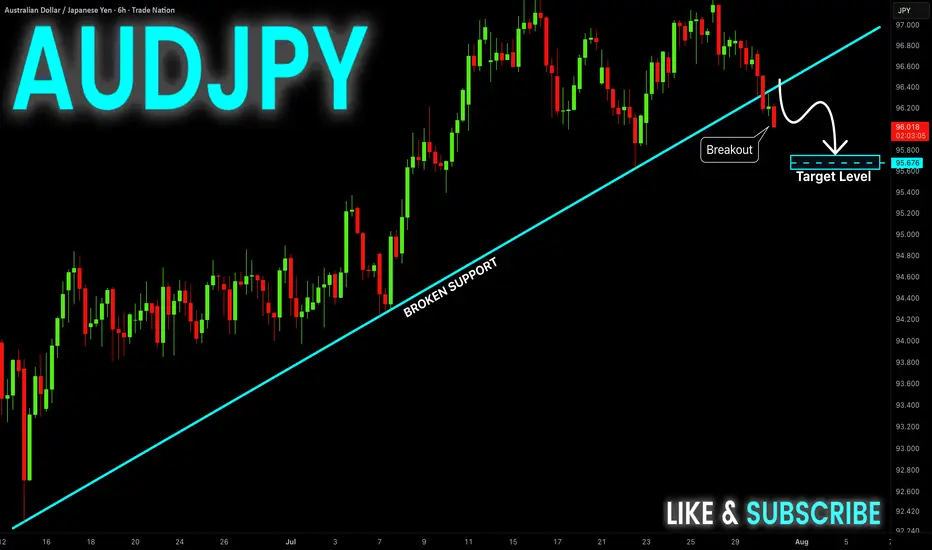
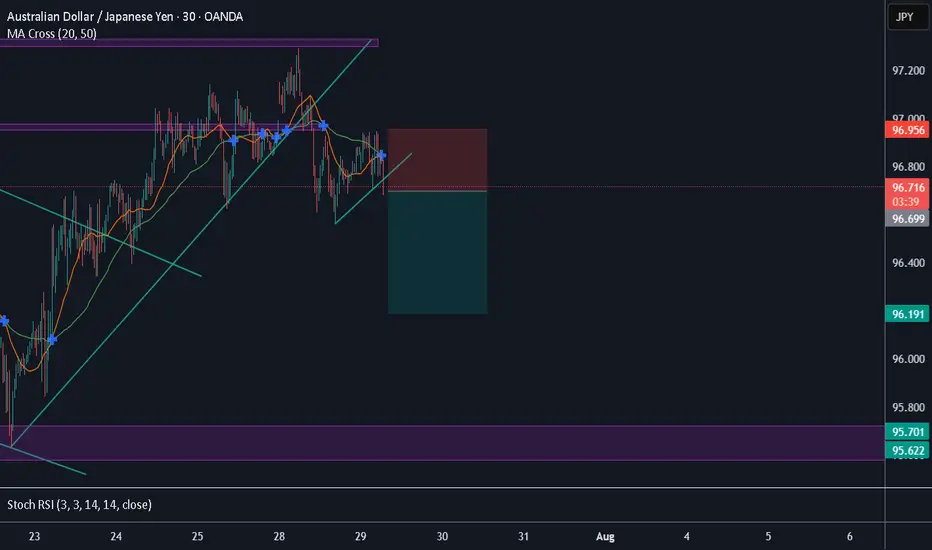
AUD-JPY Bearish Breakout! Sell!
Hello,Traders!
AUD-JPY made a bearish
Breakout of the rising support
Line and we are bearish biased
So we will be expecting a
Further bearish move down
Sell!
Comment and subscribe to help us grow!
Check out other forecasts below too!
Disclosure: I am part of Trade Nation's Influencer program and receive a monthly fee for using their TradingView charts in my analysis.
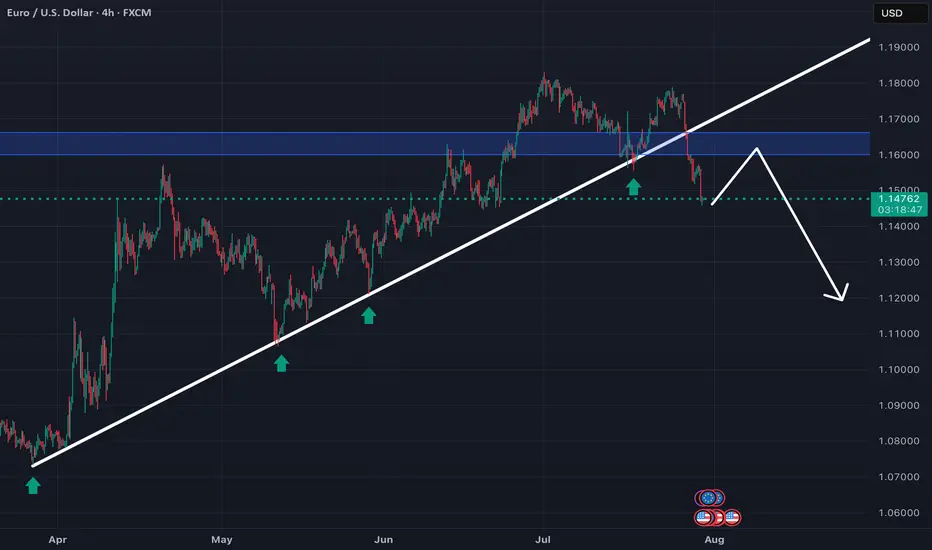
EURUSD – Post-FOMC Macro Compression in Play📉 EURUSD – Post-FOMC Macro Compression in Play
WaverVanir | VolanX Protocol | July 30, 2025
The recent Fed hold has added pressure to the euro as rate differentials remain in favor of the USD. On the chart, EURUSD failed to sustain above the 0.786 retracement level (~1.1476), with clear signs of exhaustion.
🧠 Thesis:
We may see a macro compression pullback with EURUSD potentially revisiting the baseline support zone at 1.08147, which previously acted as a long-term resistance-turned-support.
🔍 Technical Confluence:
Rejection near 0.786 Fib (1.1476)
No bullish breakout above 2023–2024 ceiling
Downside targets:
1.1070 → short-term support
🟡 1.0815 → baseline zone and decision point
🧠 Macro Overlay:
Fed is in pause-and-watch mode
ECB growth outlook is slowing
US inflation is stickier = USD strength persisting short term
📌 VolanX DSS Summary: Bearish structure developing. We favor tactical shorts on rallies toward 1.1470–1.15 with eyes on the 1.08 handle.
#EURUSD #FOMC #VolanX #WaverVanir #MacroTrading #ForexSignals #USD #ECB #RateDifferential #Fibonacci #SMC #Liquidity #ForexMacro

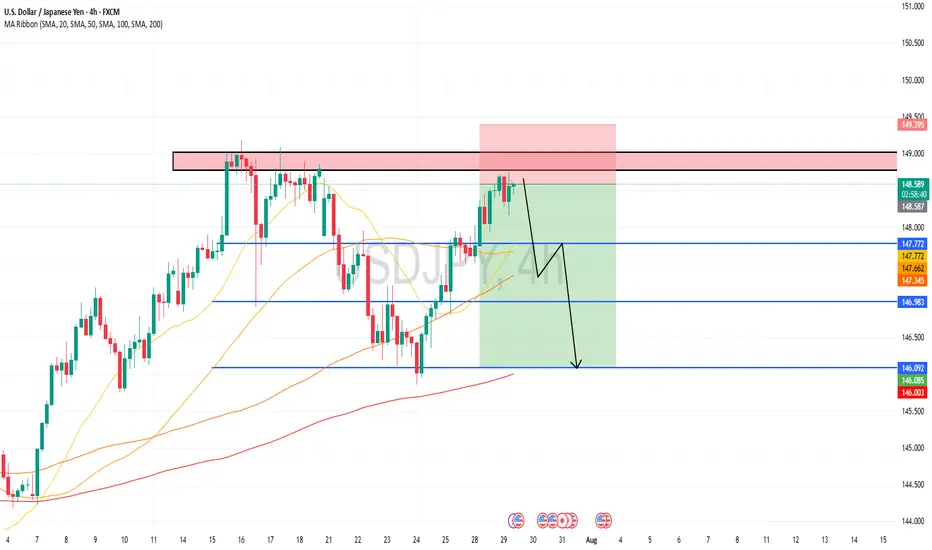
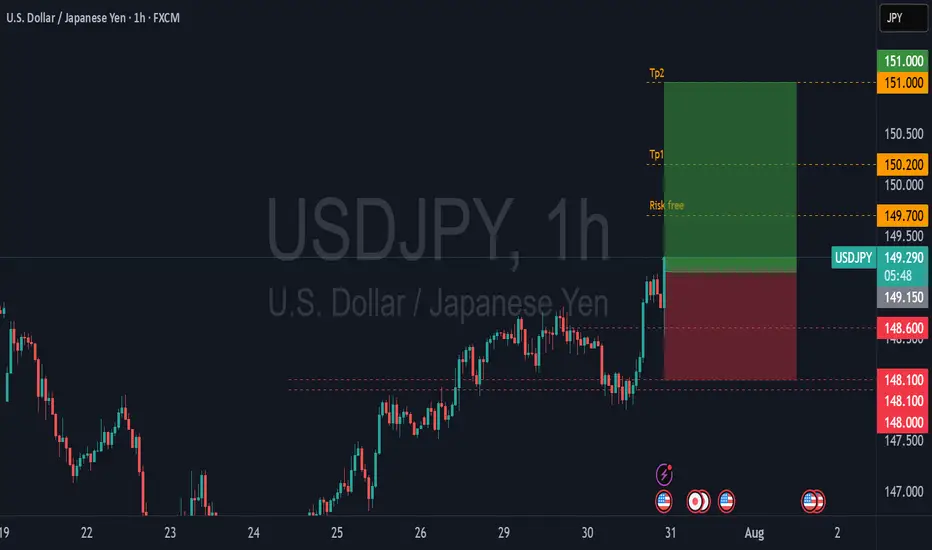
USDJPY Setup: Prime Buy Zone with a Clear Target!Good morning my friends,
I've prepared a fresh USDJPY analysis just for you.
Currently, the most logical buy zone sits at 147.170. If price reaches this level and performs a retest, it’s likely to target the 149.185 level.
I'll personally be entering at 147.170 and waiting for my target: 149.000.
This setup is based on the 4-hour timeframe, so it may take some time to reach the target.
Every single like you give is a major source of motivation for me to keep sharing these analyses.
Thanks so much to everyone supporting with a like!

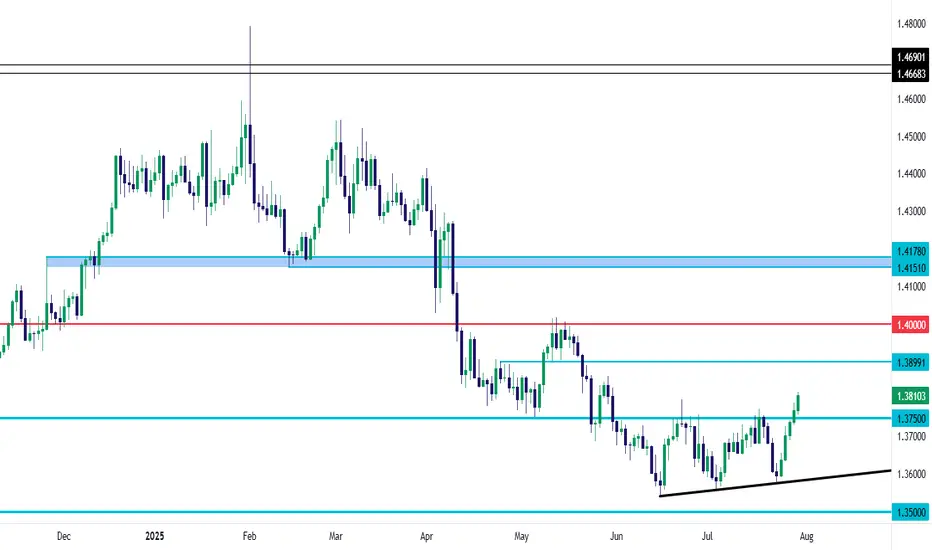
USD/ CAD Are We Heading to $1.46 Territory Watch OUT Afternoon Trading Family
Based on what we are seeing is a nice bullish run up to the following levels :
Levels To Watch For:
1) $1.39
2) $1.41
3) $1.43
4) $1.46
However be aware if we for whatever reason we sink back into the 1.35 territory then we could see a drop down to 1.34
Trade Smarter Live Better
Kris

Analysis on the Elite 10 Pairs and Area of InterestYou can follow us for more Analysis(Images and Videos) with Precise definition of the Financial Market.ENJOY!!!

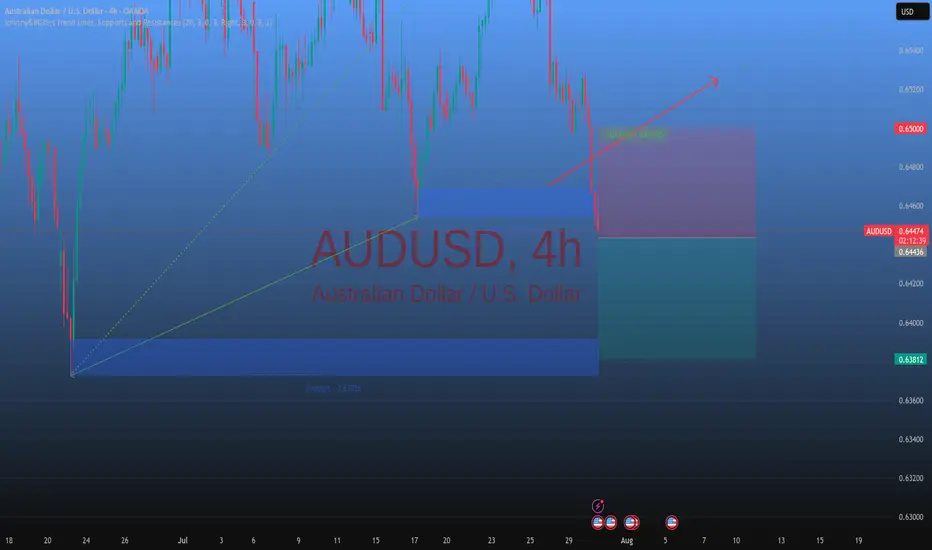
AUD USD BUYAfter a healthy correction AUD showing strength with some bullish divergence. A good entry for the restarec Elliot Wave.
AUD/USD ANALYSIS: WHERE ARE WE HEADED Good afternoon
Based on what we are saeeing with AUD/USD we see two options
1) Below .645 low then we can see a decent drop down to .635
2) If we can break the highs of .652 then a drive up to .65951 makes sense
Trade Smarter Live Better
Kris

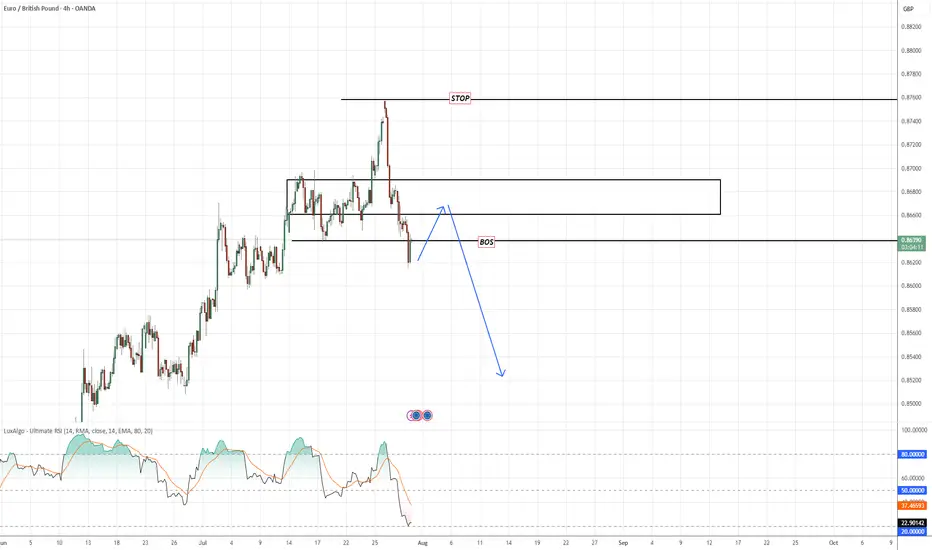
EURGBPMajor Break of Structure (BoS) confirmed on the daily, with a clear rejection from recent highs. Price has aggressively sold off and is now preparing for a retracement into a key supply zone.
🔸 Plan:
Waiting for a pullback toward the 0.8715–0.8740 supply zone (area of interest) to look for signs of bearish continuation.
🔸 BoS confirms shift in trend structure
🔸 STOP: Above the previous high ~0.8825
🔸 Target: Lower lows toward ~0.8500 short term — possible extension toward 0.84xx zone
🧠 RSI shows strong bearish divergence and confirms trend shift.
📌 Setup in progress — will monitor lower timeframes (1H/4H) for entry trigger within zone.
Trendline BreakThe price has broken out of a bullish trendline, followed by a pullback and now the price looks to make a lower low and go short
WE ONLY TRADE PULLBACKS
LONG ON NZD/USDNZD/USD is at a major demand level.
Dollar is bearish. Economic News this afternoon should assist and pushing this pair up.
Looking to catch 200 pips to the previous high.

Potential Sell Continuation EURUSDLooking to sell the retest.
Price broke out of trend line with momentum loss of lower high.
What do you think?
USD/CAD Ascending Triangle BreakoutUSD/CAD was hit hard during the Q2 sell-off in the USD. And with the almost decade long range still in-play for the pair, with the reversal around 1.4500 in February, that makes sense.
The problem quickly became sentiment as sellers jumped on the move so aggressively, and since mid-June bears have had trouble breaking down to any fresh lows.
We can even see an element of this from May, when prices found support at 1.3750 and sellers were suddenly stalled despite a clear downside trend.
This is a great illustration of why sentiment is so important - if anyone that wants to sell or that can sell the pair already has - even the worst news in the world would have trouble pushing fresh lows. Because if there's no supply coming into the market and there's more demand, well, then prices will go up just given basic supply/demand dynamics. And with a heavy built in short position following a clean downside trend, there will be some sellers looking to take profit which is what generates the start of that demand. And then more shorts will be motivated to take profit as they see price rising even with negative news flow, when prices should be falling.
This can continue all the way until we get to a point that is attractive again to draw fresh sellers into the market and in USD/CAD, that was the 1.4000 handle that held a clean show of resistance in mid-May, and that ushered in another wave of selling. But in mid-June, as price got close to the 1.3500 handle, a similar type of thing started to happen as sellers began to shy away from chasing the move.
Initially that allowed for pullback to that same 1.3750 level that was support in May. Sellers took another shot and even as the USD was setting fresh three-year-lows on the first day of Q3, USD/CAD was setting a higher-low above the prior swing. The trendline produced from those two lows came into play just last week - and when combined with the 1.3750 level made for a textbook ascending triangle formation.
Those setups are often tracked with aim of bullish breakout as it's essentially showing a line in the sand that sellers have defended, in this case at 1.3750; but there's a diminishing impact of that resistance as shown from the increasingly higher-lows. The thought is that, eventually, sellers will give way to the buyers that have been defending higher-lows and that will lead to a breakout and fresh highs.
This is what's taking place now in USD/CAD.
This doesn't necessarily mean that bears are done for, as the big question here is the same from back in May, whether we get to a resistance level that's appealing enough to draw fresh shorts into the market. From the chart attached, I've outlined three areas of interest for such, with 1.3900 nearby and 1.4000 above that. If we do see a prolonged push of USD-strength, there's a zone of support-turned-resistance around 1.4151-1.4178 that becomes of interest for bigger-picture scenarios. - js
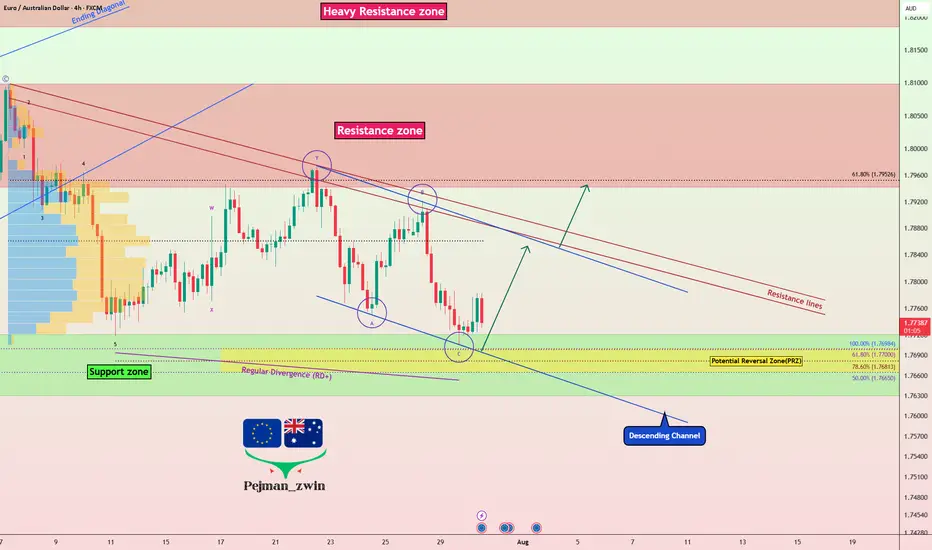
EURAUD Ready to Bounce? Key Support & Fundamentals Aligned!Today I want to share a Long position idea on EURAUD ( OANDA:EURAUD ) with you.
From a fundamental perspective , both the Euro (EUR) and Australian Dollar (AUD) are currently under pressure. However, the Aussie appears fundamentally weaker in the short term, making the EURAUD Long setup more favorable at this stage.
AUD Weakness :
The Reserve Bank of Australia (RBA) has held rates steady at 3.85%, but recent inflation data has dropped to 2.7%, the lowest in over 3 years.
Most economists now expect the RBA to cut rates in its next meeting in August, possibly by 25 basis points.
Slowing economic growth and dovish forward guidance from the central bank are weighing heavily on AUD sentiment.
EUR Outlook :
The European Central Bank (ECB) is also facing weak economic data, but is taking a more cautious approach toward cutting rates.
Despite softer PMIs and sluggish growth in countries like Germany and France, the ECB has not confirmed a near-term rate cut, keeping EUR relatively stable.
This divergence between the RBA’s dovish stance and the ECB’s pause is supportive of EUR strength against AUD.
Summary :
With the RBA likely to ease policy soon and the ECB holding ground for now, the interest rate differential favors EURAUD upside. Fundamentals point toward further weakness in AUD, making the EURAUD Long a strategically sound trade idea for the coming days.
-------------------------------------------
Now let's analyze the conditions of the EURAUD chart on the 4-hour time frame .
EURAUD is currently trading near the Support zone(1.772 AUD-1.763 AUD) , Potential Reversal Zone(PRZ) , and near the lower line of the descending channel .
According to Elliott Wave theory , EURAUD appears to have completed a Zigzag Correction(ABC/5-3-5) .
Also, we can see the Regular Divergence(RD+) between Consecutive Valleys .
I expect EURAUD to rise to at least 1.784 AUD .
Second Target: 1.792 AUD
Note: Stop Loss(SL): 1.762 AUD
Please respect each other's ideas and express them politely if you agree or disagree.
Euro/Australian Dollar Analyze (EURAUD), 4-hour time frame.
Be sure to follow the updated ideas.
Do not forget to put a Stop loss for your positions (For every position you want to open).
Please follow your strategy and updates; this is just my Idea, and I will gladly see your ideas in this post.
Please do not forget the ✅' like '✅ button 🙏😊 & Share it with your friends; thanks, and Trade safe.
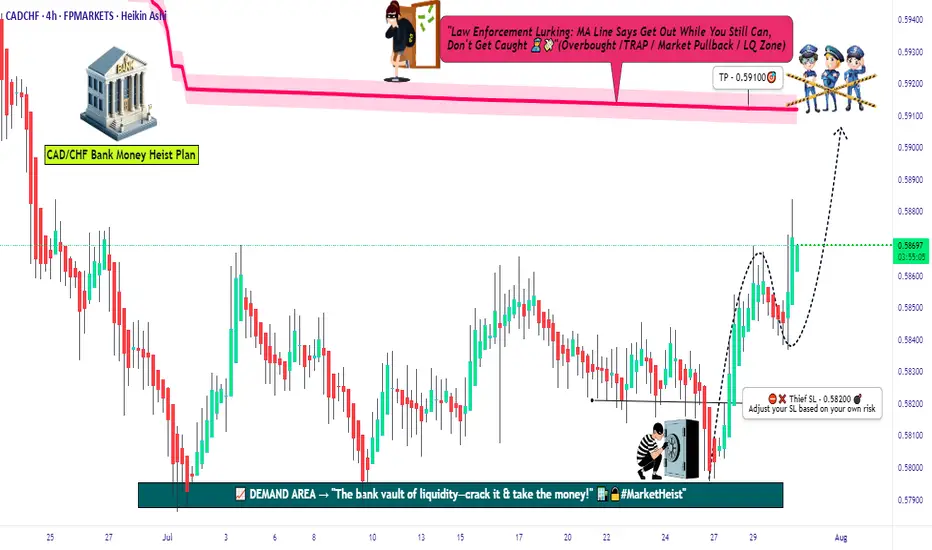
Bears Trapped — CADCHF Heist Begins (Buy Setup Inside)💎💣CAD/CHF Swiss Vault Breakout 💰 Heist in Progress (Scalp/Day Plan)💣💎
“When the market sleeps, we rob it clean!”
🌍 Hola! Bonjour! Hallo! Marhaba! Hello, Thieves & Market Movers! 🌍
💰🤑💸Welcome to another high-stakes heist from the vaults of Thief Trader HQ!💸🤑💰
This time, our radar’s locked on CAD/CHF — aka the Loonie vs the Swissy.
We’re executing a precise scalping/day trading robbery based on the mix of technical traps, macro fundamentals, and sentiment distortion.
The vault is unattended, the guards are napping — time to MOVE.
🎯 ENTRY PLAN 📈
The vault’s unlocked — bulls, suit up.
☑️ Execute BUY LIMITS closest to swing lows on the 15M or 30M chart for precision pullbacks.
☑️ Use DCA layering — multiple limit orders = more loot bags.
📌 Entry Zone: Flexible — "Any dip is a gift. Rob it!"
🛑 STOP LOSS STRATEGY 🚫
🔒 SL secured at 0.58200, based on 4H swing low.
🛡️ Adjust based on your risk appetite, trade size, and how heavy you stack your orders.
💸 TARGET TAKE 🏁
🎯 Primary TP: 0.59000
🤑 Trail if price rips through — let the robbery run.
📊 WHY THIS HEIST? 🔥
We’re seeing:
✔️ Bullish market shift
✔️ Overbought bait trap for late bears
✔️ Reversal zones tested
✔️ Consolidation breakout pattern forming
✔️ Risk-reward setup aligned for thieves
All backed by:
📌 COT Reports
📌 Macro Trend Forecasts
📌 Quant Models & Sentiment Flow
📌 Intermarket Confirmation (Oil correlations, CHF flows, risk sentiment)
📰⚠️ TRADING ALERT – News Watch 🚨
News is a market alarm system — don’t trip it.
✔️ Avoid entries during red-folder releases
✔️ Use trailing SLs to protect profit loot
✔️ Update your chart often — the game moves fast
❤️ SHOW SOME LOVE TO THE CREW
💥 SMASH the Boost Button if you love the plan 💥
🎯 Help grow the strongest robbery crew on TradingView
📈 Daily profits using Thief Trading Style — no cap, just charts.
🕶️ Stay stealthy. Stay smart. Stay Thief.
See you on the next plan.
Until then... 💼💸🧠
USDJPY Short from ResistanceHello Traders
In This Chart USDJPY HOURLY Forex Forecast By FOREX PLANET
today USDJPY analysis 👆
🟢This Chart includes_ (USDJPY market update)
🟢What is The Next Opportunity on USDJPY Market
🟢how to Enter to the Valid Entry With Assurance Profit
This CHART is For Trader's that Want to Improve Their Technical Analysis Skills and Their Trading By Understanding How To Analyze The Market Using Multiple Timeframes and Understanding The Bigger Picture on the Charts