Forex market
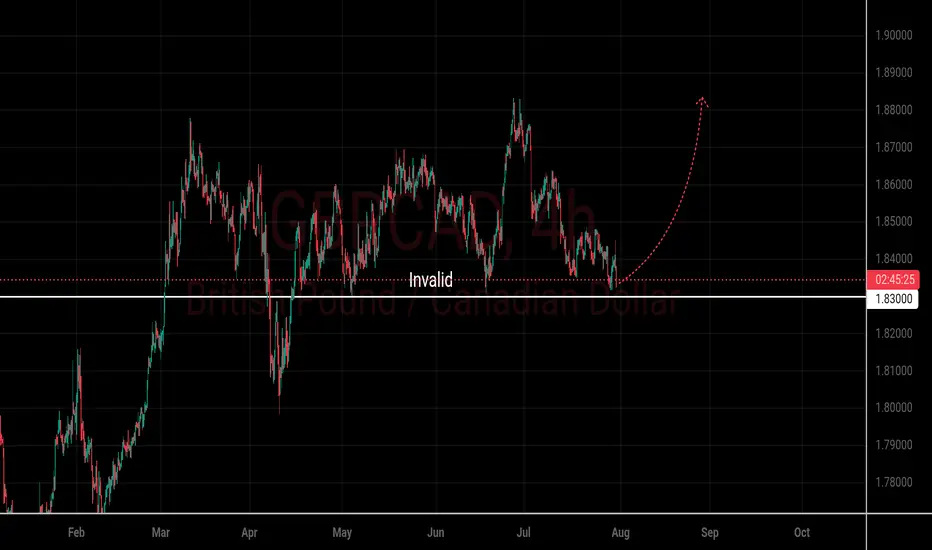
GBPCAD 4H The price appears to be forming a strong support zone around the 1.8350 level, as marked by the horizontal gray area. This level has been tested multiple times, suggesting accumulation and potential exhaustion of selling pressure.
🔄 Scenario: If the support holds, GBP/CAD could bounce and head towards the 1.8800–1.8900 area, as illustrated by the projected path.
✅ Bullish Bias if:
Price holds above 1.8350
Breakout above minor highs near 1.8450
Positive momentum from news or fundamentals
🚫 Invalidation:
Clean break below 1.8300 could trigger further downside.
---
⚠️ Disclaimer
> This chart is for educational and informational purposes only. It does not constitute financial advice or a recommendation to buy or sell any financial instrument. Always conduct your own research and consult a licensed financial advisor before making trading decisions.
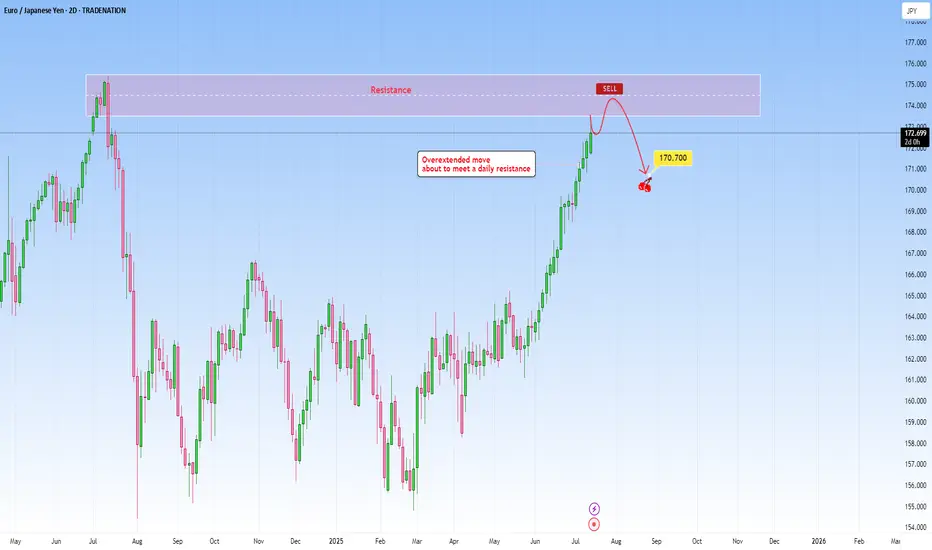
EURJPY: Overextended move to meet daily resistanceThe current market context on EURJPY shows an overextended move that has been pushing higher as price is about to reach a well-established daily resistance. The rally into this resistance lacks healthy retracements, and momentum is likely unsustainable without a deeper correction. The probability of a pause or reversal here under this circumstances increases substantially.
This extension exaggerates this imbalance making it a high probability setup. Volume and price action near this level becomes critical in this case. Signs such as long upper wicks, bearish engulfing patterns will hint that the move may be running out of steam.
I would be targeting a decent pullback towards 170.700.
Just sharing my thoughts for the charts, this isn’t financial advice. Always confirm your setups and manage your risk properly.
Disclosure: I am part of Trade Nation's Influencer program and receive a monthly fee for using their TradingView charts in my analysis.
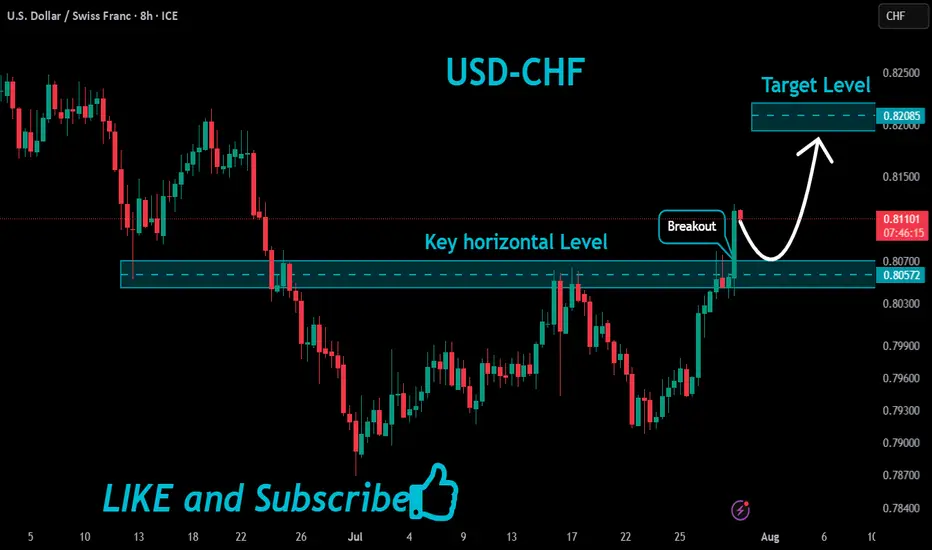
USDCHF Bullish Breakout!
HI,Traders !
#USDCHF is trading in a strong
Uptrend and the price made a
Bullish breakout of the key
Horizontal level of 0.80572
So we are bullish biased
And we will be expecting a
Further bullish move up !
Comment and subscribe to help us grow !
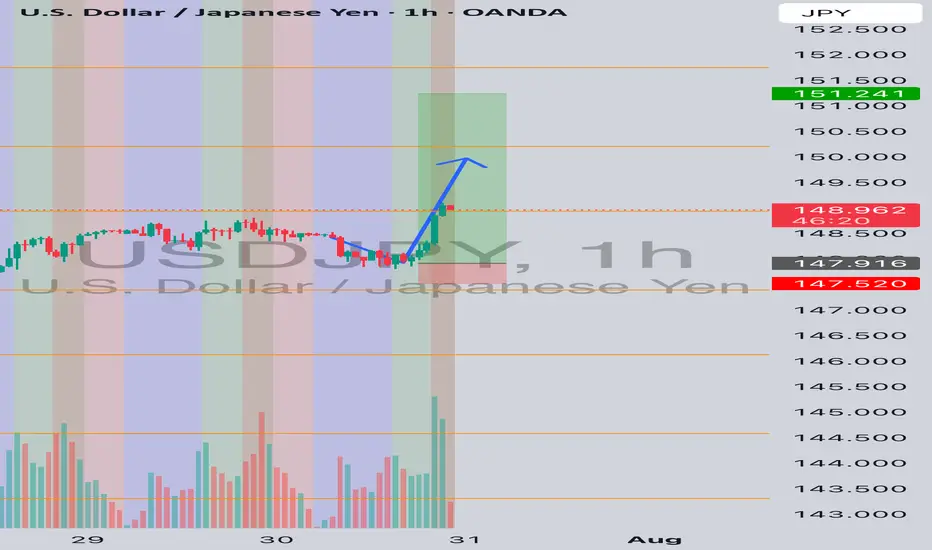
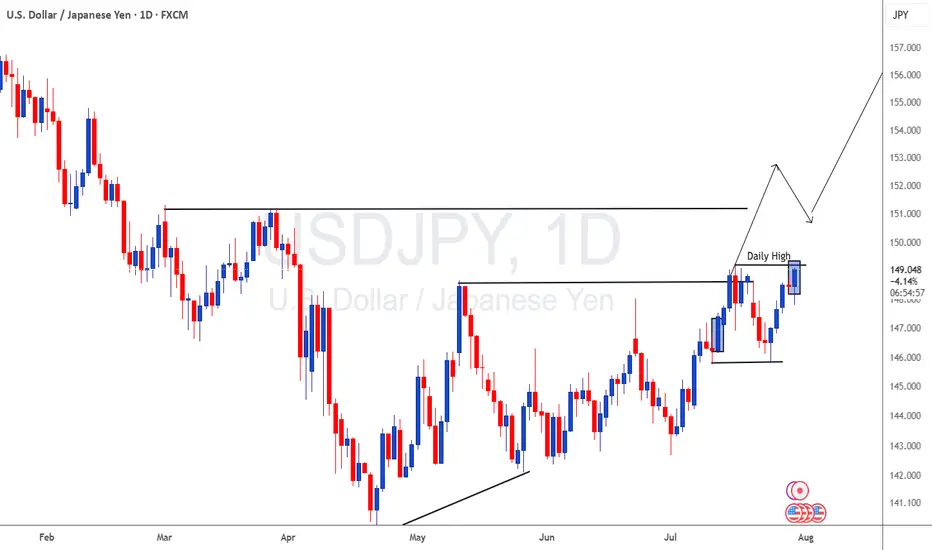
USDJPY LongDecided to do a long entry on UJ. Below is the prediction. Entry was during Asian session. Expecting TP of UJ at around 149ish or 151.250 max
A TEST OF THE PREVIOUS BROKEN STRUCTURE From the daily time frame, we can see that EURUSD has broken a structure which was acting as previous resistance turned support, which is indicated with a blue rectangle.
I'm anticipating the broken support to turn to resistance when the price action retraces from somewhere at the demand zone which is indicated with a red rectangle.
So let's have in back of our mind that price will need to retrace from the low to retest the broken structure and turn into resistance and then after continue to the downside.
......................,.................,......................
Please share your thoughts,what do you think,will EURUSD move downwards or will it be buy the dip and continue with its uptrend.
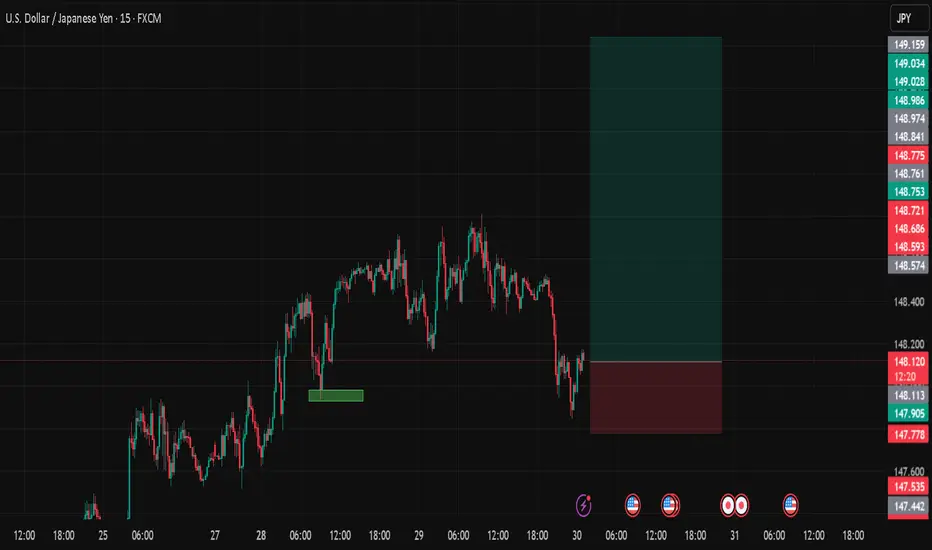
USDJPYDate:
July 30,2025
Session:
Asia and Sydney Session
Pair:
USDJPY
Bias:
Long
Liquid from Mondays New york open swept now price wants to follow trend
Entry: 148.108
Stop Loss: 147.778
Target: 149.640
RR: 4.57
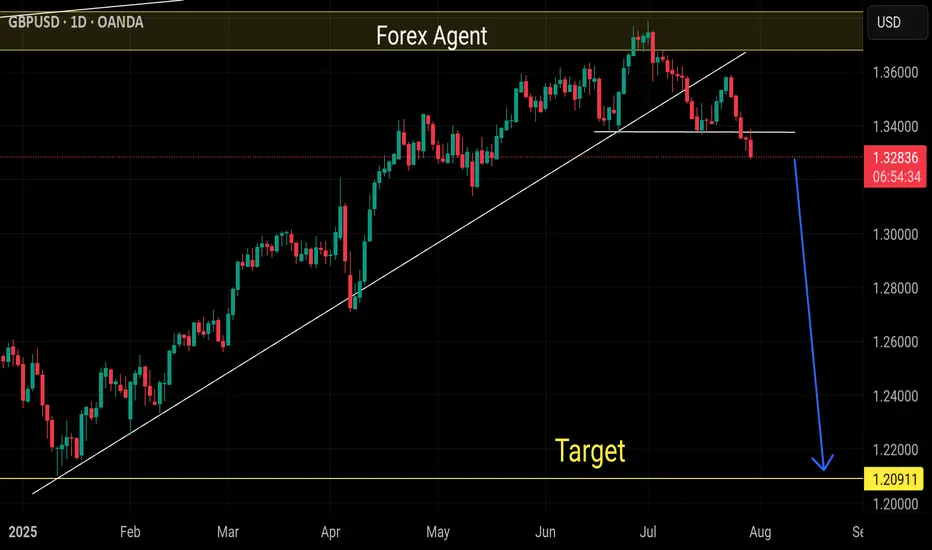
Sell gbpusdOur last selling idea already running 500+ pips in sell
Now previous weak resistance also breaks
In my view its long term selling minimum 800 more pips can be sell
Monthly sell structure and overbought
Market now just on the way of bearing correction
USDJPY UPSIDE The dollar index (DXY00) on Tuesday rose by +0.22% and posted a 5-week high. The dollar has carryover support from Monday following the EU-US trade deal that is seen as favoring the US. Also, expectations for the Fed to keep interest rates unchanged at the end of Wednesday's 2-day FOMC meeting are supportive of the dollar. The dollar extended its gains after the US Jun advance goods trade deficit unexpectedly shrank, a supportive factor for Q2 GDP, and after July consumer confidence rose more than expected.
Ursulization = Bureaucracy > Democracy (a.k.a. The Glasgow Kiss)🤝💥 Ursulization – Bureaucracy Replaces Democracy (a.k.a. The Glasgow Kiss) 🇺🇸🇪🇺
📍Background:
The media spun it as a "15% tariff agreement"…
But in reality, this wasn’t diplomacy — it was a disguised capitulation.
And the stage? None other than Scotland, ancestral ground of Donald J. Trump.
So when Ursula von der Leyen came seeking a gentle diplomatic handshake…
What she received instead was the infamous Glasgow Kiss — sudden, sharp, and unmissable.
💥 What’s a Glasgow Kiss?
A British slang term for a violent headbutt to the face —
No grace. No warning. Just raw force.
💬 The Real Story:
Ursula von der Leyen — unelected, unaccountable —
signed off on $1.4 trillion in U.S.-bound capital flows:
💸 $750B to buy American energy
🛠 $600B in U.S. infrastructure, defense & industry
All to sidestep 50% tariffs the Trump team had ready to roll.
But here's the kicker:
She wasn’t acting on behalf of European citizens.
She was speaking for the bureaucracy, not the people.
🔥 Welcome to Ursulization:
Where democracy is sidelined by unelected power.
Where negotiations happen in silence.
Where scandals like PfizerGate get buried while the euro breaks down.
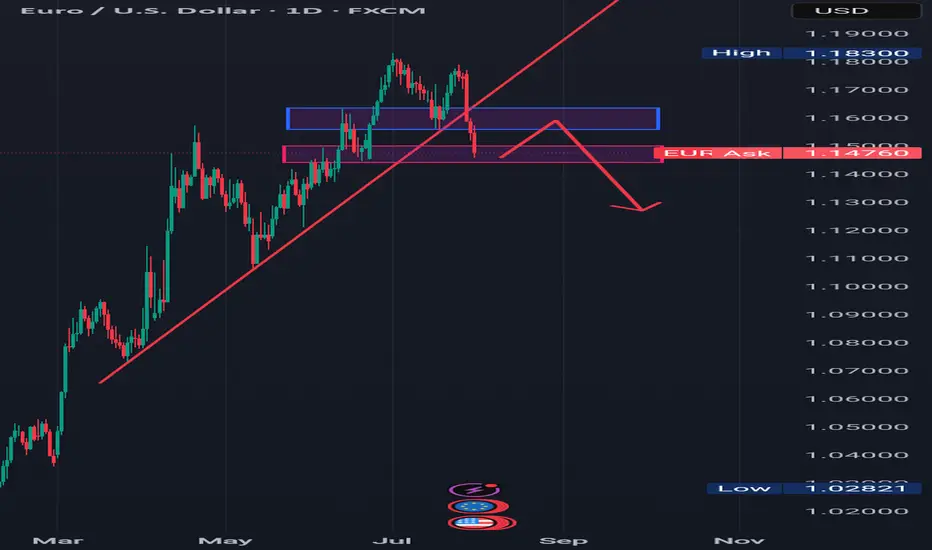
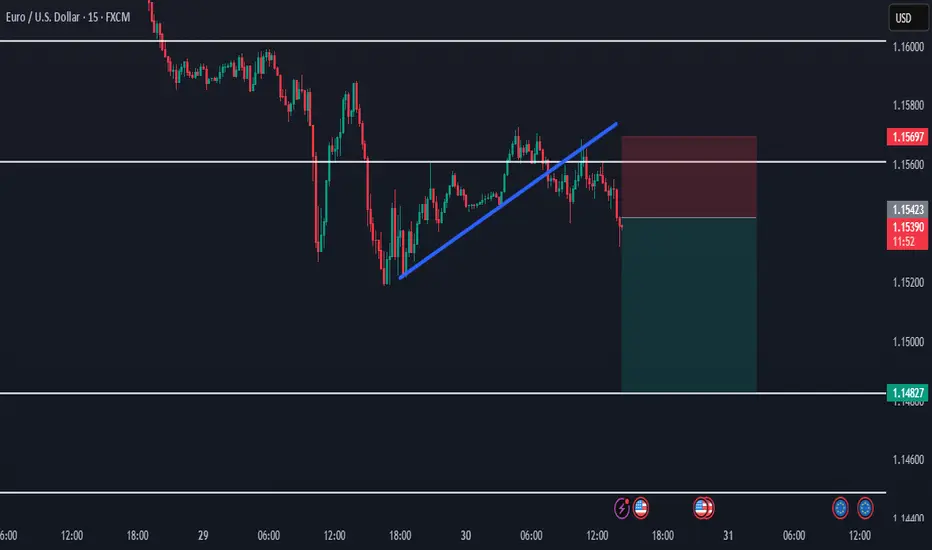
📉 EUR/USD just lost key support at 1.14776 —
The chart shows t he cost of surrender.
💉 PfizerGate Reminder:
Ursula already faced heat for secretive vaccine contracts with Pfizer.
Now, she’s handing over Europe’s industrial backbone —
To Trump. In Scotland. With no public mandate.
📌 Conclusion:
Trump didn’t compromise — he collided.
Europe didn’t resist — it surrendered.
This wasn’t diplomacy.
It was a Glasgow Kiss — a collision between legitimacy and bureaucratic power.
👑 One elected by the people (Trump). One not elected at all (Woke agenda style Ursula).
💰 One walks away with trillions (Trump). The other, with silence (Ursula 'Von der Pfizinen never electenen'').
One Love,
The FXPROFESSOR 💙
ps. Till we can bring Democracy and Europe back.
Disclosure: I am happy to be part of the Trade Nation's Influencer program and receive a monthly fee for using their TradingView charts in my analysis. Awesome broker, where the trader really comes first! 🌟🤝📈

GBPUSD DOWNSIDE UPDATE The dollar index (DXY00) on Tuesday rose by +0.22% and posted a 5-week high. The dollar has carryover support from Monday following the EU-US trade deal that is seen as favoring the US. Also, expectations for the Fed to keep interest rates unchanged at the end of Wednesday's 2-day FOMC meeting are supportive of the dollar. The dollar extended its gains after the US Jun advance goods trade deficit unexpectedly shrank, a supportive factor for Q2 GDP, and after July consumer confidence rose more than expected.

EURUSD DOWN SIDE The dollar index (DXY00) on Tuesday rose by +0.22% and posted a 5-week high. The dollar has carryover support from Monday following the EU-US trade deal that is seen as favoring the US. Also, expectations for the Fed to keep interest rates unchanged at the end of Wednesday's 2-day FOMC meeting are supportive of the dollar. The dollar extended its gains after the US Jun advance goods trade deficit unexpectedly shrank, a supportive factor for Q2 GDP, and after July consumer confidence rose more than expected.

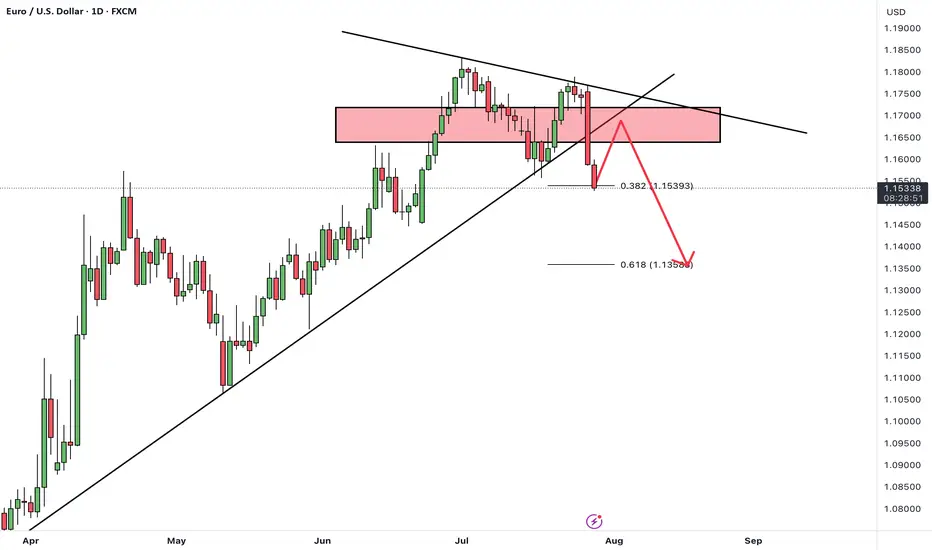
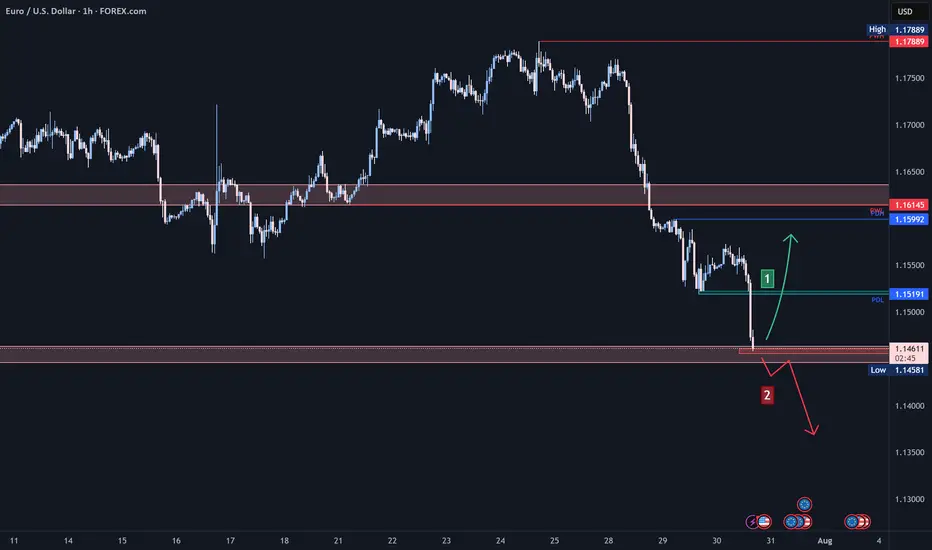
EUR/USD Analysis:🔹 Performance Overview:
The short-term trend is bearish after breaking the recent low. A temporary price correction is likely before the downtrend continues.
1️⃣ Holding above 1.151 USD may lead to a correction toward 1.160 USD.
2️⃣ However, a break and close below 1.145 USD could push the price down to retest 1.140 USD, followed by 1.135 USD.
⚠️ Disclaimer:
This analysis is not financial advice. It is recommended to monitor the markets and carefully analyze the data before making any investment decisions.
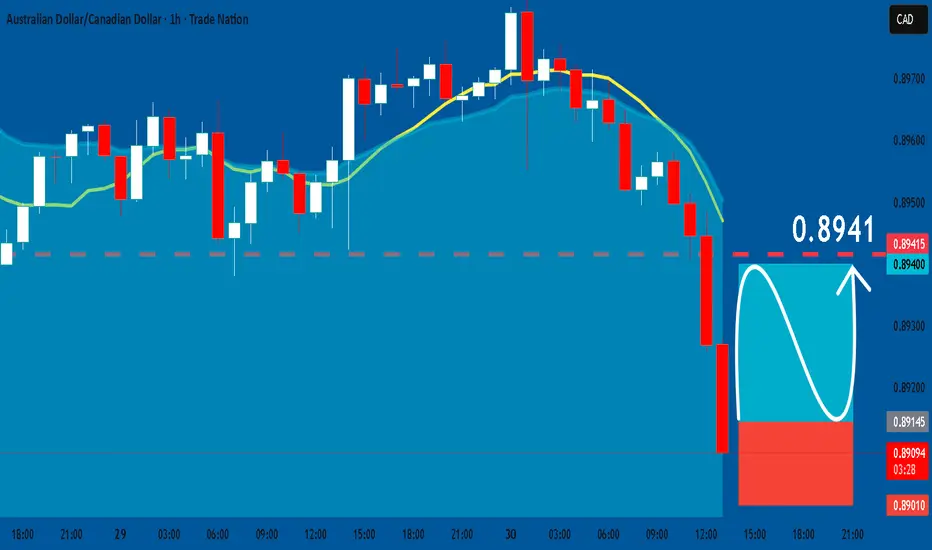
AUDCAD: Long Trade Explained
AUDCAD
- Classic bullish formation
- Our team expects pullback
SUGGESTED TRADE:
Swing Trade
Long AUDCAD
Entry - 0.8914
Sl - 0.8901
Tp - 0.8941
Our Risk - 1%
Start protection of your profits from lower levels
Disclosure: I am part of Trade Nation's Influencer program and receive a monthly fee for using their TradingView charts in my analysis.
❤️ Please, support our work with like & comment! ❤️
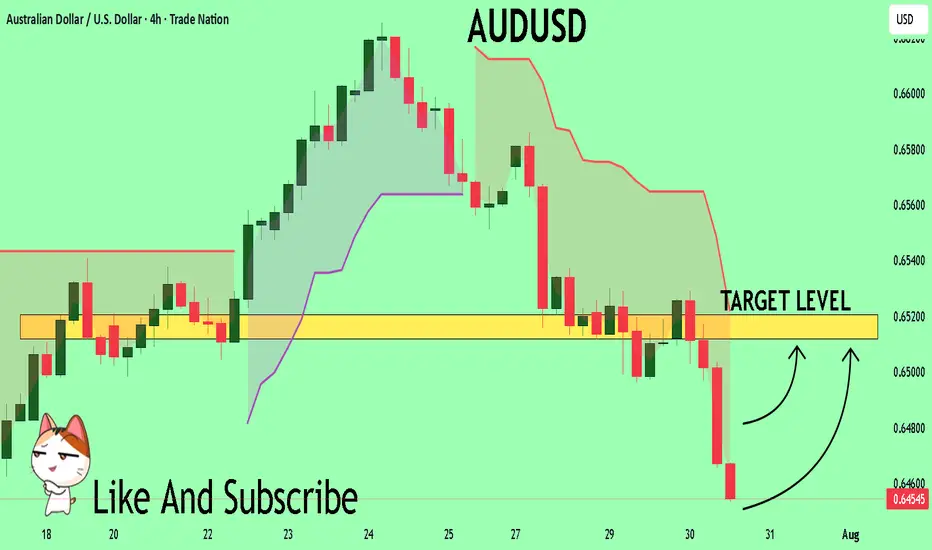
AUDUSD My Opinion! BUY!
My dear subscribers,
AUDUSD looks like it will make a good move, and here are the details:
The market is trading on 0.6455 pivot level.
Bias - Bullish
Technical Indicators: Both Super Trend & Pivot HL indicate a highly probable Bullish continuation.
Target - 0.6512
About Used Indicators:
The average true range (ATR) plays an important role in 'Supertrend' as the indicator uses ATR to calculate its value. The ATR indicator signals the degree of price volatility.
Disclosure: I am part of Trade Nation's Influencer program and receive a monthly fee for using their TradingView charts in my analysis.
———————————
WISH YOU ALL LUCK
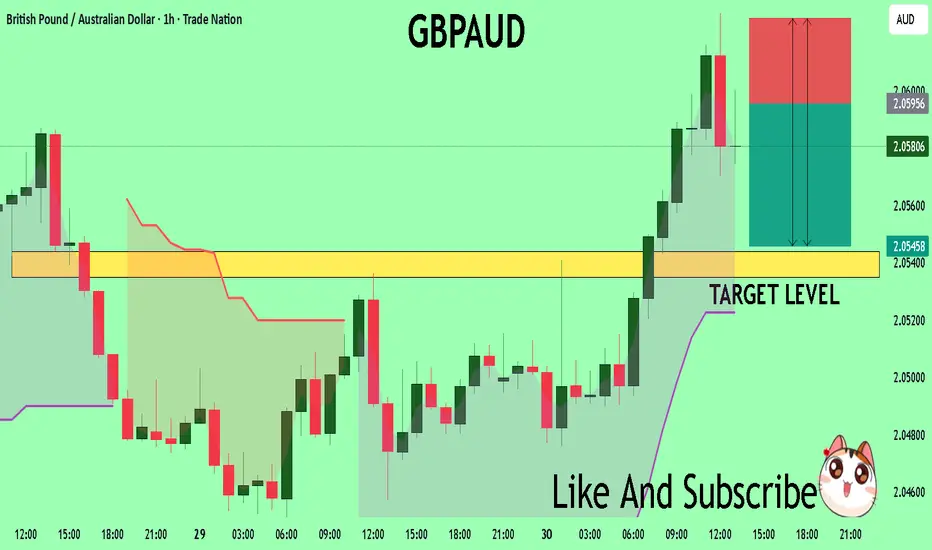
GBPAUD Massive Short! SELL!
My dear subscribers,
My technical analysis for GBPAUDis below:
The price is coiling around a solid key level - 2.0596
Bias - Bearish
Technical Indicators: Pivot Points Low anticipates a potential price reversal.
Super trend shows a clear sell, giving a perfect indicators' convergence.
Goal - 2.0543
My Stop Loss - 2.0626
About Used Indicators:
By the very nature of the supertrend indicator, it offers firm support and resistance levels for traders to enter and exit trades. Additionally, it also provides signals for setting stop losses
Disclosure: I am part of Trade Nation's Influencer program and receive a monthly fee for using their TradingView charts in my analysis.
———————————
WISH YOU ALL LUCK
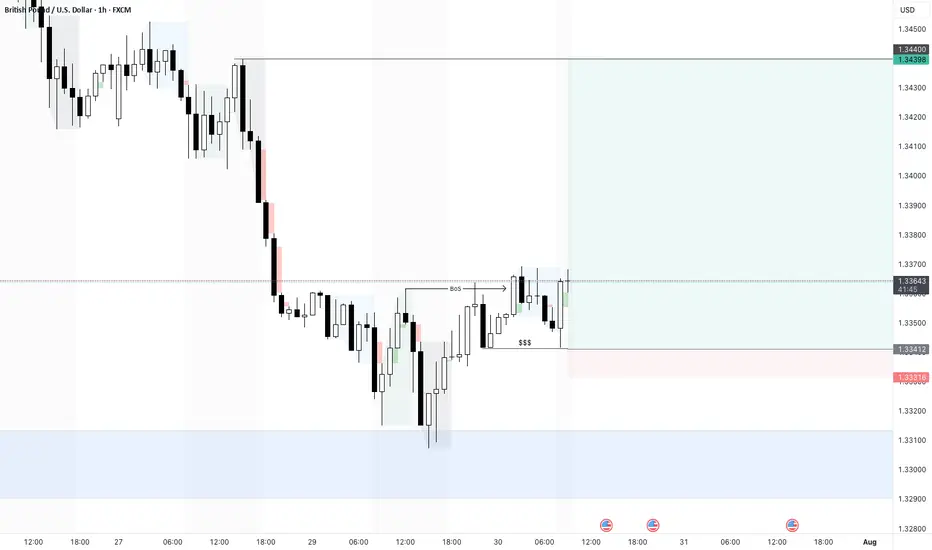
GBPUSD - 30/7/25 - PIvot to bullishYesterday price touched a HTF demand zone that i marked out and on the 1 hour formed a break of structure. This is as per my plan a pivot ore reversal sign.
Now trying to find an entry its trickier. Initially i wanted to enter higher up at the green imbalance that is there, but i noticed equal low liquidity marked as $$$ which i will assume will be taken out. I placed a buy-limit here with a tighter SL than i normally go for, but the TP is the next high.
Today is a high impact news day with the Fed releasing news later today -hence i will not take as many trades.
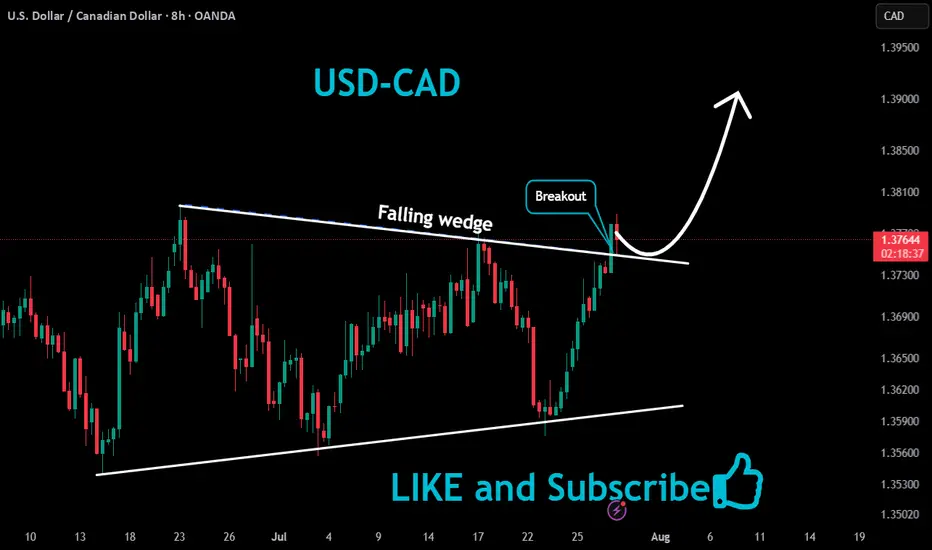
USDCAD Bullish Breakout!
HI,Traders !
#USDCAD was trading in a
Falling wedge pattern
But now we are seeing a
Bullish breakout so we
Will be expecting a
Further bullish move up !
Comment and subscribe to help us grow !
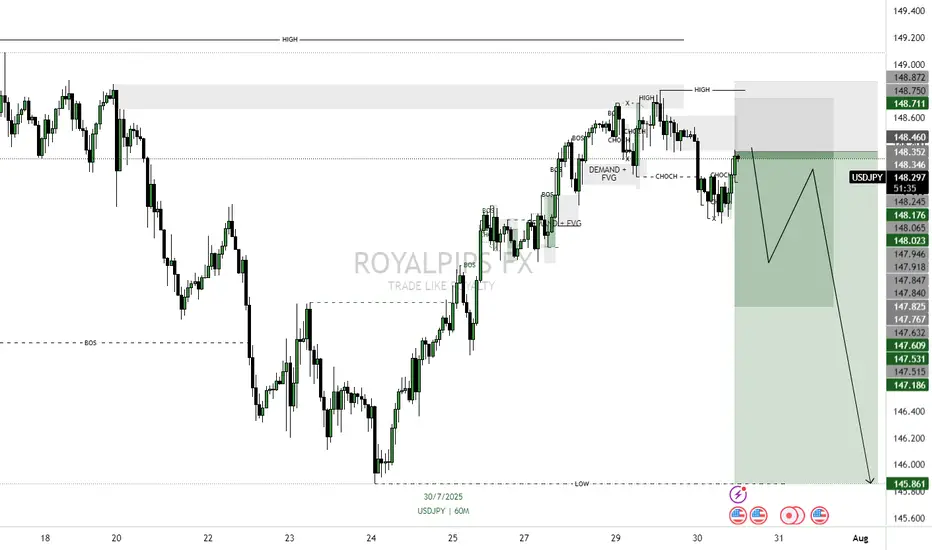
USDJPY POTENTIAL CONTINUATION AFTER A PULLBACK Price has returned to a higher time frame supply zone after a change in structure and is now showing signs of rejection following a pullback (retracement). The mitigation of the supply zone suggests that institutions may have filled their sell orders and are now ready to push price lower.
📉 Execution Plan:
• Entry: On lower timeframe BOS/CHOCH or strong bearish reaction after mitigation.
• SL: Just above the supply zone (allow breathing room).
• TP: Next demand zone or based on structure (e.g., swing low, imbalance fill).
• RR: Minimum 1:3, ideally 1:5 depending on refinement and volatility.
CADJPY - Bearish Rising WedgeHello Traders !
The CADJPY price formed a rising wedge pattern.
Currently, The support line is broken!
So, I expect a bearish move📉
_______________
TARGET: 106.955🎯

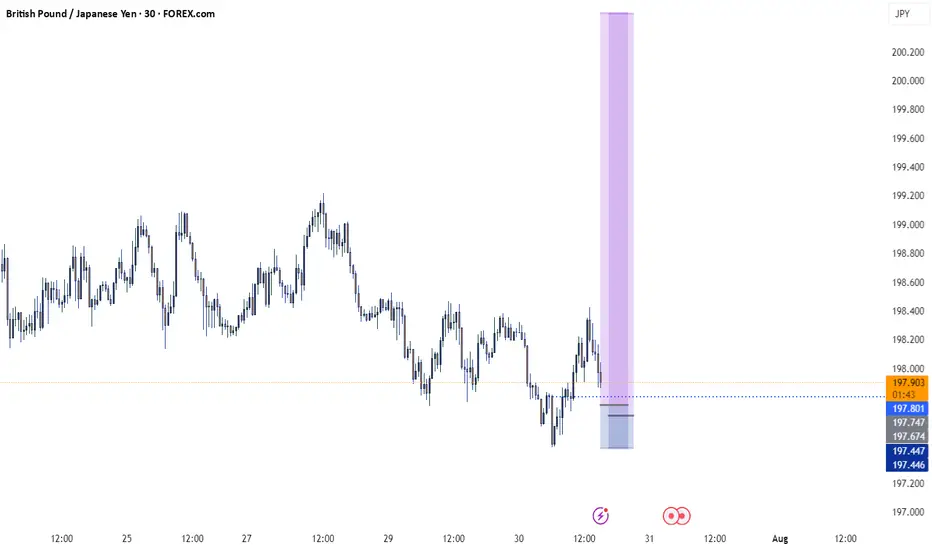
EURUSD Sell SetupHello traders!
Price has strong bearish momentum and is expected to move lower.
We're selling here with the target around the higher timeframe demand zone.
Manage your risk and trade safe!
EURUSDHello Traders! 👋
What are your thoughts on EURUSD?
EUR/USD kicked off the week with a sharp drop of nearly 200 pips, driven by renewed concerns over U.S. tariff policies. This strong bearish momentum signals intensified selling pressure across the board.
The pair is now approaching a support zone, which has previously triggered bullish reactions.
However, given the current strong bearish sentiment, there is a real risk this support may not hold.
Our bias remains bearish overall.
If the pair finds temporary support at this level, a short-term corrective bounce is possible.
But ultimately, we expect a continuation of the downtrend toward lower support levels after the correction completes.
Can this support zone stop the bleeding, or is more downside coming? Let us know your thoughts! 👇
Don’t forget to like and share your thoughts in the comments! ❤️