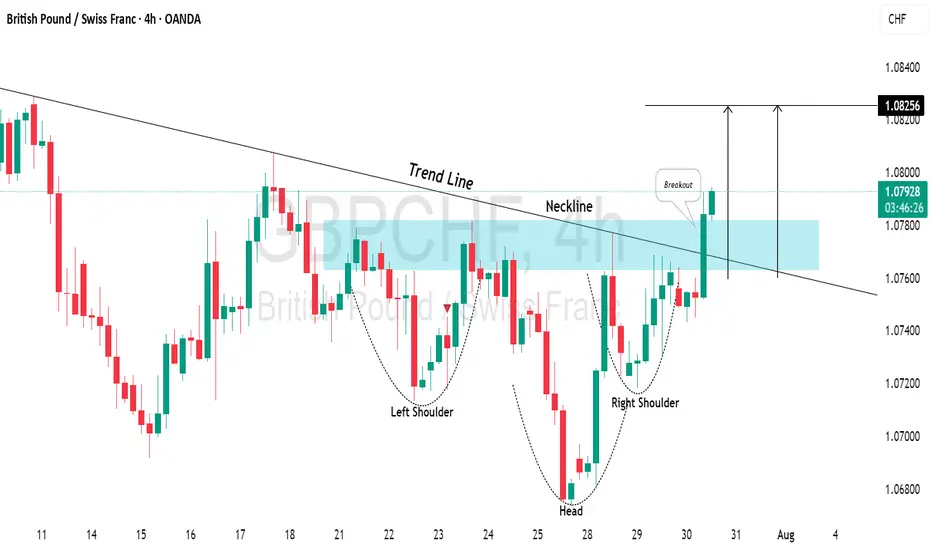
GBPCHF: Very Bullish OutlookI see 2 strong bullish confirmations on 📈GBPCHF on a 4H time frame.
The price has broken above a key descending trend line and the neckline of an inverted head and shoulders pattern.
This suggests a high likelihood of further upward movement, with the next resistance level at 1.0825.
Forex market
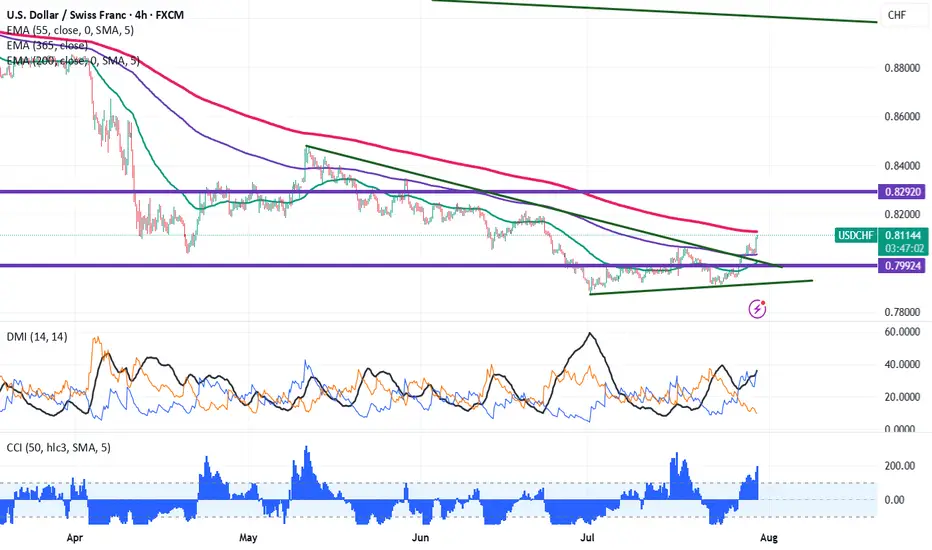
USD/CHF Smashes 0.8090 Resistance, good to buy on dips USDCHF breaks significant resistance 0.8090 on board-based US dollar buying. It hits an intraday high of 0.81058 and is currently trading around 0.081003.
Technical Analysis Points to Further Upside
The pair is trading above the 55-EMA, 200 EMA and below 365 EMA on the 4-hour chart, indicating a mixed trend. The immediate resistance is at 0.8135, any break above targets 0.8170/0.8215/0.8250.
Support Levels and Potential Declines
On the downside, near-term support is around 0.8060; any violation below will drag the pair to 0.8020/0.7980/0.7920/0.7860/0.7800.
Indicators (4-hour chart)
CCI (50) - Bullish
Directional Movement Index - Bullish
Trading Strategy Recommendation
It is good to buy on dips around 0.8090 with a stop-loss at 0.8058 for a TP of 0.8170/0.8215.
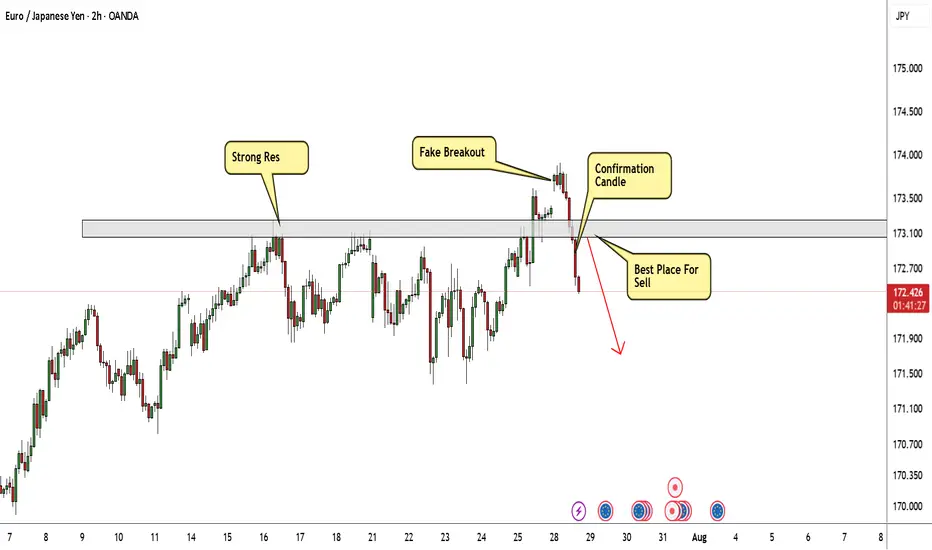
EUR/JPY Again Below My Res , Short Setup Valid To Get 150 Pips !Here is my opinion on EUR/JPY On 2H T.F , We have a fake breakout and Gap and the price back again below my res area and closed with 4H Candle below it , so i have a confirmation and i`m waiting the price to go back to retest this strong res and give me any bearish price action and then we can enter a sell trade and targeting 100 : 150 pips . if we have a daily closure above my res then this analysis will not be valid anymore .
update Idea GBPUSDthe reteset was good, is it clear previous fall, there is in screen nice setup 3 candles red called 3 crows blacks, only wait market -NY for continue trade
DeGRAM | EURUSD reached the lower boundary of the channel📊 Technical Analysis
● Price sliced through the channel mid-support and the inner trend-fan, closing below 1.1573; the break was retested (grey circle) and rejected, confirming a bear continuation from the sequence of lower-highs.
● The move unlocks the descending channel’s lower rail near 1.1450, while interim demand sits at the May pivot / 0.618 swing 1.1520.
💡 Fundamental Analysis
● EZ data underwhelmed (German Ifo, EZ consumer-confidence) just as Fed officials warned rates may stay “restrictive for longer,” widening the short-rate gap and refreshing USD bids.
✨ Summary
Short 1.1590-1.1615; hold below 1.1573 targets 1.1520 ➜ 1.1450. Bias void on an H1 close above 1.1660.
-------------------
Share your opinion in the comments and support the idea with a like. Thanks for your support!
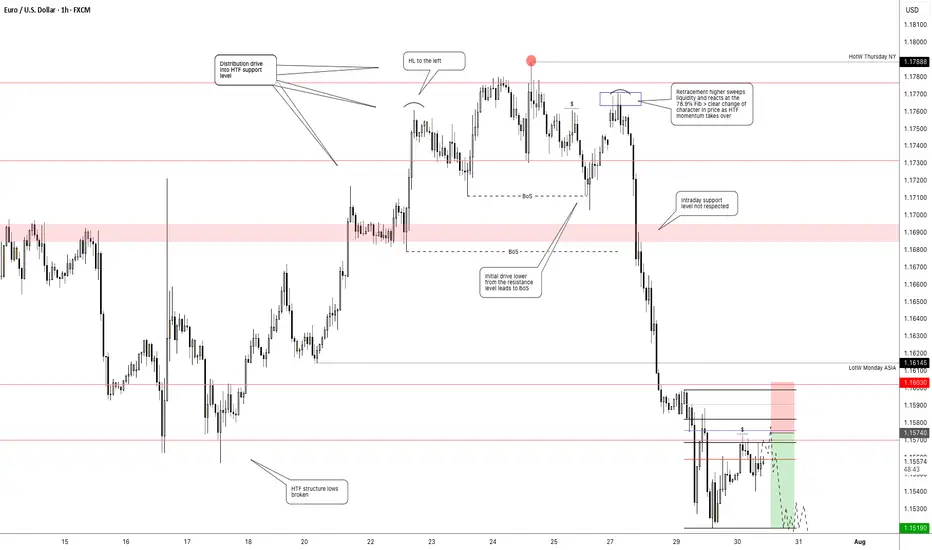
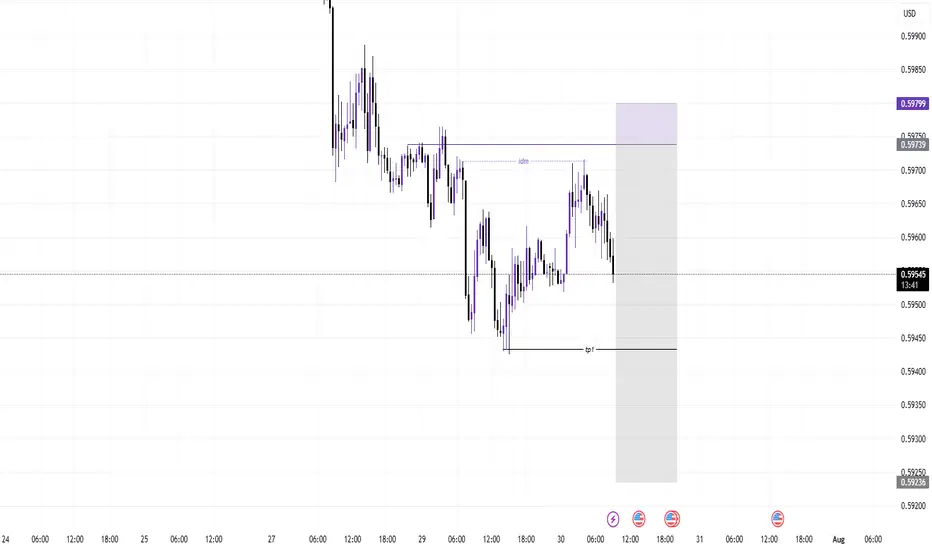
Getting short on EUR/USD!The dollar has looked set for a reversal and coming into the week it didn't hang around at all. I had a bit of a short bias on EUR/USD and was looking for confirmation signal which pretty much came at market open.
Price pushed higher back into the key level taking out a short term high, but was unable to follow through to form a new higher high. Heading into Monday London session, momentum immediately took hold with a clear bearish change of character and price didn't look back > breaking structure and key levels with minimal effort.
I was waiting for a pull back to get short early which didn't occur. But no need to chase price, waiting and patience is part of the game.
Price has now broken another key support level and is set to retest it as resistance. This will be my entry point (see screenshot) > using the 70.5%-78.6% fib retracement level and my stop above Tuesdays high. Keep it simple.
tradingview.sweetlogin.com/proxy-s3
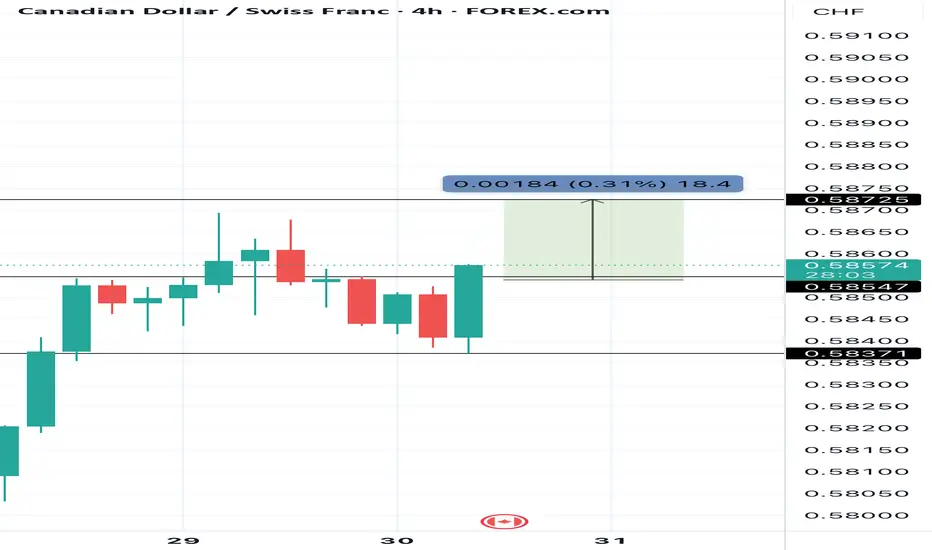
Congratulations CADCHF buy trade hit take profit.....
Congratulations CADCHF buy trade hit take profit.....
Congratulations to those of us that took this trade we just hit take profit now

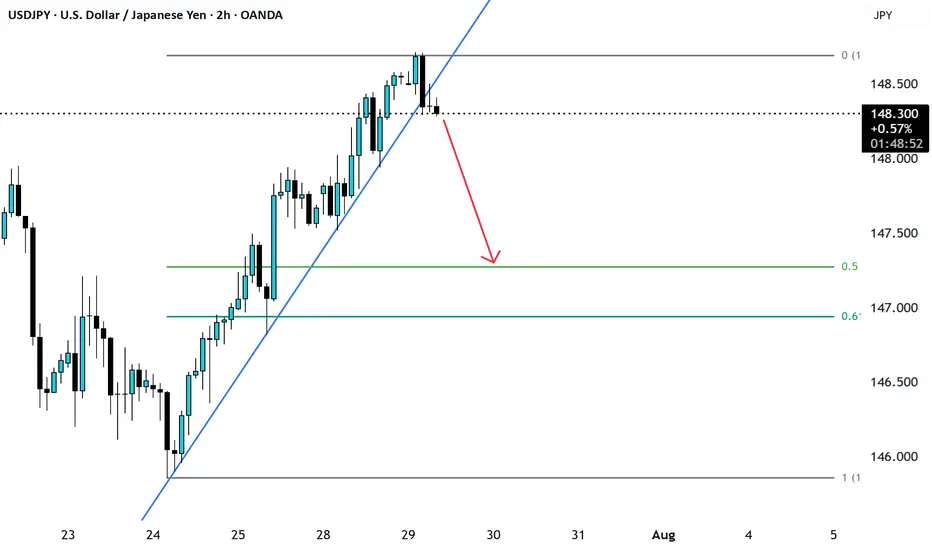
USDJPY broke the trendline support likely to go fib 0.5 levelUSDJPY was trading in uptrend and recently has broken the Support and is likely to have a correction till the fib 0.5 level.
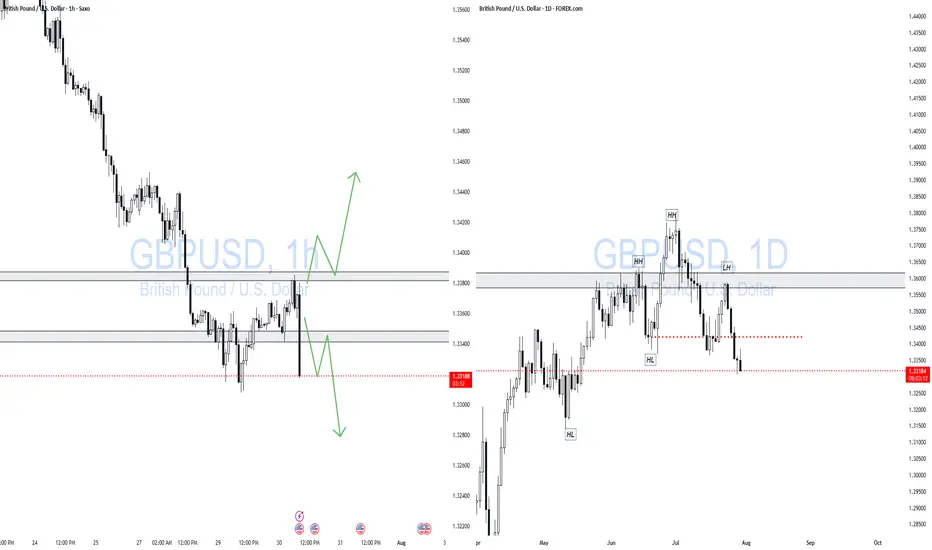
GBPUSD 1H / 1DWait for the price leave the consolidation zone.
If it comes out in Long, wait for the retest in the support and look to enter in Long.
If it goes short, wait for the Retest at resistance and look to go short.
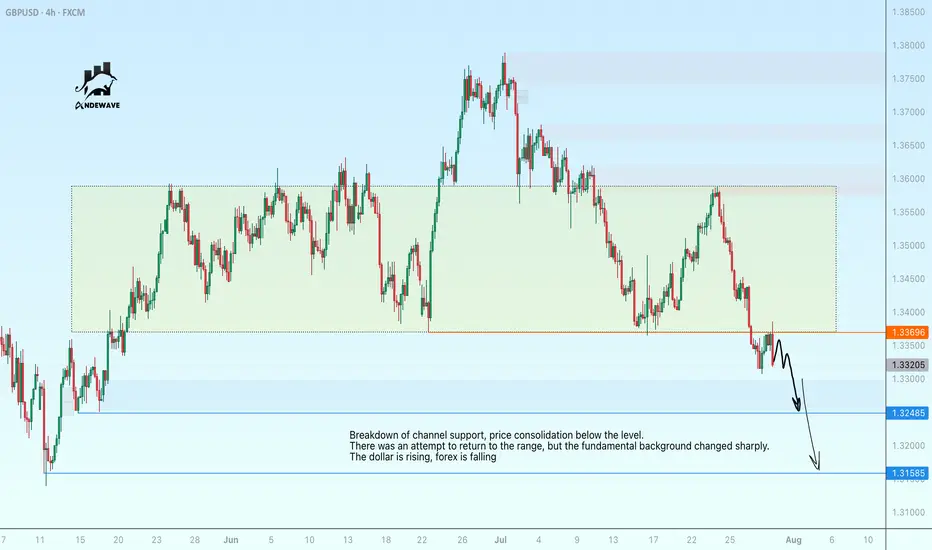
GBPUSD has consolidated in the selling zoneBreakdown of channel support, price consolidation below the level. There was an attempt to return to the range, but the fundamental background changed sharply. The dollar is rising, forex is falling.
GBPUSD may continue its local decline to 1.3158.
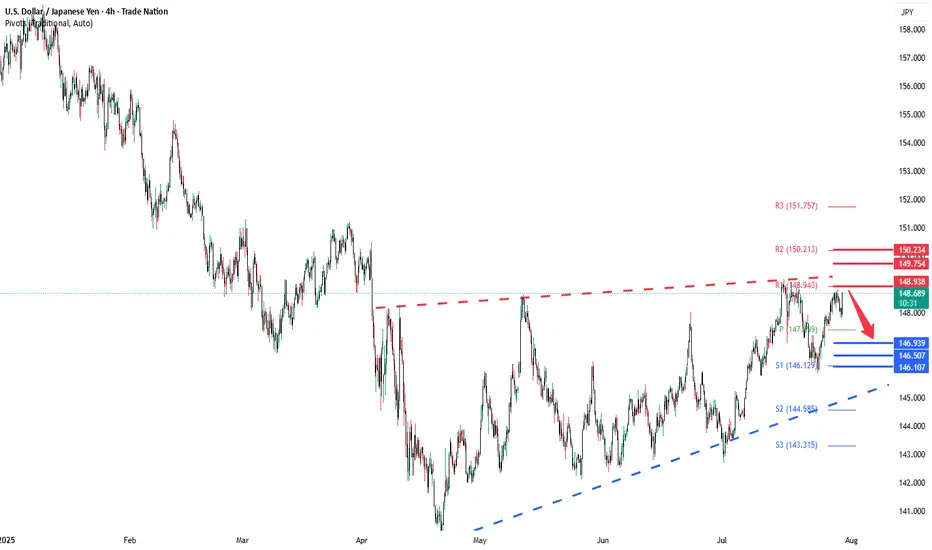
USDJPY rising wedge capped at 148,90The USDJPY pair is currently trading with a bearish bias, aligned with the broader downward trend. Recent price action shows a retest of the falling resistance, suggesting a temporary relief rally within the downtrend.
Key resistance is located at 149.90, a prior consolidation zone. This level will be critical in determining the next directional move.
A bearish rejection from 148.90 could confirm the resumption of the downtrend, targeting the next support levels at 146.93, followed by 146.50 and 146.10 over a longer timeframe.
Conversely, a decisive breakout and daily close above 148.93 would invalidate the current bearish setup, shifting sentiment to bullish and potentially triggering a move towards 149.75, then 150.20.
Conclusion:
The short-term outlook remains bearish unless the pair breaks and holds above 148.90. Traders should watch for price action signals around this key level to confirm direction. A rejection favours fresh downside continuation, while a breakout signals a potential trend reversal or deeper correction.
This communication is for informational purposes only and should not be viewed as any form of recommendation as to a particular course of action or as investment advice. It is not intended as an offer or solicitation for the purchase or sale of any financial instrument or as an official confirmation of any transaction. Opinions, estimates and assumptions expressed herein are made as of the date of this communication and are subject to change without notice. This communication has been prepared based upon information, including market prices, data and other information, believed to be reliable; however, Trade Nation does not warrant its completeness or accuracy. All market prices and market data contained in or attached to this communication are indicative and subject to change without notice.
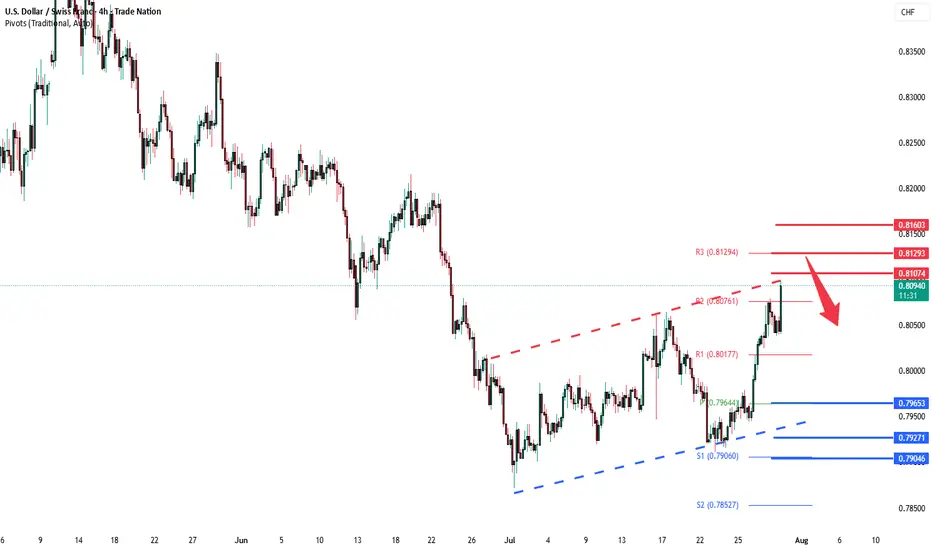
USDCHF oversold bounce backs capped at 0.8107The USD/CHF pair is currently trading with a bearish bias, aligned with the broader downward trend. Recent price action shows a retest of the falling resistance, suggesting a temporary relief rally within the downtrend.
Key resistance is located at 0.8107, a prior consolidation zone. This level will be critical in determining the next directional move.
A bearish rejection from 0.8084 could confirm the resumption of the downtrend, targeting the next support levels at 0.7965, followed by 0.7927 and 0.7900 over a longer timeframe.
Conversely, a decisive breakout and daily close above 0.8107 would invalidate the current bearish setup, shifting sentiment to bullish and potentially triggering a move towards 0.8130, then 0.8160.
Conclusion:
The short-term outlook remains bearish unless the pair breaks and holds above 0.8084. Traders should watch for price action signals around this key level to confirm direction. A rejection favours fresh downside continuation, while a breakout signals a potential trend reversal or deeper correction.
This communication is for informational purposes only and should not be viewed as any form of recommendation as to a particular course of action or as investment advice. It is not intended as an offer or solicitation for the purchase or sale of any financial instrument or as an official confirmation of any transaction. Opinions, estimates and assumptions expressed herein are made as of the date of this communication and are subject to change without notice. This communication has been prepared based upon information, including market prices, data and other information, believed to be reliable; however, Trade Nation does not warrant its completeness or accuracy. All market prices and market data contained in or attached to this communication are indicative and subject to change without notice.
GBPUSD Sell analysis/ideaThis trade/analysis is based on the daily and 4-hour timeframes and executed using reversal trading and trend formation. Complete explanation in the video!

My Trading Journal on GU 30.07.2025GBPUSD has reached a significant point of interest, showing a high level of accuracy with a Fair Value Gap on the higher time frame. This presents an excellent entry opportunity. Additionally, today is midweek, and there are high-impact events to consider. Keep an eye on it as the events unfold.

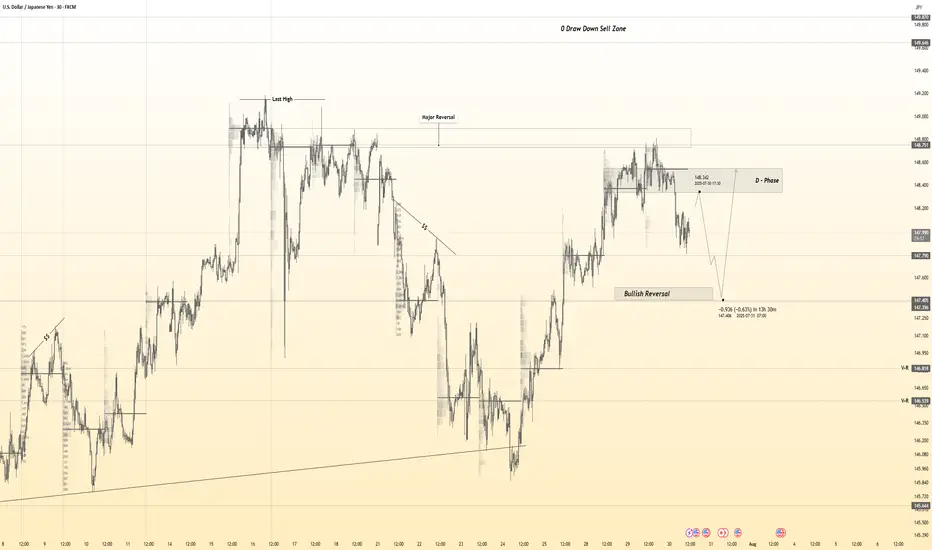
USDJPY 30Min Engaged (Buy & Sell Reversal Entry's Detected )Time Frame: 30-Minute Warfare
Entry Protocol: Only after volume-verified breakout
🩸Bullish Reversal - 148.350
🩸Bearish Reversal - 148.370
➗ Hanzo Protocol: Volume-Tiered Entry Authority
➕ Zone Activated: Dynamic market pressure detected.
The level isn’t just price — it’s a memory of where they moved size.
Volume is rising beneath the surface — not noise, but preparation.
🔥 Tactical Note:
We wait for the energy signature — when volume betrays intention.
The trap gets set. The weak follow. We execute.
NZDUSD SELL SETUPWaiting patiently for this on NZDUSD no much movements in the market this week, remember FOMC is coming today - Be watchful
USDCAD resistance breakout at 1.3767The USDCAD remains in a bullish trend, with recent price action showing signs of a corrective pullback within the broader uptrend.
Support Zone: 1.3730 – a key level from previous consolidation. Price is currently testing or approaching this level.
A bullish rebound from 1.3730 would confirm ongoing upside momentum, with potential targets at:
1.3830 – initial resistance
1.3860 – psychological and structural level
1.3890 – extended resistance on the longer-term chart
Bearish Scenario:
A confirmed break and daily close below 1.3730 would weaken the bullish outlook and suggest deeper downside risk toward:
1.3716 – minor support
1.3690 – stronger support and potential demand zone
Outlook:
Bullish bias remains intact while the WTI Crude holds above 1.3730. A sustained break below this level could shift momentum to the downside in the short term.
This communication is for informational purposes only and should not be viewed as any form of recommendation as to a particular course of action or as investment advice. It is not intended as an offer or solicitation for the purchase or sale of any financial instrument or as an official confirmation of any transaction. Opinions, estimates and assumptions expressed herein are made as of the date of this communication and are subject to change without notice. This communication has been prepared based upon information, including market prices, data and other information, believed to be reliable; however, Trade Nation does not warrant its completeness or accuracy. All market prices and market data contained in or attached to this communication are indicative and subject to change without notice.

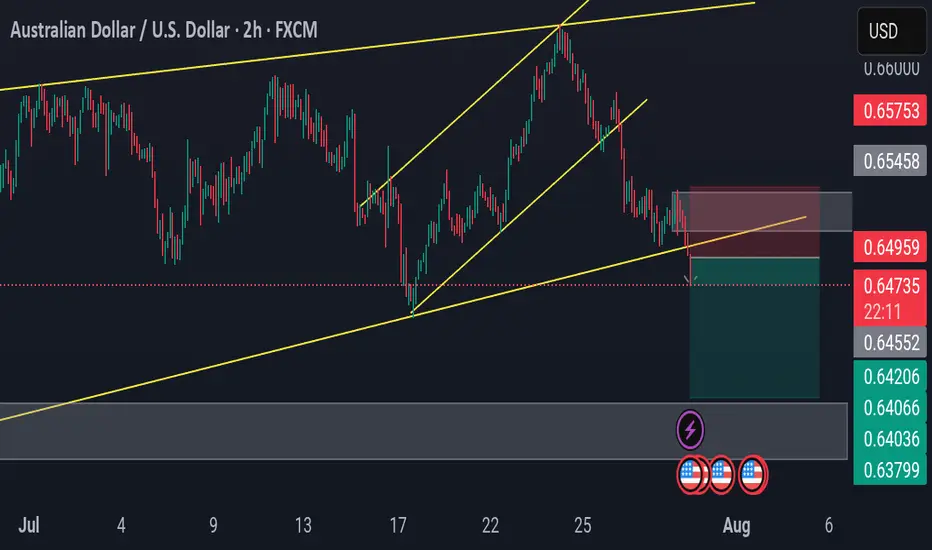
AUDUSD SHORT SETUP – BEARISH BREAK & RETEST📉 AUDUSD SHORT SETUP – BEARISH BREAK & RETEST
Price breaks below rising channel support and retests structure as new resistance. Clean rejection confirms bearish continuation bias.
🔻 Entry: 0.6495
🎯 Targets: 0.6420 → 0.6400 → 0.6370
🛑 SL: 0.6545
⏰ TF: 2H
📊 Bias: Bearish
Technical confluence aligns with momentum shift—waiting for follow-through to key demand zone.
#AUDUSD #ForexSignals #PulseTradesFX
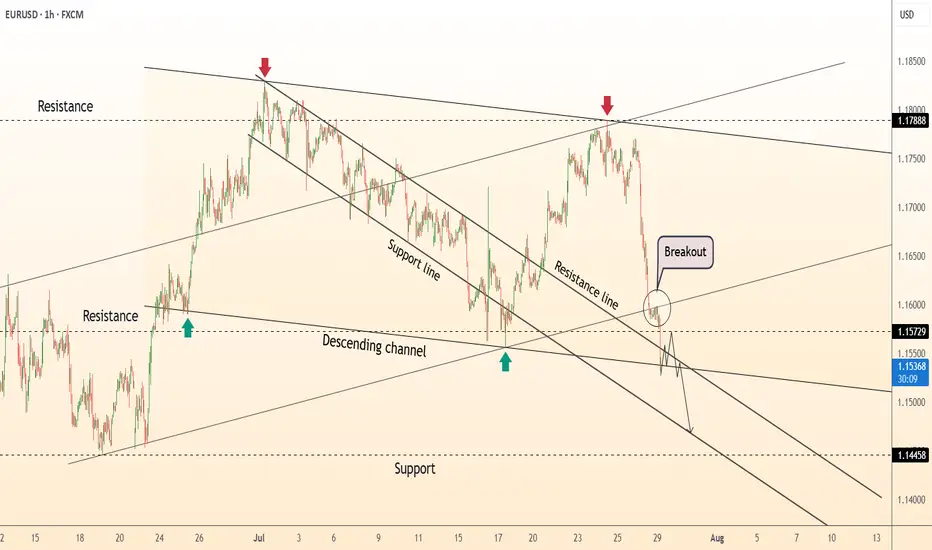
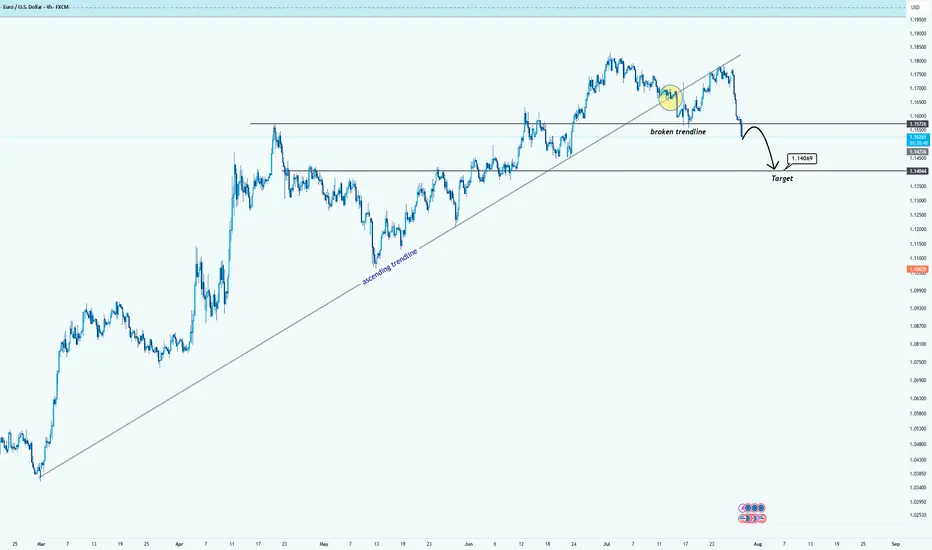
EURUSD Breaks Trendline: Bearish Momentum in PlayHello guys!
After months of climbing steadily along the ascending trendline, EURUSD has finally broken below support. The trendline breach, followed by a tight consolidation (yellow circle), hinted at a loss of bullish strength, and now the breakdown is in full motion.
Broken ascending trendline
Clear rejection after retest
Bearish continuation underway
Target area: 1.1400–1.1440 zone
If sellers maintain control, the price could descend toward the next major demand area.
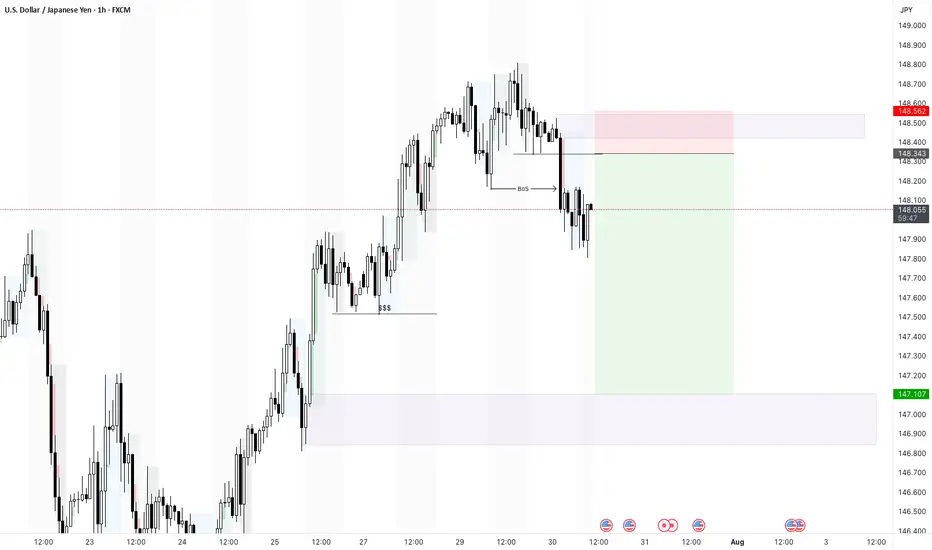
USDJPY - 30/7/25 - BoS to a bearish pull backI dont normally trade USDJPY but i see a setup based on my strategy. The price was climbing to take out a previous high on the 4H and Daily TF. But on the hourly there is a clear BoS which suggests that there may be a pull back even though the HTF bias is still bullish.
+ve:
1. there is a BoS on the 1 hour chart
2. Equal low liquidity just below which will draw price to this zone
3. Big imbalance below the equal low liquidity
-ve:
1. Fed news today may push the market against my trade idea
CADCHF buy for quick scalping trade position CADCHF buy for quick scalping trade position .... just looking to scalp this for a strong strength movement here
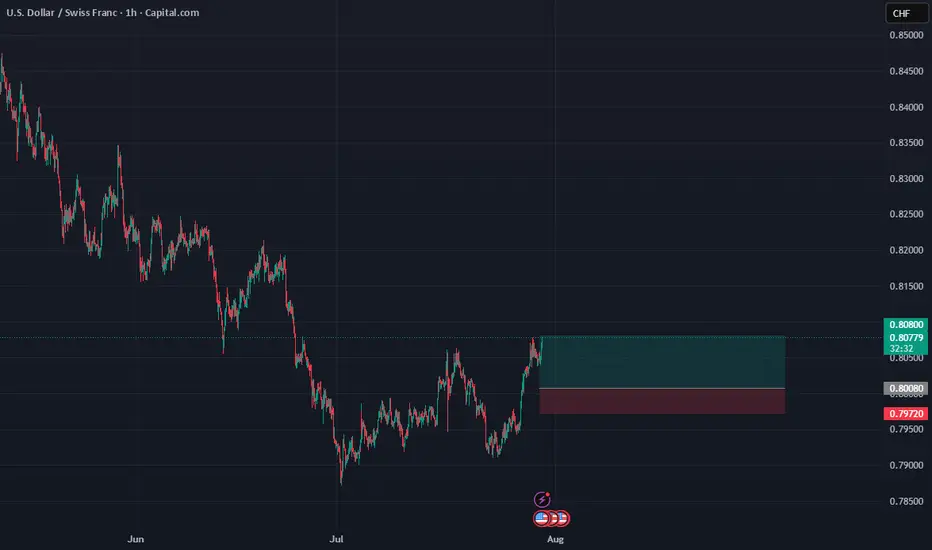
USD/CHFUSD/CHF Overview:
After a downward correction in recent weeks, the USD/CHF pair appears to be finding some support around the 0.80000 - 0.79800 levels. We are observing signs of price consolidation, which could indicate a potential bullish bounce.
Trade Details (Pending Order):
Order Type: Buy Limit
Entry Point: 0.80080
This point was chosen based on a previous support area and the price's attempt to consolidate above it.
Stop Loss (SL): 0.79720
The stop loss is located below a clear local low and below the psychological support level of 0.80000 to provide adequate protection.
Take Profit (TP): 0.80800
This level targets a retest of a previous resistance area, or as a conservative target for the first bullish bounce.
Risk Management:
Distance to Stop Loss: 36 pips (0.80080 - 0.79720)
Distance to Take Profit: 72 pips (0.80800 - 0.80080)
Risk-to-Reward Ratio (R:R): 1:2
This ratio is considered excellent and provides a good opportunity for profit compared to the potential risk.
Additional Considerations:
Traders are monitoring upcoming economic data from the United States and Switzerland.
A decisive break above 0.79720 could invalidate this idea, while a break above 0.80800 could open the door to further upside.
Disclaimer:
This is merely an analytical trading idea and is not intended as investment advice. Please manage your risk consciously and conduct your own research before making any trading decisions.
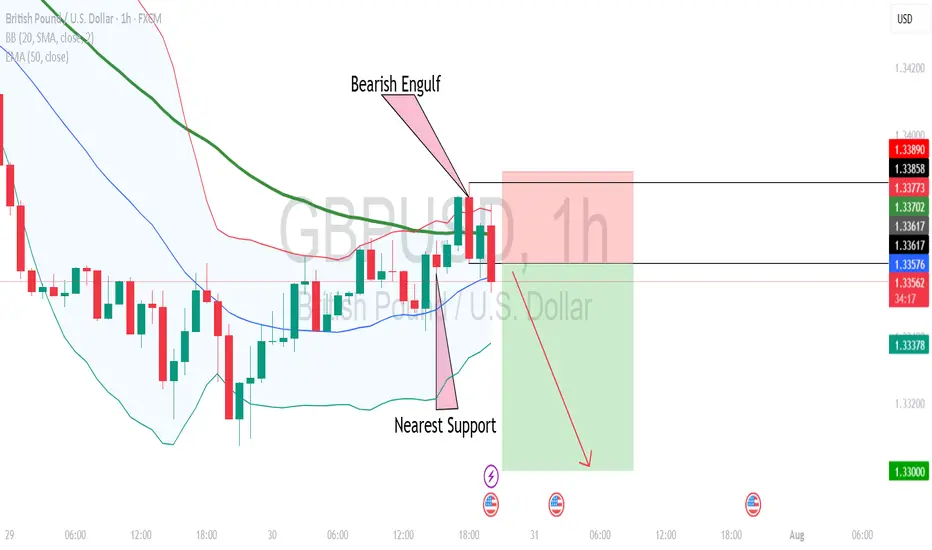
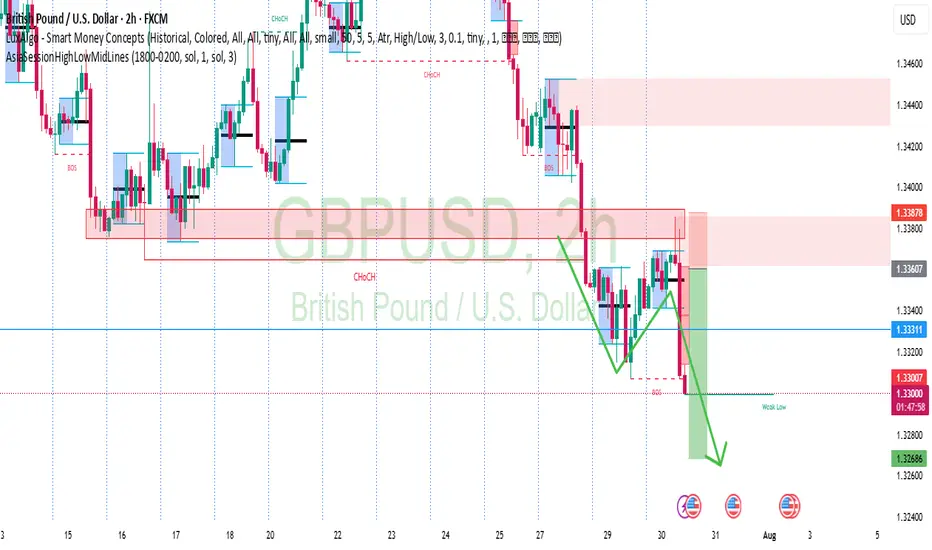
GBPUSD will resume downtrendA healthy pullback observed during Asian & Europe session.
I'm expecting a down move during US session.
Bearish engulf candle already forming. Waiting price to break nearest support @1.33617 for bearish confirmation.
my intraday target will be round number 1.33000.
please calculate your own risk & reward.
Good Luck