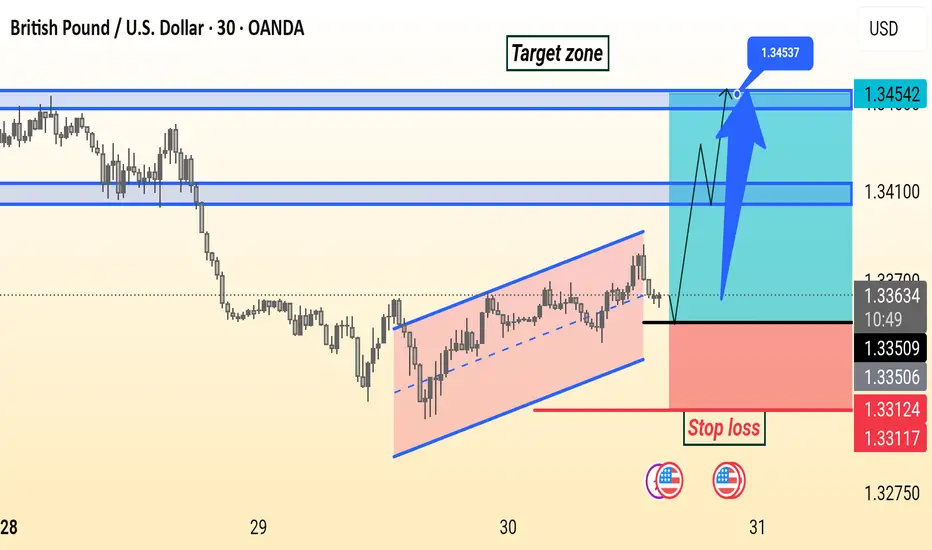
GBPUSD Setup GBP/USD is forming a bullish channel on the 30-minute chart. Price is expected to break above resistance near 1.3365, targeting the 1.3455 zone. Stop loss is set below the channel at 1.3312.
Forex market
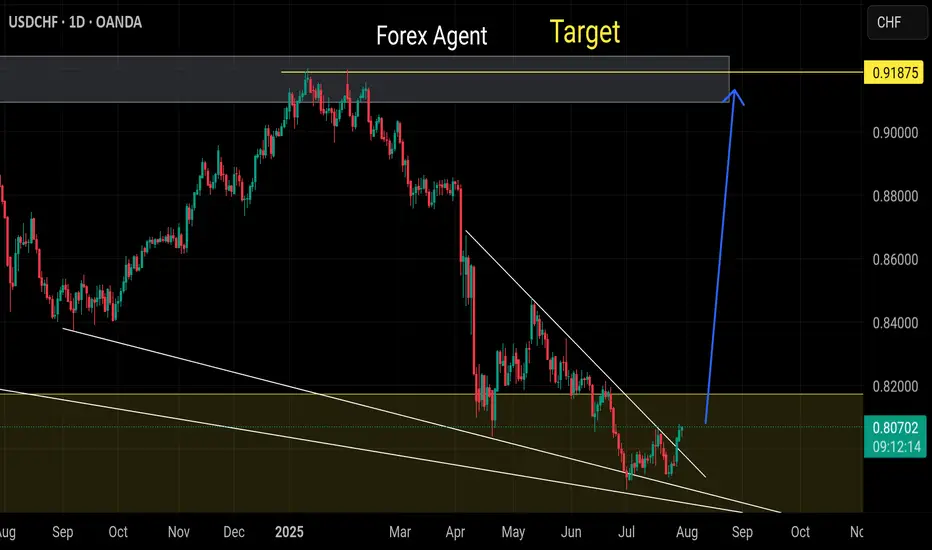
Buy usdchf Our last buying idea already running 150+ pips
In our view more buying expected
Almost totally trend changed as dollar gonna strong among all Cross pairs
Inner down trend breaks
Monthly still oversold
EURUSDEUR/USD Exchange Rate
Current Rate: About 1.1525
Government Bond Yields
U.S. 10-Year Treasury Yield: 4.328%
Eurozone 10-Year Government Bond Yield: Last reported at 2.686%
Economic Data Reports for Today
U.S. Data:
1:15pm
USD
ADP Non-Farm Employment Change
82K -33K
1:30pm
USD
Advance GDP q/q
2.4% -0.5%
USD
Advance GDP Price Index q/q
2.3% 3.8%
3:00pm
USD
Pending Home Sales m/m
0.3% 1.8%
3:30pm
CAD
BOC Press Conference
USD
Crude Oil Inventories
-3.2M
7:00pm
USD
Federal Funds Rate
4.50% 4.50%
USD
FOMC Statement
7:30pm
USD
FOMC Press Conference
Market Focus Today: The Federal Reserve announces its policy decision.
Eurozone Data:
GDP Growth (Q2): Eurostat reports second-quarter growth at 0.1% quarter-on-quarter (QoQ) and 1.4% year-on-year (YoY). Germany and Italy contracted by 0.1% QoQ, France rose 0.3%, and Spain outperformed at 0.7%.
Outlook: The Eurozone economy faces headwinds from new U.S. tariffs and tepid industrial output, though Q2 was somewhat better than feared.
Current Interest Rates
Area Main Rate (July 2025) Policy Outlook
U.S. 4.25% – 4.50% Fed expected to hold steady
EU 2.15% (main refi rate) ECB in data-dependent pause
2.00% (deposit rate)
U.S.: The Federal Reserve is widely expected to hold rates in the 4.25%–4.50% range at today's FOMC meeting, reflecting a cautious approach in light of current growth and inflation figures.
Eurozone: The ECB last held its main refinancing rate at 2.15% and the deposit facility at 2.00% as of the July 24, 2025 meeting, emphasizing a meeting-by-meeting, data-driven stance.
Key Takeaways
EUR/USD is subdued just above 1.15 as the euro weakens on modest Eurozone growth and broad dollar strength ahead of the Fed.
10-year yields remain elevated in both regions, reflecting stable but cautious outlooks.
Today’s U.S. and ECB meetings/data are critical: Markets are watching for central bank reactions to new economic data and the ongoing effects of tariffs and global uncertainty.
This overview captures the most significant developments relevant to currency, rates, bonds, and economic trends for July 30, 2025.
#EURUSD #DOLLAR #EURO

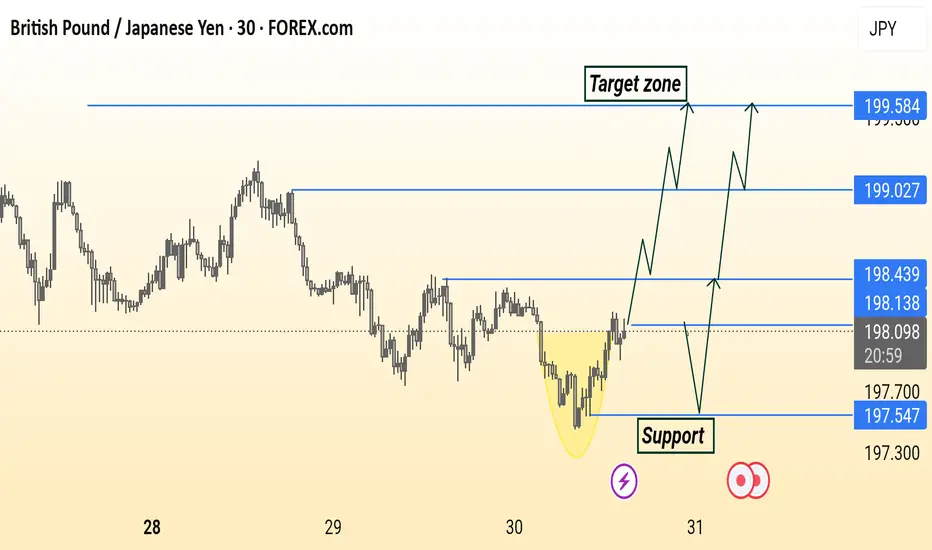
GBP/JPY Analysis is Ready Read The Captions GBP/JPY 30-minute chart shows a potential bullish reversal from a rounded bottom pattern. Price is approaching support around 198.13–197.54, with multiple possible bullish scenarios targeting resistance levels at 198.43, 199.03, and 199.58. The highlighted “Target zone” suggests a continuation if price breaks and holds above key resistance.
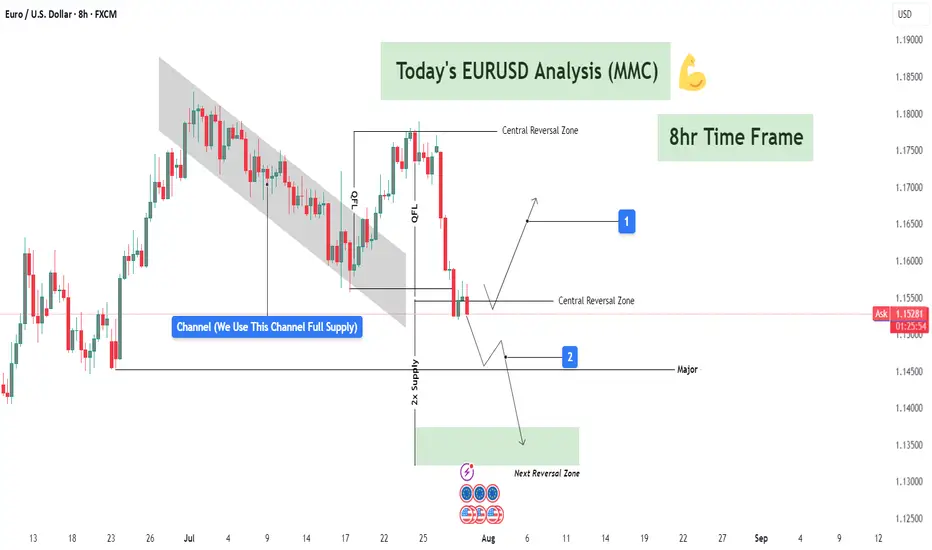
EURUSD Analysis – Supply Zones & Reversal Opportunities (MMC)Today’s EURUSD analysis focuses on identifying major supply zones, potential reversal points, and directional bias using the Mirror Market Concept (MMC) on the 8-hour timeframe.
1️⃣ Market Structure & Channel Supply Zone
The market recently formed a descending channel 📉, acting as a full supply zone where sellers dominated.
Every time price touched the upper boundary of this channel, we saw bearish reactions, proving this zone as a strong liquidity grab area.
Breakdown from the channel: After repeated attempts to break the channel to the upside, sellers regained control, pushing EURUSD lower and confirming bearish momentum.
2️⃣ Central Reversal Zone (Decision Point) ⚖️
Currently, price is consolidating around the Central Reversal Zone.
This zone is crucial because it can act as:
Reversal Point 🟢: If buyers step in aggressively, we might see a bullish leg toward previous swing levels, targeting resistance zones.
Continuation Zone 🔻: If sellers maintain pressure and break below this level, momentum will shift strongly bearish, aiming for deeper support.
Price behavior here will define short-term direction. Traders must wait for confirmation before committing to large positions.
3️⃣ Next Major Reversal Zone (High-Probability Demand) 🟩
Marked in green, this zone is expected to attract buyers if the current level fails.
Historically, these areas show high liquidity grabs and institutional activity.
If price reaches this zone, we expect significant bullish interest, making it a high-probability reversal area for medium-term buy setups.
4️⃣ Trade Scenarios
Scenario 1 (Bullish Reaction 🟢):
Price bounces from the Central Reversal Zone.
Possible targets: Previous structure highs inside the channel break zone.
Scenario 2 (Bearish Continuation 🔻):
Price fails to hold above and breaks lower.
Target: Next Major Reversal Zone for fresh liquidity accumulation.
5️⃣ Trading Approach & Risk Management 🛡️
Aggressive Approach: Intraday traders can scalp inside the Central Reversal Zone but must keep tight stop-losses to avoid fake-outs.
Conservative Approach: Wait for a clean break and retest confirmation, especially near the Next Reversal Zone for high-probability trades.
Maintain risk-to-reward (RR) ≥ 1:2 and avoid emotional trading during reversal attempts.
Summary:
EURUSD is at a critical juncture. The current market structure shows a bearish tone, but the Central Reversal Zone can still cause a temporary bullish reaction. A failure to hold will open the path toward the green reversal demand zone, where major buyers are likely to appear.
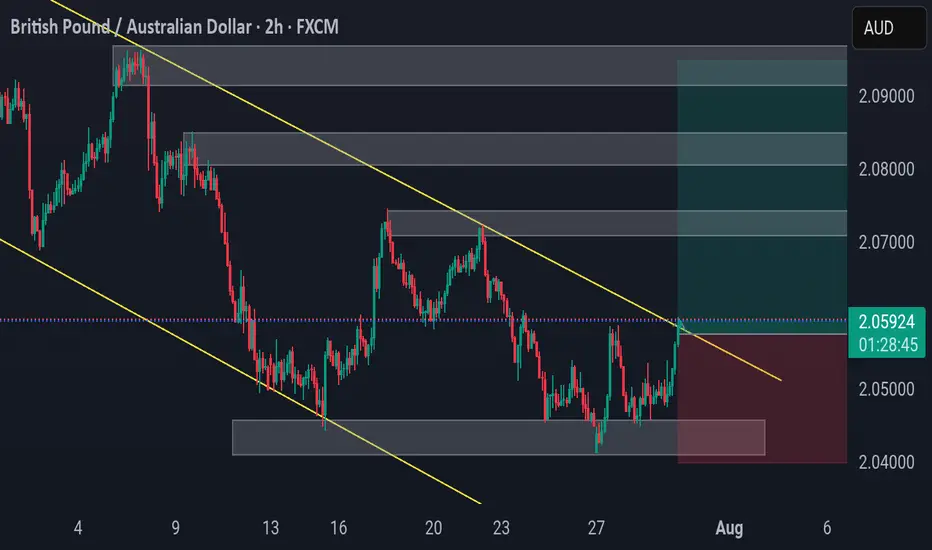
GBPAUD 2H – Clean Breakout SetupGBPAUD 2H – Clean Breakout Setup
Price has broken out of a descending channel and is retesting structure. Demand zone held firm, and bullish momentum is building.
Setup by PULSETRADESFX
T g.
#ForexSignals #GBPAUD #BreakoutTrade #RiskManagement #PulseTradesFX
CADCHF 60/15 Pullback LongOverall up trend. Looking for a pullback, then long. But if break market shift line, then will start looking for short.

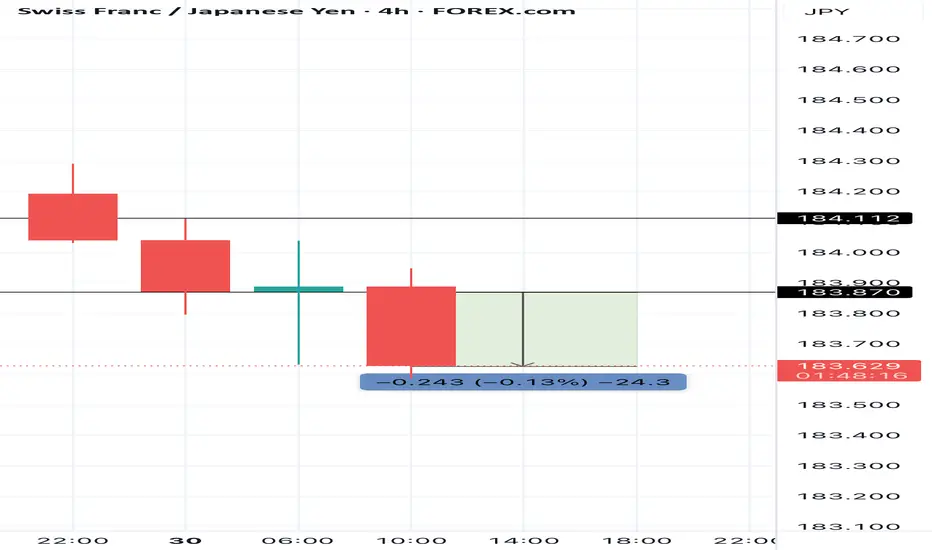
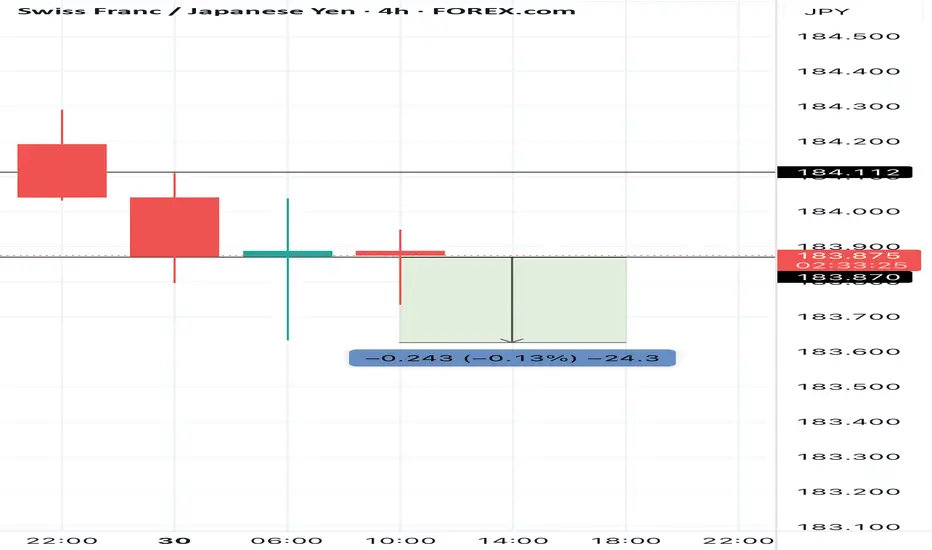
Congratulations CHFJPY profit hit Two scalping positions today all hit take profit we are good for today
Short idea!Hello all. after reversing from an LOZ market needs a very special zone for reaction. It would be a Broken Retraced zone and it is right here. be happy (wink)

Buy usdcadOur last buying idea already running 100+ pips in buy
In my view usdcad ready to break this resistance
It can be today and next month candel
Weekly and monthly already oversold pair
AUDJPY - Looking To Sell Pullbacks In The Short TermM15 - Strong bearish move.
No opposite signs.
Currently it looks like a pullback is happening.
Expecting bearish continuation until the two Fibonacci resistance zones hold.
If you enjoy this idea, don’t forget to LIKE 👍, FOLLOW ✅, SHARE 🙌, and COMMENT ✍! Drop your thoughts and charts below to keep the discussion going. Your support helps keep this content free and reach more people! 🚀
--------------------------------------------------------------------------------------------------------------------

EURUSD: Target Is Down! Short!
My dear friends,
Today we will analyse EURUSD together☺️
The price is near a wide key level
and the pair is approaching a significant decision level of 1.15428 Therefore, a strong bearish reaction here could determine the next move down.We will watch for a confirmation candle, and then target the next key level of 115186..Recommend Stop-loss is beyond the current level.
❤️Sending you lots of Love and Hugs❤️

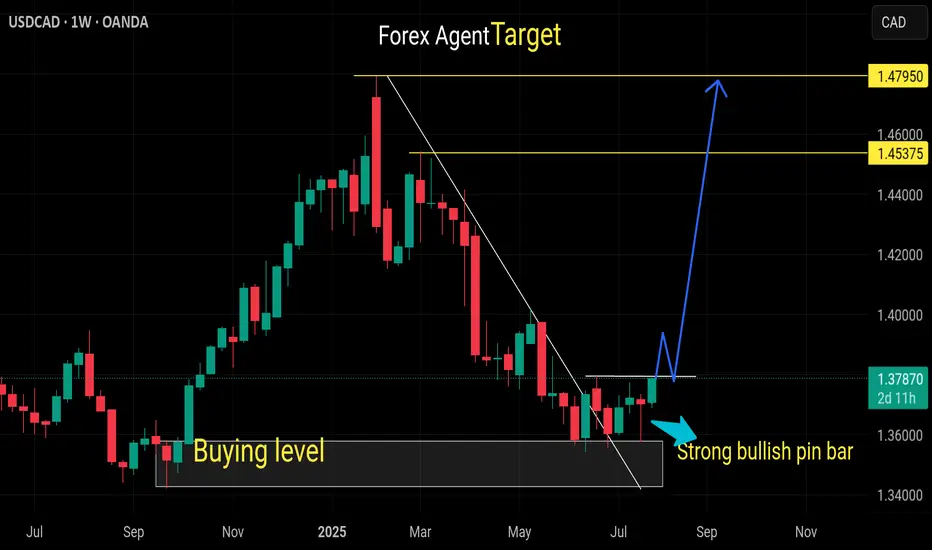
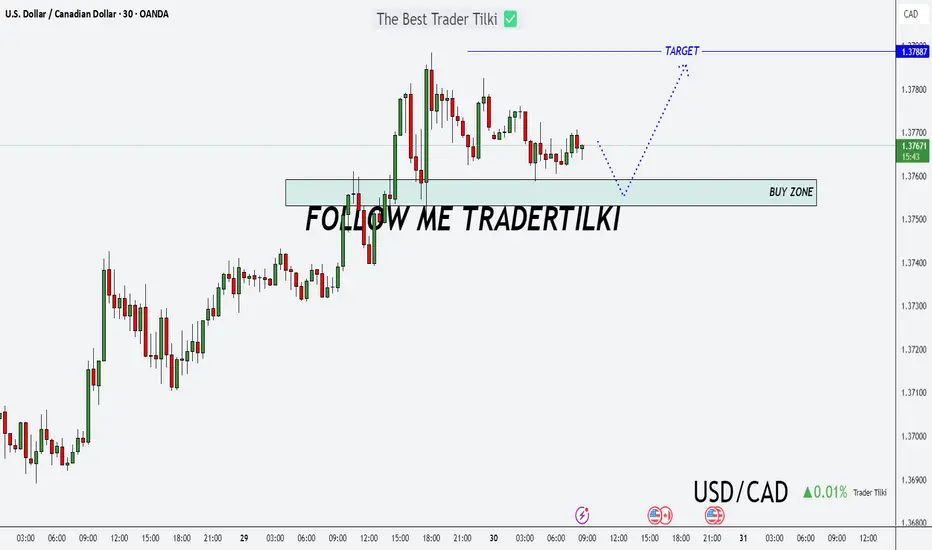
A New Day, A New Opportunity: USDCAD Buy StrategyGood morning Traders,
USDCAD has reached a key support zone between 1.37531 and 1.37592.
I'm opening a buy position from this level, aiming for the 1.37887 target.
Feel free to adjust your stop-loss based on your own margin and risk tolerance.
Your likes are my biggest source of motivation when sharing analysis. Thanks to everyone who supports with a simple like!
CHFJPY quick sell for a scalping position CHFJPY quick sell for a scalping position . We are taking this trade based on a quick scalping ok
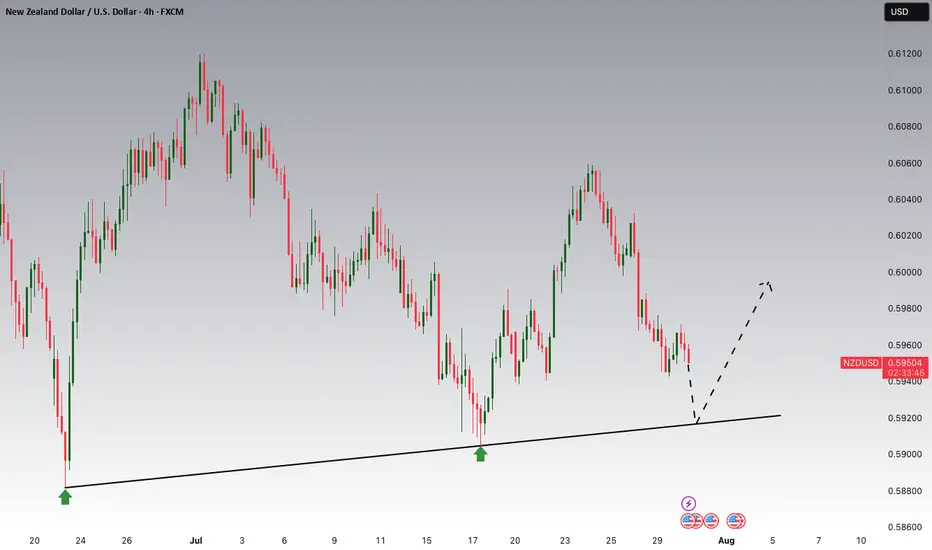
NZDUSD Potential UpsidesHey Traders, in today's trading session we are monitoring NZDUSD for a buying opportunity around 0.59200 zone, NZDUSD is trading in an uptrend and currently is in a correction phase in which it is approaching the trend at 0.59200 support and resistance area.
Trade safe, Joe.
USDJPY Forming Bullish Reversal | MMC Analysis + Target🧠 Chart Overview (2H Timeframe)
🔸 1. Head and Shoulders Inverse Pattern – MMC Bullish Blueprint
The chart beautifully shows an Inverse Head & Shoulders pattern, one of the most powerful reversal signals under MMC logic:
Left Shoulder: Formed after the initial drop and quick recovery.
Head : Deep liquidity grab and reversal from the lowest point (demand zone).
Right Shoulder: Higher low structure, indicating reduced selling pressure and shift in momentum.
This pattern is forming around a previous liquidity zone, which makes it more valid and aligned with smart money behavior.
🔸 2. Retesting Zone – Critical MMC Demand Area
Price is now retesting a highlighted demand zone, which acted as the springboard for the previous bullish move:
Bullish Pattern marked aligns with MMC’s concept of “Return to Origin”.
This zone also sits just above the right shoulder, confirming that buyers are defending aggressively.
If this level holds, we may see a strong continuation move to the upside.
🔸 3. Previous Reversal Zone (Supply) – Next Target Area
Marked in light green, this area is the next critical resistance:
Acts as liquidity target for institutions if price rallies.
Historically acted as a major reversal point.
Price is likely to show reactions or profit-taking behavior here.
Once broken and retested, it becomes a new support for further upside continuation (as marked on the chart).
🔸 4. Dual Scenarios – Bullish vs Bearish Pathways
Your chart correctly outlines two strategic possibilities:
✅ Bullish Scenario:
Price respects demand zone.
Breaks above previous reversal zone (149.000+).
Bullish continuation toward 149.800–150.500 range.
MMC tip: “If it goes bullish, use previous demand or double it” = Add confluence or stack demand zones for scale-in entries.
❌ Bearish Scenario:
If price breaks below retesting zone, bullish invalidation triggers.
Look to the previous all supply zone (Zone Pattern Must) for next reaction.
This scenario reflects smart money rejection of upside continuation.
🗂️ MMC Structural Elements Identified:
Zone/Pattern Role in Analysis
Inverse H&S Trend reversal signal
Retesting Zone Demand/entry area
Previous Reversal Zone First key resistance / next liquidity pool
Supply Zone Below Target in case of downside breakdown
MMC Logic Follow price structure, fakeouts, demand/supply traps
📈 Summary Outlook:
USDJPY is showing a technical bullish structure backed by MMC-based price psychology. The current pullback into a demand zone gives traders an excellent R:R opportunity for long positions, targeting higher zones upon breakout confirmation.
🟩 If bullish, breakout >149.000 will likely lead toward 150.000+
🟥 If bearish, breakdown <147.600 opens doors to deeper drop toward 146.000 zone (watch for reversal pattern).
🔑 Key Levels to Watch:
Type Level Range Notes
Support 147.600–147.800 Current retesting demand
Resistance 148.800–149.300 Previous Reversal Zone (Profit booking area)
Higher Resistance 150.500+ Final upside objective
Breakdown Zone <147.500 Flip to bearish scenario

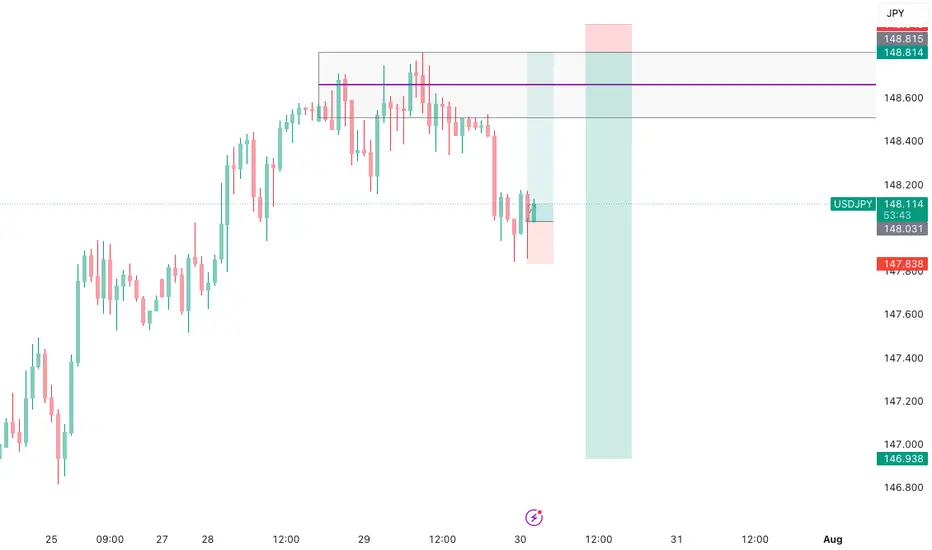
USDJPY – Liquidity Grab Before Continuation Down
**📉 USDJPY – Liquidity Grab Before Continuation Down**
📍 *Update to previous publication*
Following further technical analysis, the current price action suggests a **short-term bullish move** on USDJPY — likely acting as a **liquidity grab over previous session highs**.
This corrective movement is expected **before price resumes its broader bearish direction**.
🔍 Key observations:
* Price may seek short-term buy-side liquidity above recent highs.
* Liquidity engineering likely, especially around the **148.800 zone**.
* My **bias remains bearish**, but only **after liquidity is taken** and structure confirms a reversal.
Waiting for signs of exhaustion or confirmation around the upper FVG to align with the primary short thesis.
---DO NOT USE AS SIGNAL OR ANY OF A KIND--
EMERSON MASSAWE
COO | FINANCIAL MARKET ANALYST 6+
GBP/USD Technical Breakdown – Bearish Reversal in PlayWe're closely watching the British pound vs the US dollar on the daily chart, and recent developments are signaling a notable shift in momentum:
🔹 Break of the 2025 uptrend
🔹 Completion of a Head & Shoulders top — a classic bearish reversal pattern
🔹 Neckline break confirms downside risk
This formation implies a measured move target from ~1.34–1.38, projecting a decline of 400 pips to around 1.30, aligning neatly with the 200-day moving average at 1.2977.
🧭 Trading Strategy:
While the initial breakdown is bearish, the RSI shows bullish divergence, suggesting a short-term bounce before resumption of downside.
Key resistance levels to watch for re-entry opportunities:
• 📌 1.3435 – previous highs (late 2024)
• 📌 1.3485 – broken uptrend
• 📌 1.3510 – 55-day moving average
• 📌 1.3530 – short-term downtrend line
🎯 A rally into this zone would offer a strategic entry point for downside exposure.
Let us know how you're trading this move — are you fading the rally or waiting for confirmation?
Disclaimer:
The information posted on Trading View is for informative purposes and is not intended to constitute advice in any form, including but not limited to investment, accounting, tax, legal or regulatory advice. The information therefore has no regard to the specific investment objectives, financial situation or particular needs of any specific recipient. Opinions expressed are our current opinions as of the date appearing on Trading View only. All illustrations, forecasts or hypothetical data are for illustrative purposes only. The Society of Technical Analysts Ltd does not make representation that the information provided is appropriate for use in all jurisdictions or by all Investors or other potential Investors. Parties are therefore responsible for compliance with applicable local laws and regulations. The Society of Technical Analysts will not be held liable for any loss or damage resulting directly or indirectly from the use of any information on this site.

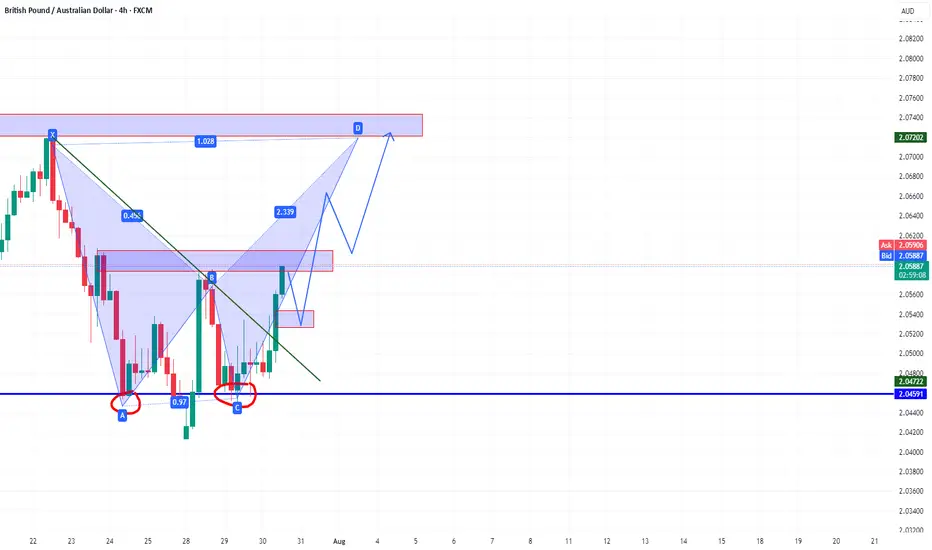
GBPAUD bullish potentialGBPAUD is showing bullish potential after forming a double bottom around the key support zone at 2.0459. A bullish harmonic pattern is unfolding, with a potential move toward the 2.0720–2.0740 resistance zone. The break of the downtrend line adds confirmation, and a pullback to 2.0530–2.0550 could offer a good re-entry area. As long as price stays above 2.0450, the bullish setup remains valid. The key target is the harmonic D completion zone.
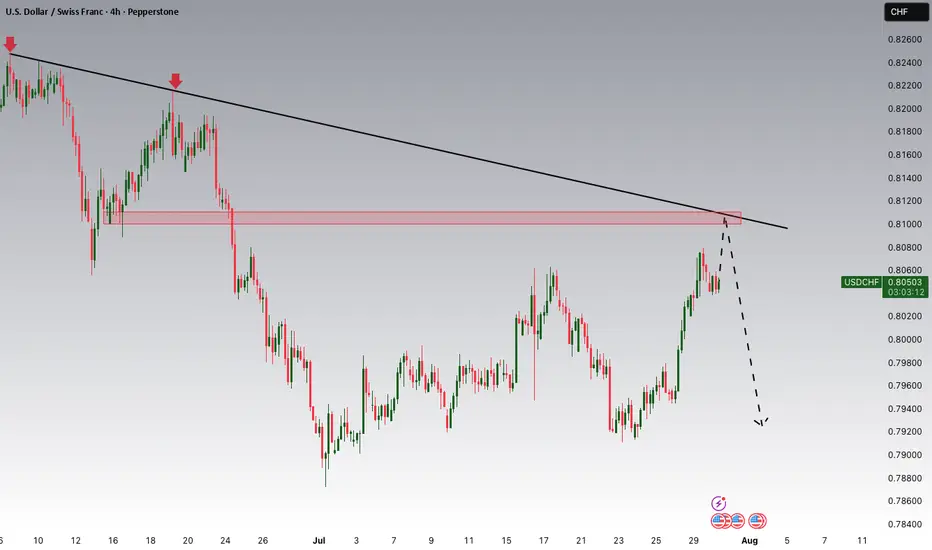
USDCHF Potential DownsidesHey Traders, in today's trading session we are monitoring USDCHF for a selling opportunity around 0.81000 zone, USDCHF is trading in a downtrend and currently is in a correction phase in which it is approaching the trend at 0.81000 support and resistance area.
Trade safe, Joe.
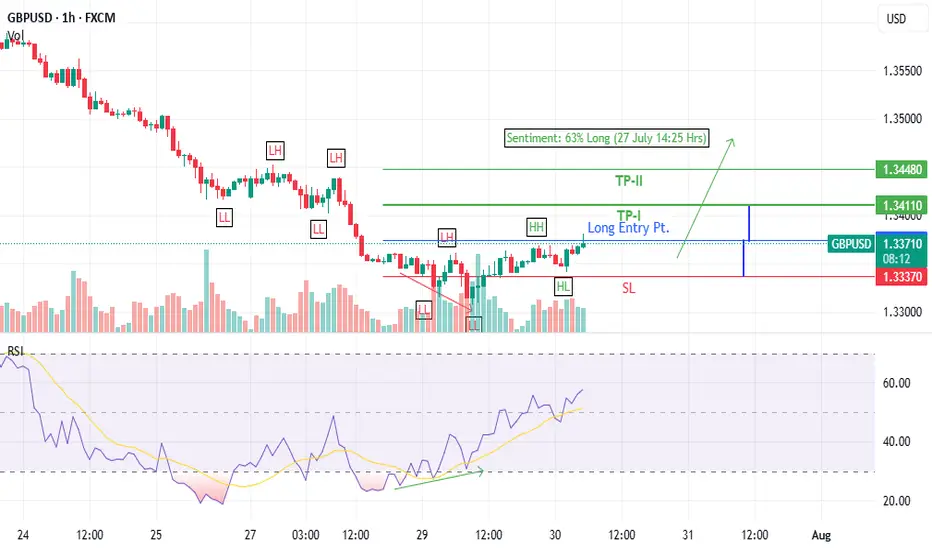
GBPUSD Long trade idea (30 July 2025)- Bullish Divergence on 1-H time frame
- Last LH broken at 1.3361
- Entered at CMP (1.33736)
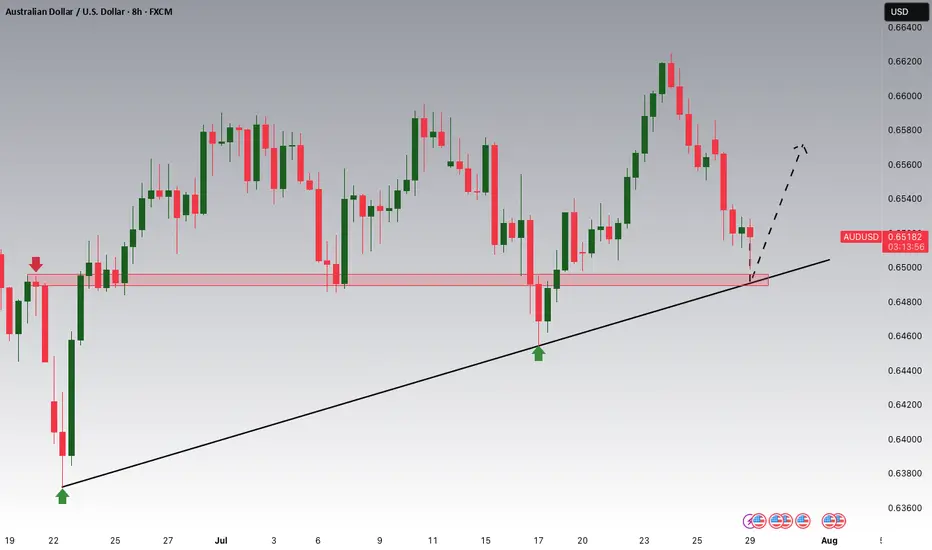
AUDUSD Potential UpsidesHey Traders, in today's trading session we are monitoring AUDUSD for a buying opportunity around 0.64900 zone, AUDUSD is trading in an uptrend and currently is in a correction phase in which it is approaching the trend at 0.64900 support and resistance area.
Trade safe, Joe.