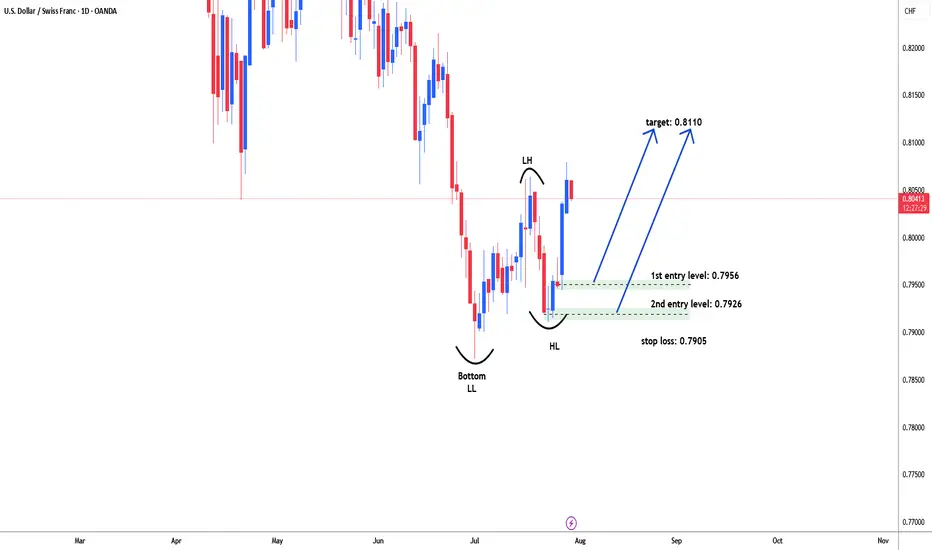
USDCHF possible bullish reversal for 0.8110#USDCHF forming higher high and higher low in daily time frame. broker initial resistance level as 0.8064 but did not hold price above it. need patient for pullback to test demand zone for another leg higher. Price could not breach lower low level 0.7873 and start moving higher. there are two different demand levels for long i.e. 0.7956 & 0.7626. stop loss below 0.7910 i.e 0.7985. target: 0.8110
Forex market
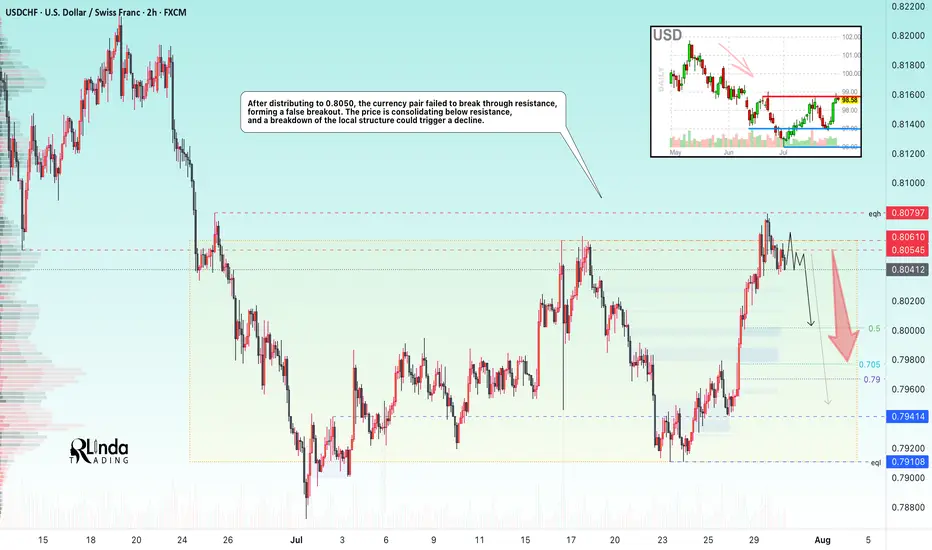
USDCHF → The resistance retest ended with a false breakoutFX:USDCHF tested resistance at 0.805 - 0.806 and formed a false breakout without the possibility of continuing growth. The global trend is downward...
Against the backdrop of the dollar's growth (reaction to news), the currency pair also moved to distribution to 0.8050. The price failed to break through resistance, forming a false breakout. USDCHF is consolidating below resistance, and a breakdown of the local structure could trigger a decline.
The dollar index is also facing fairly strong resistance and may continue its downward trend, which will also affect the decline in the USDCHF price.
Resistance levels: 0.805, 0.806, 0.81
Support levels: 0.800, 0.794, 0.791
If, within the current consolidation, the price begins to fall and break the local structure, then we can expect the decline to continue towards the specified targets!
Best regards, R. Linda!
Bearish - but first up then downBearish - but first up then down Bearish - We’re currently seeing a deceptive move: price is pushing upward into a supply zone or imbalance, likely to lure late buyers. The bigger picture remains bearish — structure is still respecting lower highs.
Play:
Expect a short-term move up to mitigate imbalances or tap supply (liquidity grab), followed by a strong rejection and continuation down in line with higher timeframe bearish structure.
Watching for a sharp CHoCH or bearish engulfing in key zones to reinforce the sell.
Let me know if you want this in a more coded style just for your trading group.

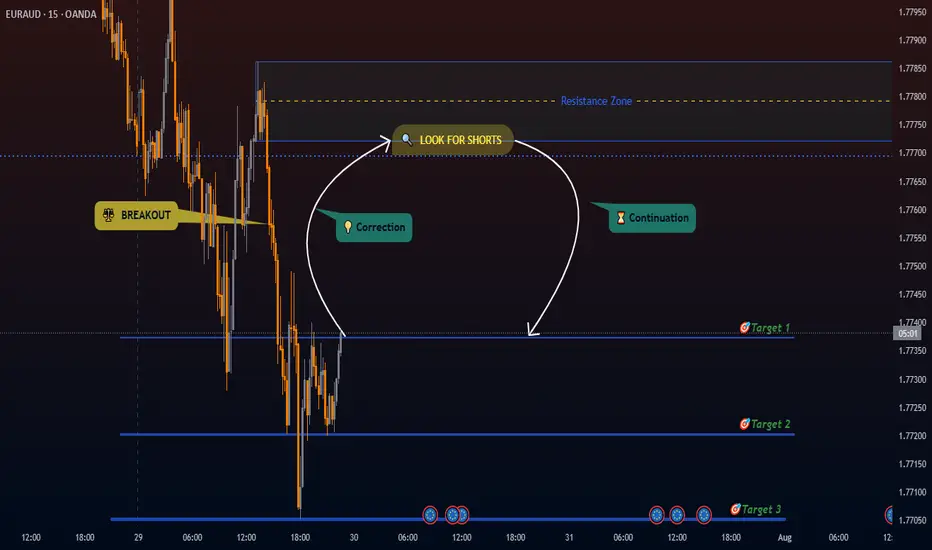
EURAUD Potential Bearish Setup Distribution pattern with breakdown below key support suggests downside momentum.
Break above our Resistance zone will invalidate our trade setup; good idea to watch out if that happens.
- Breakdown Level: 1.77694 -1.77722
- Entry Strategy: Sell orders at BOS
- Stop Loss: Above Resistance zone
- Target Zones:
- Primary Target: Target 1 (R:R 1:2)
- Secondary Target: Target 2 (R:R 1:3)
- Extension Target: Target 3 (R:R 1:4)
Bearish/Bullish Confirmations:
🔻 Rejection candlestick patterns
🔻 Bearish Reversal patterns
🔻 Impulsive moves in line with setups directional bias
Position Management:
- Exit: Partial profits at targets
- Stop adjustment: Trail stops when target are hit
LIKE or COMMENT if this idea sparks your interest, or share your thoughts below!
FOLLOW to keep up with fresh ideas.
Tidypips: "Keep It Clean, Trade Mean!"
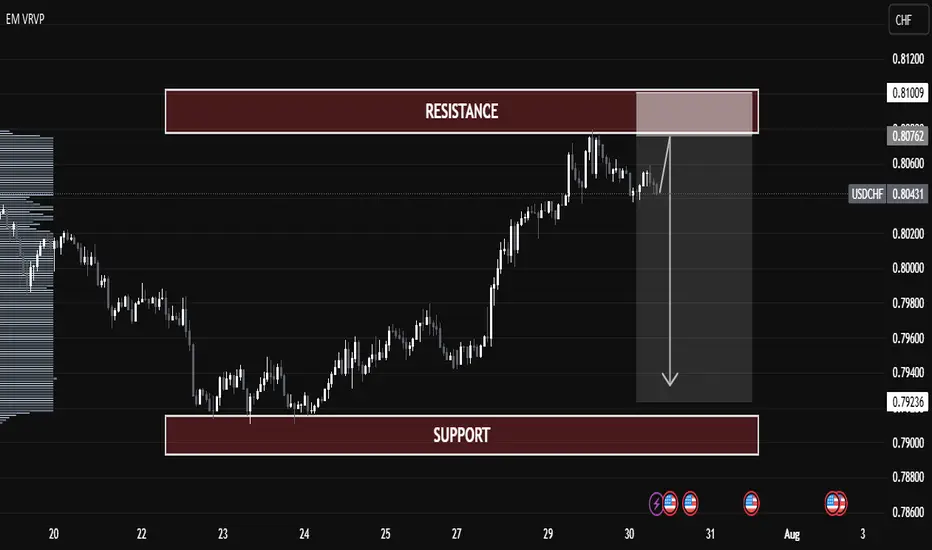
USDCHF Technical Analysis – Potential Rejection from Resistance USDCHF Technical Analysis – Potential Rejection from Resistance
🔍 Chart Overview:
Current Price: 0.80456
Resistance Zone: 0.80760 – 0.81009
Support Zone: 0.79000 – 0.79236
Price Action: The pair has rallied into a strong resistance zone but is showing signs of exhaustion.
📌 Key Observations:
Volume Profile Insight:
Price has entered a low-volume area near resistance, indicating potential weakness in demand above 0.80800.
Resistance Rejection:
Price tested the 0.80760–0.81009 resistance range and failed to break through decisively.
A potential fake breakout or bull trap could be forming.
Bearish Projection:
If price confirms rejection from resistance, we may see a drop toward the support zone (0.79000 – 0.79236).
This would complete a classic resistance-to-support rotation.
Bearish Confirmation:
A bearish candle formation or break below 0.80350 can trigger short entries.
Ideal risk-reward favors a short setup here.
📉 Trade Plan (Educational Purpose Only):
Entry Zone: 0.80750 – 0.80950
Stop Loss: Above 0.81100
Take Profit Target: 0.79250
Risk-Reward: Approx. 1:2.5
🔻 Summary:
USDCHF is trading near a major resistance zone with weak bullish momentum. If confirmed, a sharp reversal toward support is expected, making this a potentially strong short opportunity.
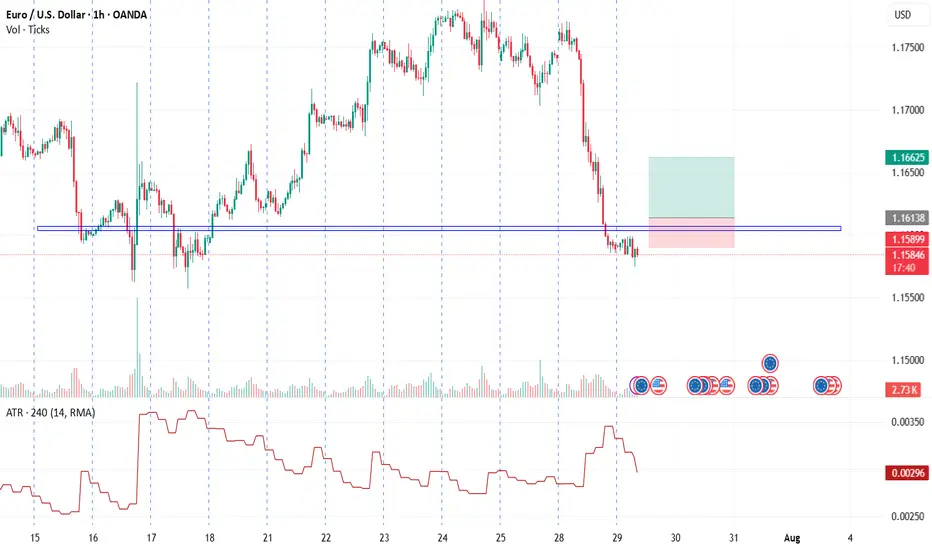
DXY Rebound Pulls EURUSD Below 1.16Following the DXY’s significant rebound off a 17-year trendline, the EURUSD has broken below a trendline that connected all consecutive lows of 2025. This opens the door to further bearish risks, with key support levels now in sight.
If the pair closes cleanly below 1.15, 1.1440 and 1.1380, downside extensions could reach 1.12 and 1.11, respectively.
On the upside, a close back above the 2025 trendline and the 1.18 mark could reinstate bullish momentum, potentially lifting the pair toward the 2021 highs between 1.20 and 1.23.
Written by Razan Hilal, CMT
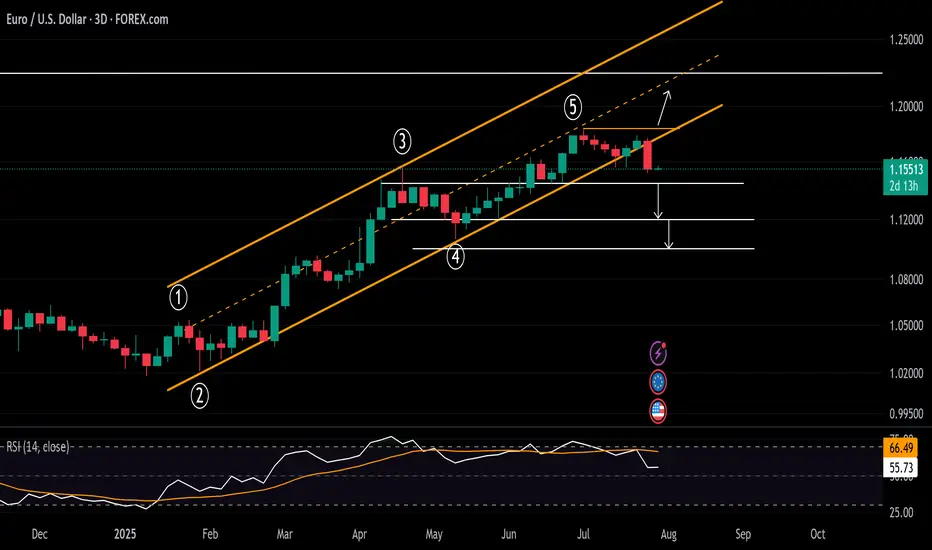
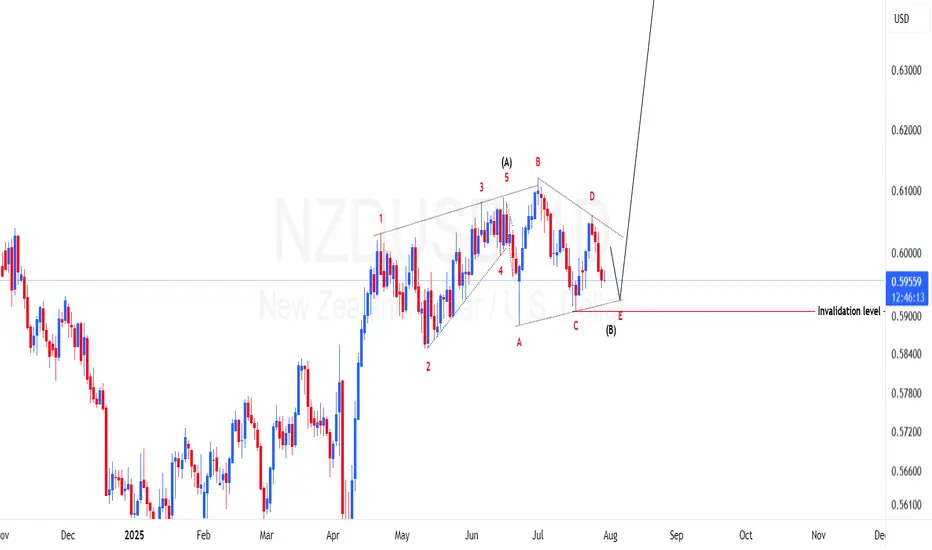
NZDUSD potential 600 pips in makingPrice of NZDUSD have made a structure that has a high probability to be a triangle just after a leading diagonal. If this view is favored then we should expect price to regain its bullish momentum to make wave C. To take advantage of this possibility a trade should find areas of support to go long. One of the places is as marked on the chart on lower trendline of the triangle.
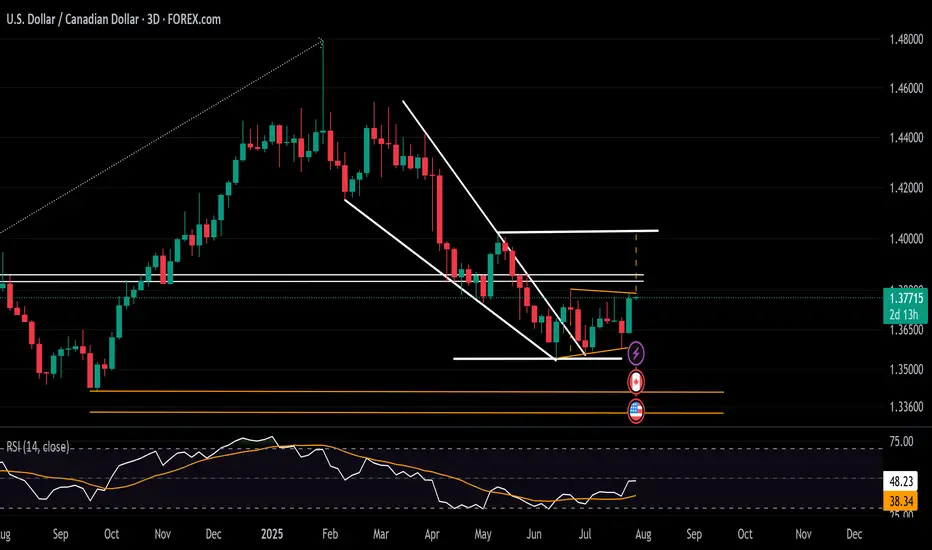
USDCAD Rebound Steadies Ahead of BOC and FOMC MeetingsAligned with the DXY holding above the 96 support and approaching the 100-resistance, the USDCAD is maintaining a rebound above the 1.3540 level.
It has maintained a hold beyond the boundaries of a contracting downtrend across 2025 and is aiming for the 1.38 resistance to confirm a steeper bullish breakout.
A sustained move above 1.38, which connects lower highs from June and July, while the RSI holds below the 50 neutral line, could extend gains toward the 1.40 level.
From the downside, should the breakout above 1.38 fail, the pair may remain trapped within the consolidation range extending from June, with initial support seen at 1.3580.
Written by Razan Hilal, CMT
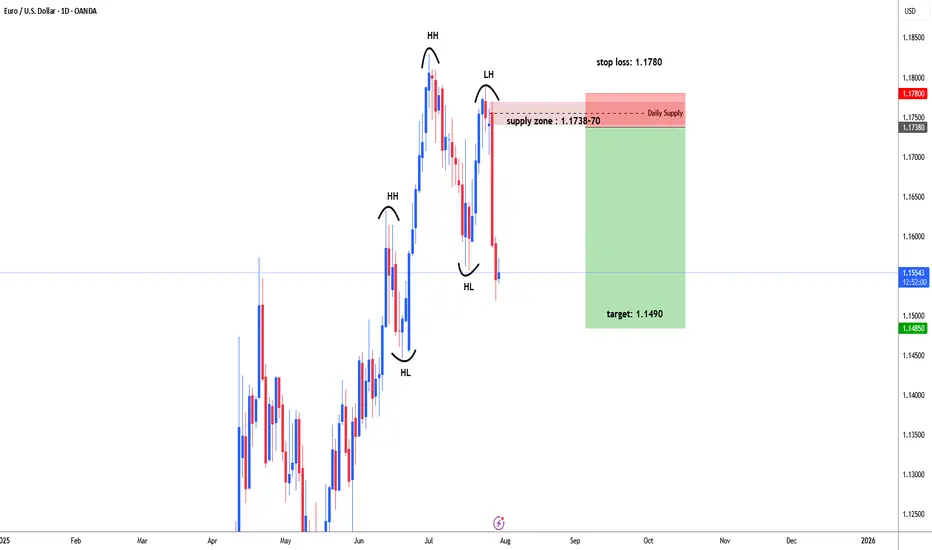
EURUSD possible bearish for 1.1490#EURUSD failed to form higher high and higher low to continue bullish trend. eurusd made a high on 1st July 1.1830, then price started retrace downside. 7th July daily bearish engulfing candle formed , early indication for selling. 23rd July price moved up side to test supply zone. Price did not break high of bearish engulfing candle and fall back. Price started heavily fall and broke recent supply level 1.1557 and form Lower High that is indication for trend reversal.
1.1738-70 ideal level for selling which is daily supply zone. stop loss above 1.1770 i.e. 1780-1.1800. target: 1.1490 and even may expect further down.
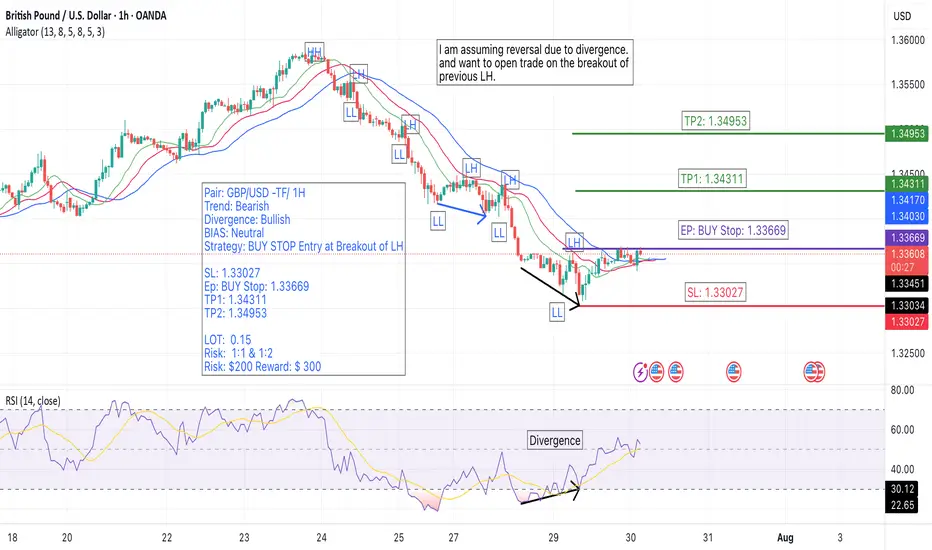
GBP/USD 1H Trade Setup – Bullish Reversal OpportunityCurrently observing the GBP/USD pair on the 1-hour timeframe.
🔹 The overall trend is still bearish, but a bullish divergence has already formed—indicating a potential reversal.
🔹 We're adopting a neutral bias for now and planning a BUY STOP entry at the breakout of the previous Lower High (LH).
🔹 If the breakout confirms, this could mark the beginning of a bullish trend shift.
📌 Trade Setup Details:
Pair: GBP/USD
Timeframe: 1H
Trend: Bearish
Divergence: Bullish
Bias: Neutral
Strategy: BUY STOP at LH Breakout
💼 Trade Parameters:
🔸 Entry (EP): 1.33669
🔸 Stop Loss (SL): 1.33027
🎯 Take Profit 1 (TP1): 1.34311 (R:R 1:1)
🎯 Take Profit 2 (TP2): 1.34953 (R:R 1:2)
📊 Position Size: 0.15 LOT
💰 Risk per Trade: $200
💵 Reward Target: Up to $300
🧠 Execution: Splitting into two trades – one targeting TP1, the other TP2
📎 Why We Like This Setup:
✅ Bullish divergence suggests weakening bearish momentum
✅ Breakout above LH could confirm bullish reversal
✅ Clean structure with clearly defined SL and TP
✅ Strategic split-exit improves risk-to-reward flexibility
💬 Comment and share your thoughts on this trade!
🔔 Follow me for more high-probability setups and technical insights. Let’s grow together! 🚀
💬 Let us know if you're watching this setup too!
#GBPUSD #ForexSetup #ForexSignals #PriceActionTrading #TrendReversal #ForexStrategy #TechnicalAnalysis #SmartMoneyConcepts #DivergenceTrading #BullishSetup #BuyTheBreakout #ChartPattern #1HourChart #ForexMarket #RiskReward #ForexTradeSetup #ForexEntry #TradeIdeas #FXTrading #SwingTrading #BreakoutStrategy #MarketStructure #TradingPlan #TradersMindset #TradingCommunity
EurUsd Going Bullish 20 to 30 pipsEur usd now buy mode 20 to 30 pips .
If anyone wanted to learn this System Analysis contrect with me .
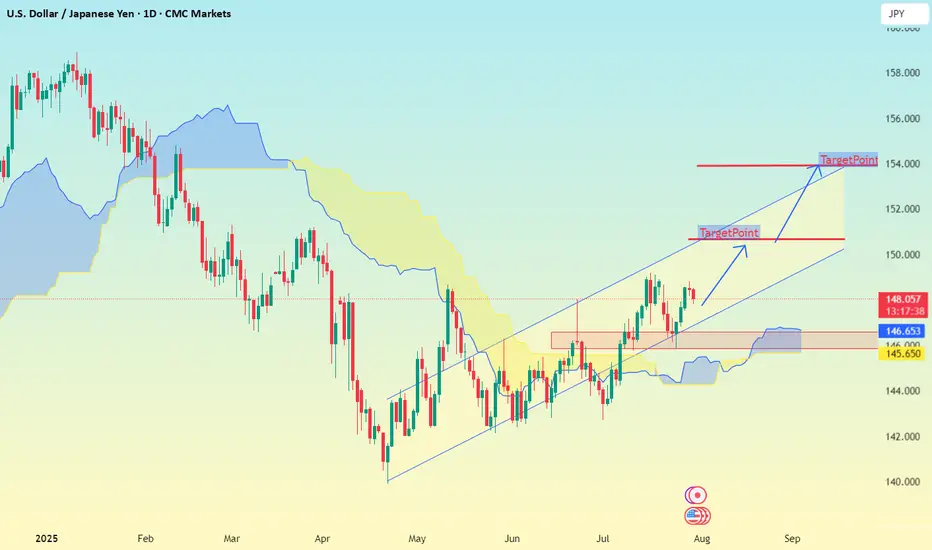
USD/JPY on the 1D timeframeBased on the chart I provided for USD/JPY on the 1D timeframe, here is the target analysis:
📉 Downtrend Analysis:
The chart is showing a descending channel, indicating a bearish trend.
Price has been respecting the upper and lower bounds of the channel.
Two target zones are marked with labels “TakeProfit”, suggesting projected bearish targets.
🎯 Identified Targets:
1. First Target Zone (TakeProfit):
📍 Around 152.00
This is the first expected support area where price may bounce or consolidate.
2. Second Target Zone (TakeProfit):
📍 Around 146.50 – 146.00
This level aligns with historical support and volume profile concentration.
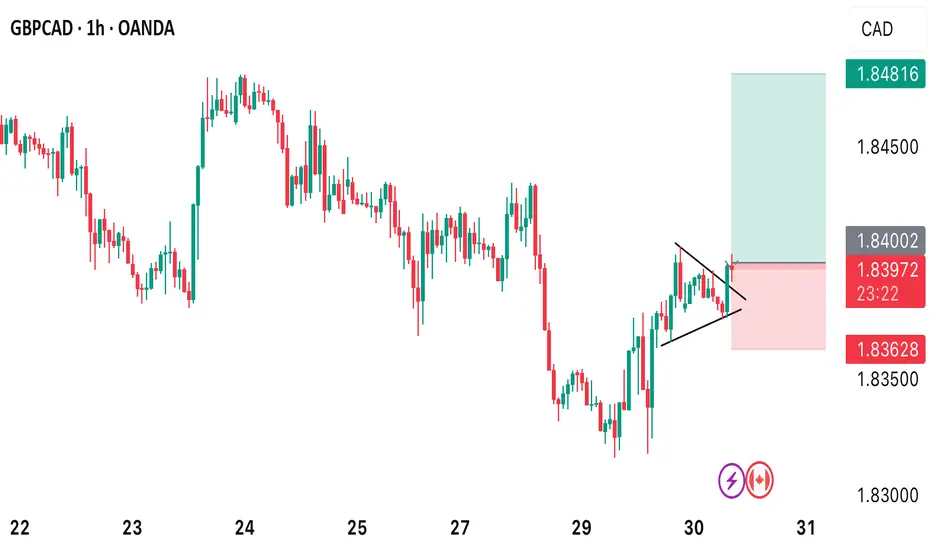
GBPCAD BUY OPPORTUNITY Price provides a buy opportunity from the current market price of 1.84002. As support level of 1.83192 remain unbroken and the recently formed triangular pattern which is a continuation pattern also get broken. Our buy target profit level is 1.84816.
Take advantage of this potential opportunity.
USDCHF 23.07.25~+ Pressure on Powell, Waller is dovish
~+ Anticipation of the Trade deals deadline
+ Risk-on general sentiment after Japan trade deal

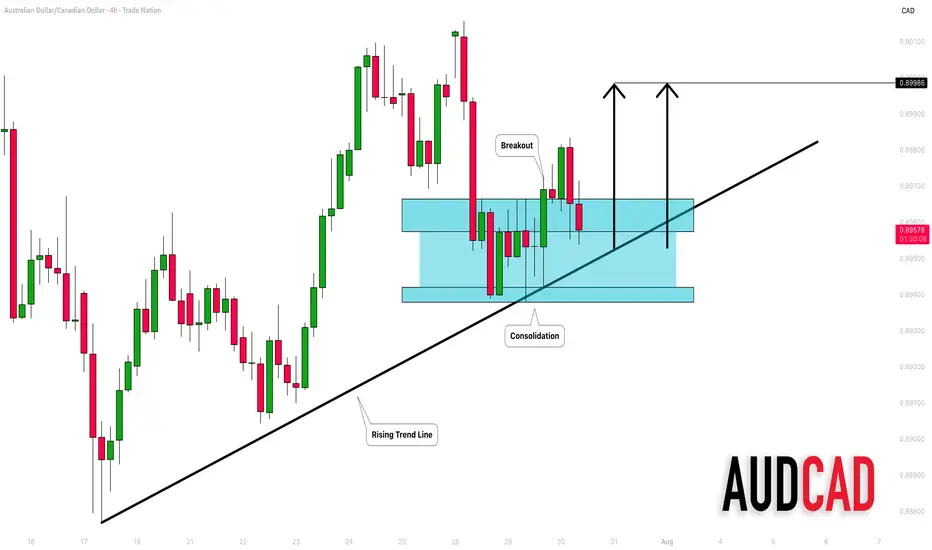
AUDCAD: Bullish Move From Trend Line 🇦🇺🇨🇦
AUDCAD may bounce from a solid rising trend line on a 4H.
The price started to consolidate on that after its test.
A breakout of a minor horizontal resistance is a strong bullish confirmation.
Goal - 0.8999
❤️Please, support my work with like, thank you!❤️
I am part of Trade Nation's Influencer program and receive a monthly fee for using their TradingView charts in my analysis.
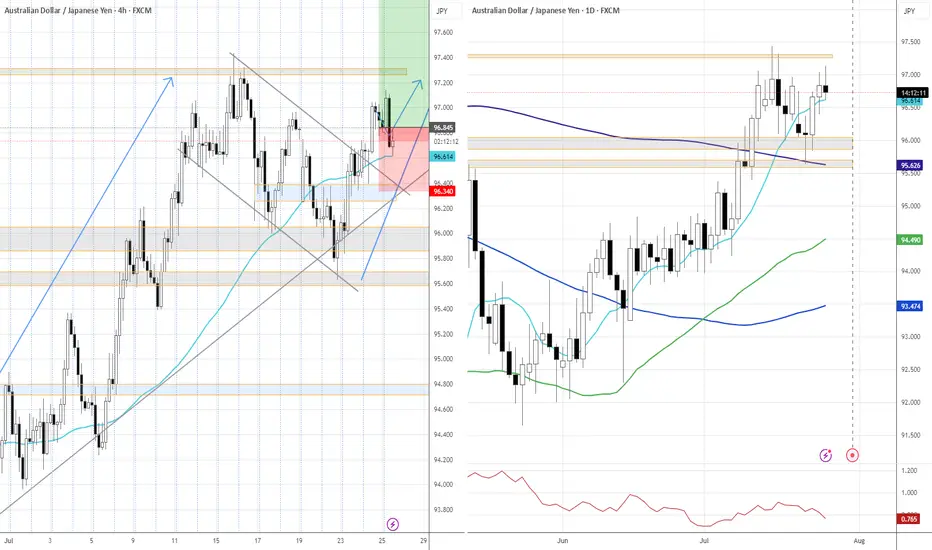
AUDJPY 24.07.2025+~ RBA is relatively hawkish
+~ Political uncertainty around JPY
+~ Positive trade deals anticipation
*Swing trade; giving a room for a reasonable pullback; will potentially look to scale in at the resolve of a newly-formed structure.

#AN022: Geopolitical Tensions and Forex Pressure
Hello, I'm Forex Trader Andrea Russo, and today I want to talk to you about this week's latest geopolitical tensions.
1. The Russian ruble in crisis, weakening against the USD and CNY
The ruble fell 1.5% against the dollar and 0.8% against the yuan, following a US ultimatum to Moscow for an immediate truce in Ukraine.
FX Impact: The ruble remains vulnerable, fueling demand for safe-haven currencies such as the USD, EUR, and CHF. Crosses against the RUB show potential technical short reversals.
2. Oil Rises: First Impacts on Energy Costs
Brent prices rose 3.5% to $72.50 a barrel following the announcement of possible US sanctions on buyers of Russian oil.
FX Impact: Oil-related currencies such as the CAD and NOK benefit; USD risks weakness if importing countries experience inflationary pressures.
3. Euro falls monthly for the first time, dollar strengthens
The euro is in the red on a monthly basis for the first time in 2025, while the dollar benefits from cautious Fed rate expectations and the EU-US trade deal perceived as biased toward Washington.
Forex Impact: EUR/USD is under structural pressure. Euro-commodity correlates (EUR/CAD, EUR/AUD) are showing signs of weakness.
4. IMF warns of US tariffs and rising global inflation
In its latest report, the IMF emphasized that US tariffs are slowing global growth and fueling persistent inflationary pressures.
FX Impact: Increased uncertainty favors the USD and CHF. Emerging economies and commodity-linked economies (MXN, ZAR, BRL) could weaken further.
5. India Strengthens: Growing Exports and Solid Reserves
India recorded a 7.2% increase in merchandise exports and maintains stable foreign exchange reserves, demonstrating macroeconomic resilience and the resilience of the rupee.
Forex Impact: The INR could strengthen or consolidate at robust levels, while USD/INR pairs signal potential support.
6. Global Digital Projects and Fragmentation of Payment Systems
The adoption of alternative systems to SWIFT such as mBridge or Project Agorá reflects a push toward global financial independence.
Forex Impact: The euro and dollar remain dominant, but the RMB is gaining ground in Asia-Pacific countries. RMB crosses (USD/CNH, EUR/CNH) require attention, especially from a long-term perspective.

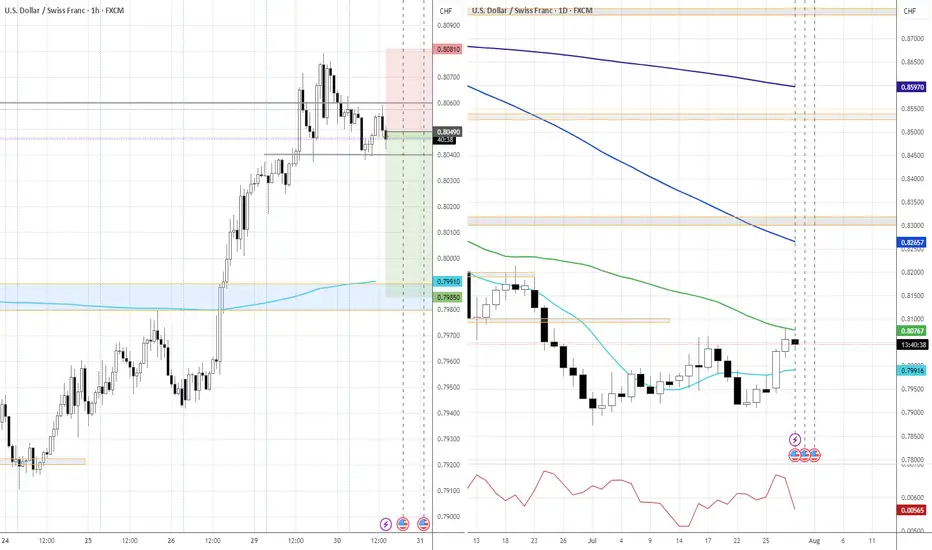
USDCHF 30.07.2025~+ Lack of credibility, general narrative around the USD & Fed, shaky geopolitics
~+ Timing: dollar bulls' profit-taking into the Fed Rate Decision
~+ Swiss KOF Beat
* USD move from the US-EU trade deal looks overdone against multiple assets
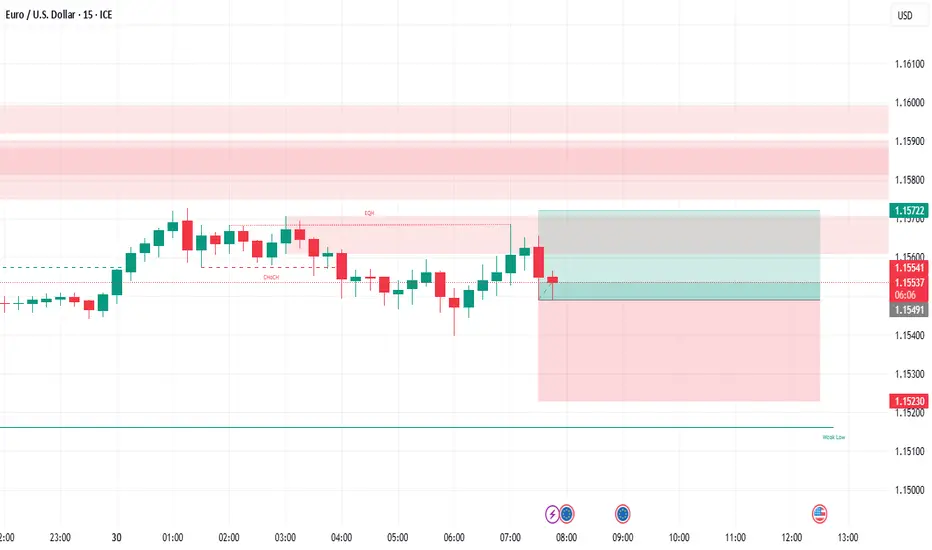
EUR USD long As the EUR treaty yesterday gave strength to the USD and "made America great again," today we’re seeing a correction. This setup is based on a value gap—if price breaks through this gap, there's a strong chance it will reach the next zone quickly. A buy setup could be effective in this scenario.
Disclaimer: This analysis is for educational purposes only and does not constitute financial advice. Always do your own research before making any trading decisions.
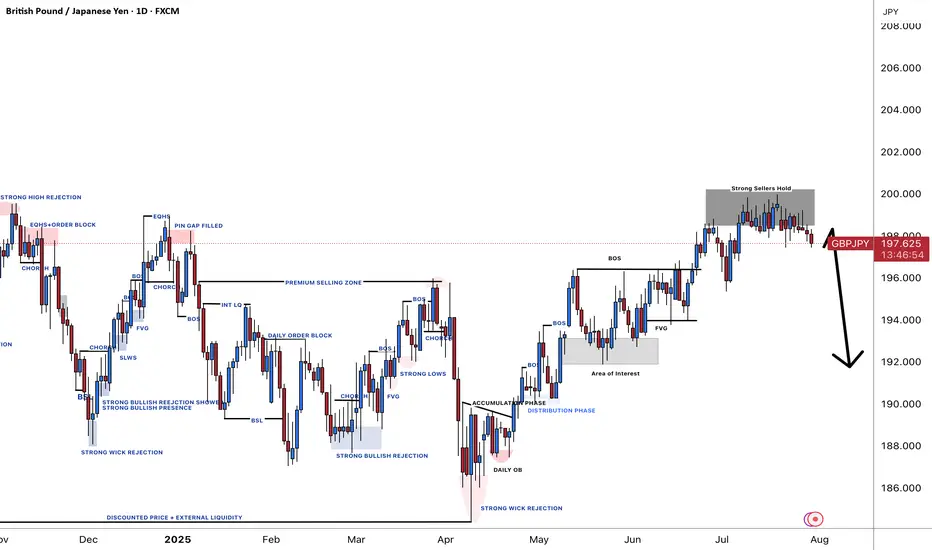
GBPJPY; 600+ PIPS Possible Selling Opportunity GBPJPY has failed to breakthrough 200 price region, suggesting a strong sellers hold. Price behaviour and volume show the same thing. Our target is at 191 which will be a 600 to 700 pips move.
Good luck and trade safe
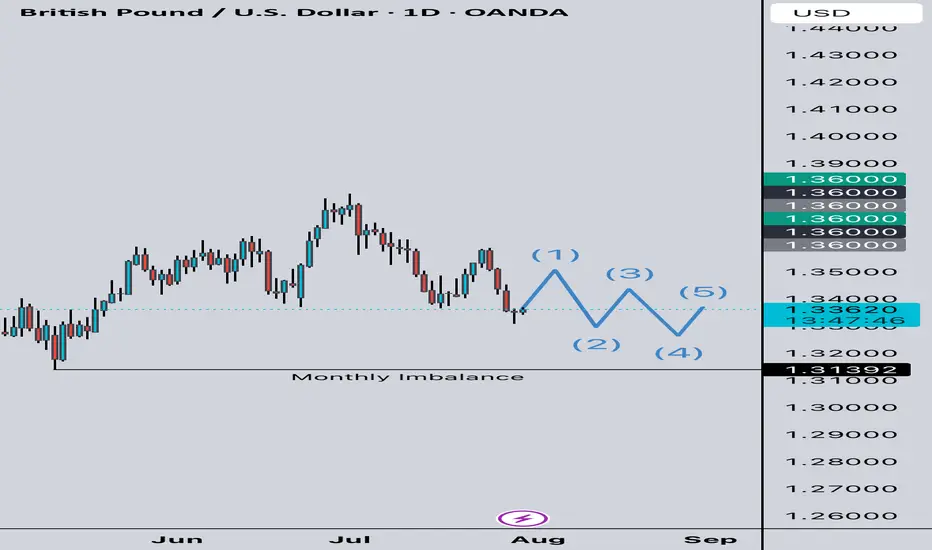
GBP USD Long Term SellAs we are approaching NFP and FOMC, the outlook for me will be a no rate change and with the consensus being USD Long, it makes sense for GBP USD to sell off. Monthly, Weekly and Daily looking like it wants to continue down after a manipulation bringing GBP USD higher in the short term. A lot of pips to the downside into the end of this week and next week. Definitely one to keep an eye on.
Levels im interested on EU | Price Action BreakdownHere's my current view on EURUSD I’m watching a few key zones based on structure, previous liquidity grabs, and confluences lining up this week.
Short-term price expectations
Educational purpose only this is not financial advice.
